
What is Lenovo Goal Mission Vision SWOT Analysis


- Slides: 12
What is Lenovo Goal Mission & Vision SWOT Analysis Business Groups Strategy Financial Results
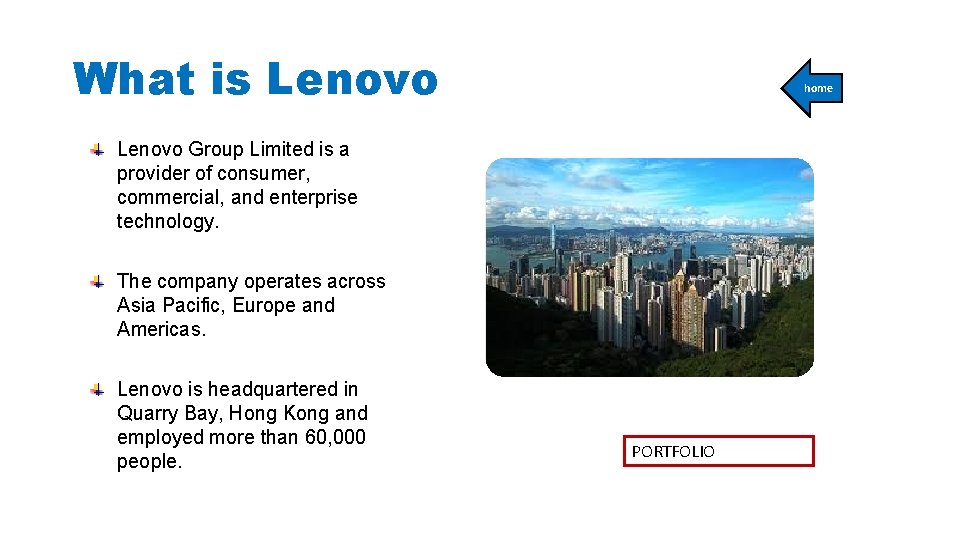
What is Lenovo home Lenovo Group Limited is a provider of consumer, commercial, and enterprise technology. The company operates across Asia Pacific, Europe and Americas. Lenovo is headquartered in Quarry Bay, Hong Kong and employed more than 60, 000 people. PORTFOLIO
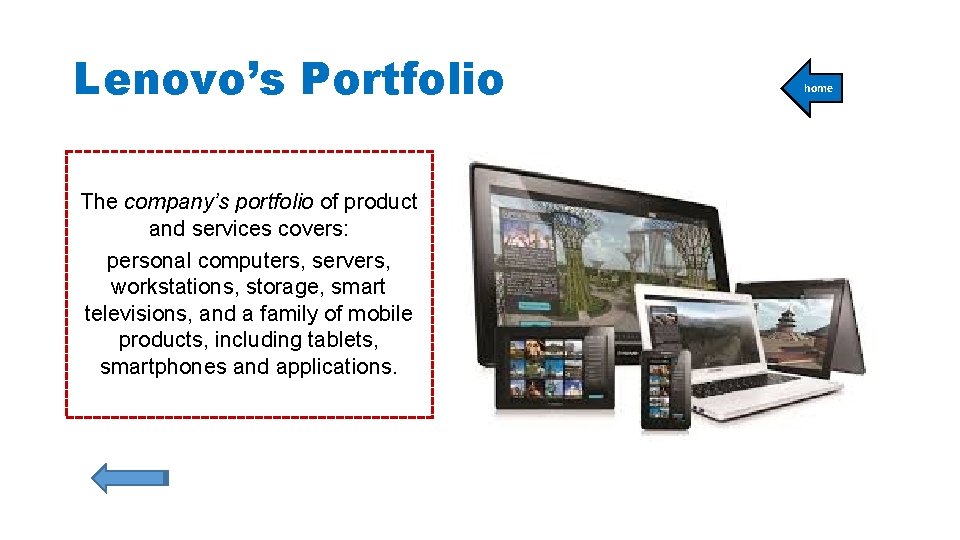
Lenovo’s Portfolio The company’s portfolio of product and services covers: personal computers, servers, workstations, storage, smart televisions, and a family of mobile products, including tablets, smartphones and applications. home
Lenovo’s Mission & Vision Our vision is that Lenovo will create: personal devices more people are inspired to own, a culture more people aspire to join, an enduring, trusted business that is well respected around the world. Our mission is to become one of the world's great personal technology companies. home
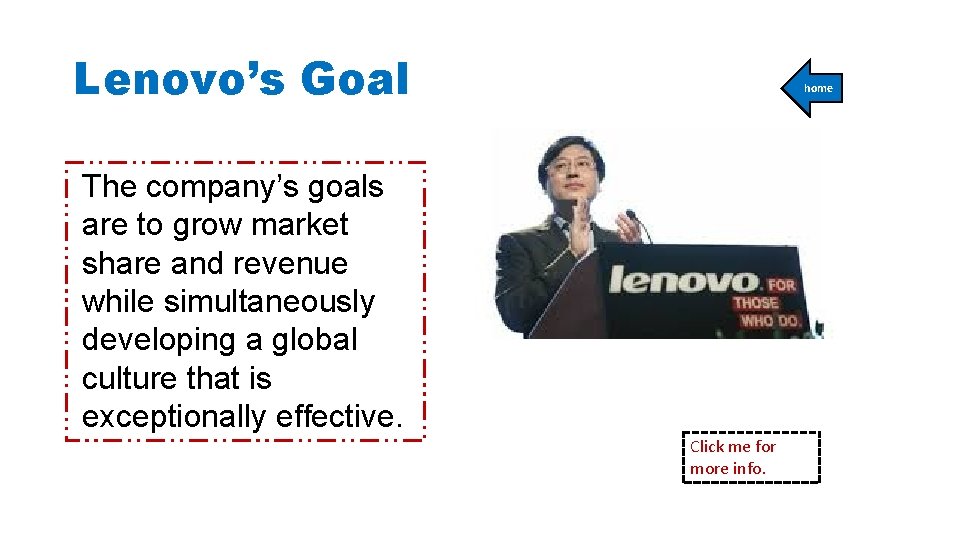
Lenovo’s Goal home The company’s goals are to grow market share and revenue while simultaneously developing a global culture that is exceptionally effective. Click me for more info.
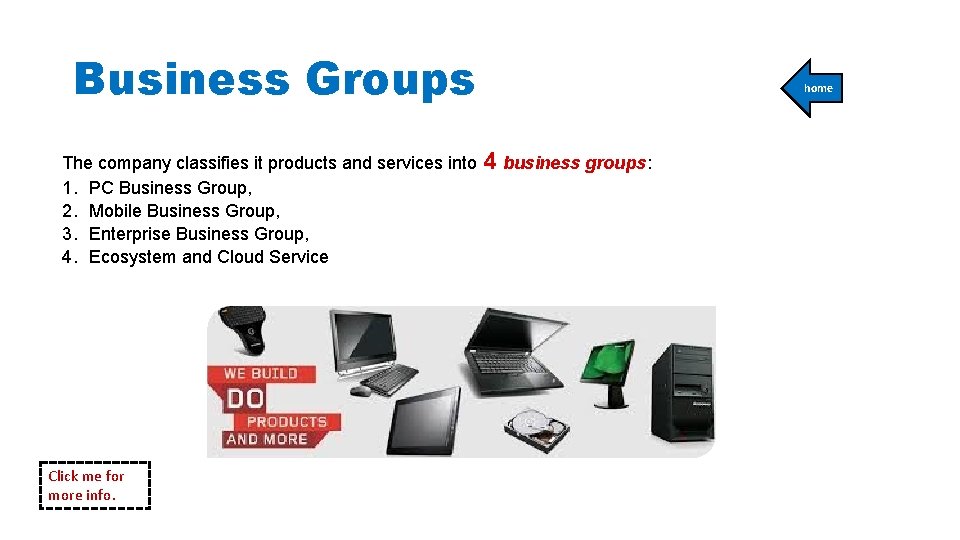
Business Groups The company classifies it products and services into 4 business groups: 1. PC Business Group, 2. Mobile Business Group, 3. Enterprise Business Group, 4. Ecosystem and Cloud Service Click me for more info. home
SWOT Analysis home STRENGTHS WEAKNESSES • Leading player in worldwide PC market • Significant product recalls could affect • Strong performance across all product brand image lines • Low brand perception in the developed • Exposure to highly growing Chinese economies market • Strong presence in PC+ market OPPORTUNITIES • Growing smartphone and tablet market • Positive outlook for cloud computing market • Strategic acquisitions to boost product portfolio & provide topline growth THREATS • Competitive pressure could reduce market share • Negative trends in PC sales could impact Revenues • Declining average selling prices may strain margins Click me for more info.
Lenovo’s Strategy "Protect and Attack" home = 2011's strategy Protecting its core legacy business and geographic presence while attacking new market opportunities in regions with high growth potential. Lenovo wants to apply its "Protect and Attack" strategy across all geographies, customer segments and product lines as the organization continues to build its business worldwide. The “Protect and Attack” strategy aims to reach not only the markets of the most developed countries, such as Europe and United States, but also the markets of emerging countries, such as India and Southeast Asia. How to implement…
How to succeed? The effectiveness of the strategy is based on 5 main features: 1. Continue to expand its lead in PC market share in China and grow its share in the commercial sector with servers and workstations. 2. Expand share gains in mature markets through home and retail channels. 3. Grow mobile Internet presence globally. 4. Drive convergence with cloud devices, attractive apps to reach the best user experience. 5. Reach 10 percent share benchmarks in emerging key countries. home
Financial Results The company recorded revenues of $46, 295. 6 million during the financial year ended March 2015 (FY 2015) an increase of 19. 6% over FY 2014. home Revenues Per Business Unit The operating profit of the company was $1, 108. 5 million in FY 2015 an increase of 5. 4% over FY 2014. The net profit of the company was $828. 7 million in FY 2015 an increase of 1. 4% over FY 2014. Financial Ratios
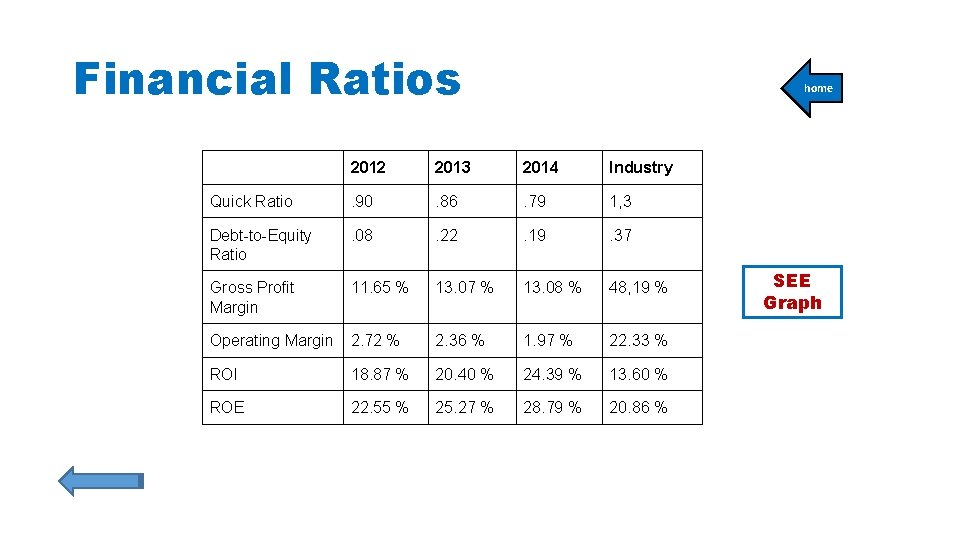
Financial Ratios home 2012 2013 2014 Industry Quick Ratio . 90 . 86 . 79 1, 3 Debt-to-Equity Ratio . 08 . 22 . 19 . 37 Gross Profit Margin 11. 65 % 13. 07 % 13. 08 % 48, 19 % Operating Margin 2. 72 % 2. 36 % 1. 97 % 22. 33 % ROI 18. 87 % 20. 40 % 24. 39 % 13. 60 % ROE 22. 55 % 25. 27 % 28. 79 % 20. 86 % SEE Graph
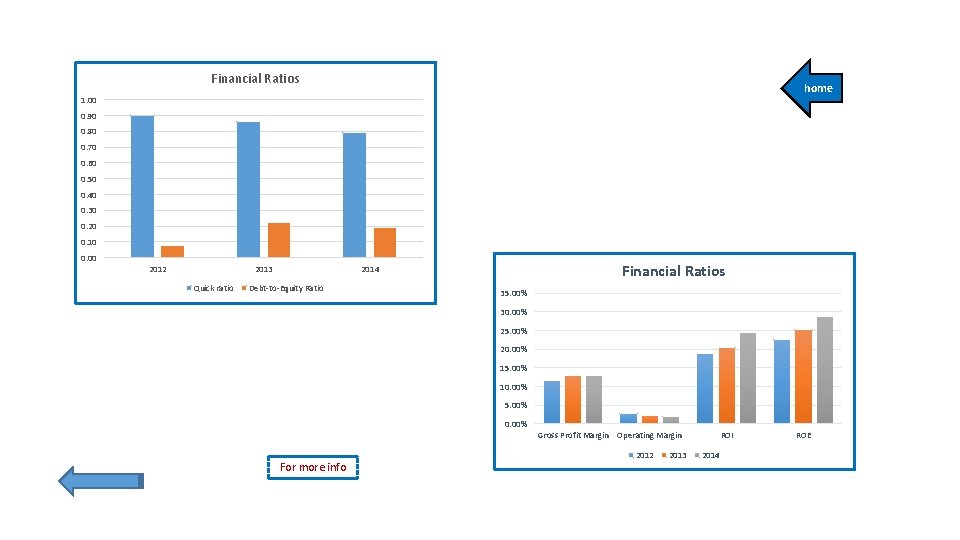
Financial Ratios home 1. 00 0. 90 0. 80 0. 70 0. 60 0. 50 0. 40 0. 30 0. 20 0. 10 0. 00 2012 2013 Quick ratio Financial Ratios 2014 Debt-to-Equity Ratio 35. 00% 30. 00% 25. 00% 20. 00% 15. 00% 10. 00% 5. 00% 0. 00% For more info Gross Profit Margin Operating Margin 2012 2013 ROI 2014 ROE