What is food security Food security exists when


- Slides: 25
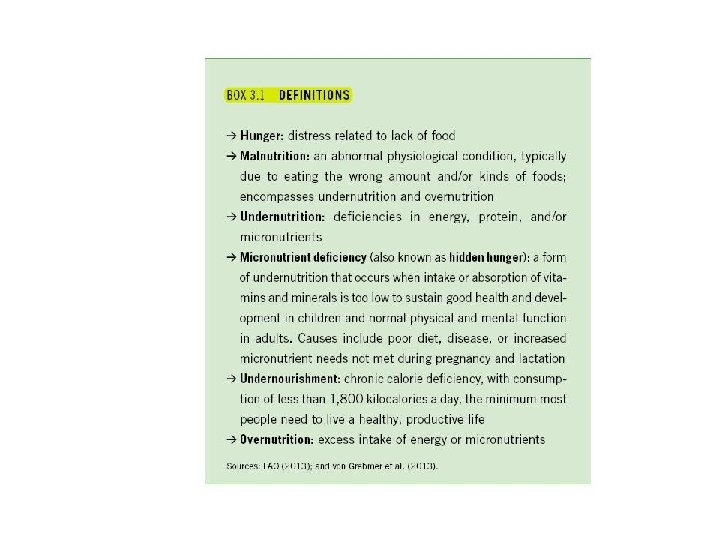
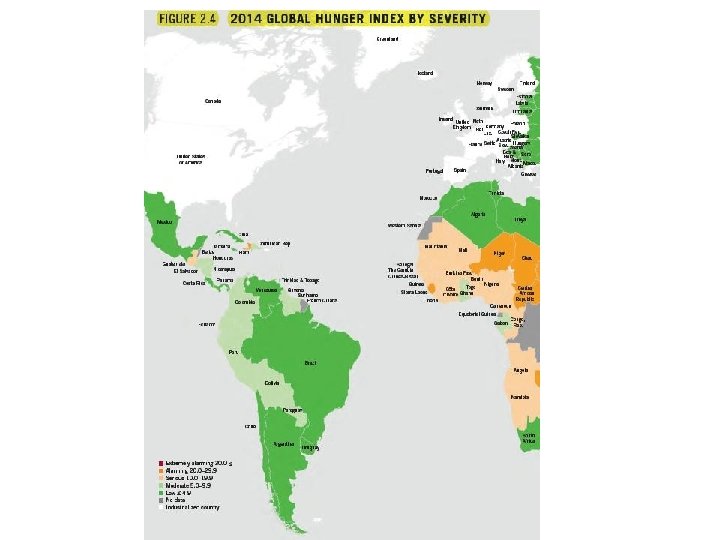
What is food security? Food security exists when all people, at all times, have nutritious food that meets their dietary needs and food preferences for an active and healthy life
DIMENSIONS OF FOOD SECURITY Ø Availability l l Local Production Imports Ø Accessibility l Governance / Marketing Ø Affordability l Increase In Income Level l Targeted Subsidies
WORLD CEREAL MARKET Production 1/ Supply 2/ Utilization Trade 3/ Ending stocks 4/ World stock-touse ratio Major exporters' stock-todisappearance ratio 5/ (. . . million tonnes. . . . (. . . percent. . . . ). ) 2004/05 2070. 6 2493. 6 2020. 3 247. 7 473. 7 23. 2 17. 2 2005/06 2048. 6 2522. 3 2041. 3 247. 5 467. 0 22. 4 18. 1 2006/07 2016. 3 2483. 2 2072. 1 257. 6 418. 1 19. 0 13. 9 2007/08 2131. 3 2549. 4 2137. 1 274. 0 414. 2 18. 4 14. 5 2008/09 2285. 1 2699. 2 2187. 5 285. 4 493. 7 22. 1 19. 2 2009/10 2265. 7 2759. 4 2232. 4 278. 5 523. 9 23. 1 19. 6 2010/11 2257. 4 2781. 3 2272. 6 288. 9 501. 8 21. 6 17. 4 2011/12 2353. 7 2855. 5 2325. 6 321. 0 522. 3 22. 4 17. 9 2012/13 2304. 4 2826. 7 2328. 2 314. 3 506. 1 20. 9 16. 9 2013/14 2525. 2 3031. 3 2416. 4 356. 2 578. 6 23. 5 17. 6 2014/15 2532. 1 3110. 7 2464. 6 338. 5 628. 4 25. 2 18. 6
WORLD WHEAT MARKET Production 1/ Supply 2/ Utilization Trade 3/ Major exporters' World stock-to. Ending stocks 4/ use ratio disappearance ratio 5/ (. . . million tonnes. . . . (. . . percent. . . . ) 2004/05 632. 7 797. 5 619. 3 112. 5 179. 1 28. 5 20. 7 2005/06 626. 0 805. 1 623. 0 111. 7 175. 5 27. 7 21. 3 2006/07 601. 5 777. 0 627. 2 113. 8 152. 1 23. 3 14. 1 2007/08 611. 9 764. 0 627. 9 113. 6 134. 0 19. 9 12. 9 2008/09 682. 1 816. 1 645. 7 141. 0 161. 6 24. 6 18. 1 2009/10 685. 7 847. 3 655. 5 131. 2 190. 1 28. 9 21. 7 2010/11 653. 8 844. 0 658. 7 128. 0 184. 8 26. 4 20. 7 2011/12 702. 4 887. 2 699. 2 148. 2 181. 0 26. 3 18. 0 2012/13 660. 6 841. 5 687. 4 141. 8 158. 3 23. 0 14. 1 2013/14 717. 2 875. 5 687. 9 157. 3 175. 3 24. 9 14. 1 2014/15 724. 9 900. 2 703. 8 150. 0 192. 7 27. 0 16. 0
WORLD RICE MARKET Production 1/ Supply 2/ Utilization Trade 3/ Ending stocks 4/ World stock-touse ratio Major exporters' stock-todisappearance ratio 5/ (. . . million tonnes. . . . (. . . percent. . . ). ) 2004/05 2005/06 2006/07 2007/08 2008/09 2009/10 2010/11 2011/12 2012/13 2013/14 2014/15 406. 5 423. 6 427. 8 440. 1 459. 2 456. 0 469. 8 486. 0 490. 5 497. 5 495. 6 513. 5 524. 7 534. 2 547. 7 574. 3 587. 0 607. 6 631. 5 652. 5 673. 3 676. 9 412. 9 418. 6 424. 3 434. 3 443. 9 448. 0 461. 6 469. 8 477. 4 491. 2 499. 6 29. 9 29. 2 31. 6 30. 1 29. 6 31. 3 36. 1 38. 7 37. 3 40. 2 40. 5 101. 1 106. 4 107. 6 115. 1 131. 0 137. 8 145. 4 162. 0 175. 7 181. 2 177. 4 24. 2 24. 9 24. 2 25. 7 29. 3 29. 9 30. 9 33. 9 35. 8 36. 3 34. 8 1/ Production data refer to the calendar year of the first year shown. Rice production is expressed in milled terms. 2/ Production plus opening stocks. 3/ Trade data refer to exports based on a July/June marketing season for wheat and coarse grains and on a January/December marketing season for rice (second year shown). 4/ May not equal the difference between supply and utilization due to differences in individual country marketing years. 5/ Major wheat exporters are Argentina, Australia, Canada, the EU, Kazakhstan, Russian Federation, Ukraine and the United States; major coarse grain exporters are Argentina, Australia, Brazil, Canada, the EU, Russian Federation, Ukraine and the United States; major rice exporters are India, Pakistan, Thailand, the United States, and Viet Nam. Disappearance is defined as domestic utilization plus exports for any given season. 13. 5 16. 7 16. 6 18. 9 23. 5 21. 6 20. 7 25. 0 28. 2 27. 6 24. 8