
What is DEER Database for Energy Efficient Resources
What is DEER? Ø Ø Database for Energy Efficient Resources -A listing of residential and non-residential energy efficiency measures located at: http: //eega. cpuc. ca. gov/deer/ DEER provides measure and building specific: l Ex ante savings values: k. W, k. Wh, k. Btu; l Measure costs; and l Effective measure life (EUL) 1
Non-Weather Sensitive Residential Measures Include: Ø CFL Lighting Ø Refrigerators Ø Clothes Washers & Dryers Ø Dishwashers Ø Water Heating Ø Swimming Pool Pumps 2
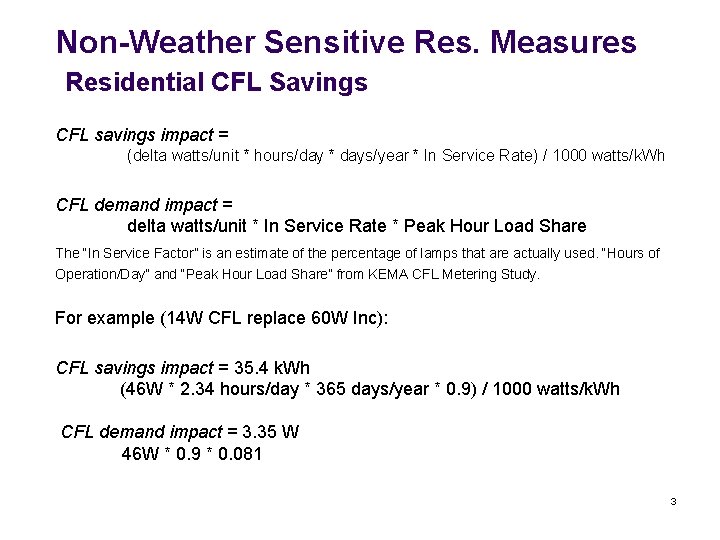
Non-Weather Sensitive Res. Measures Residential CFL Savings CFL savings impact = (delta watts/unit * hours/day * days/year * In Service Rate) / 1000 watts/k. Wh CFL demand impact = delta watts/unit * In Service Rate * Peak Hour Load Share The “In Service Factor” is an estimate of the percentage of lamps that are actually used. “Hours of Operation/Day” and “Peak Hour Load Share” from KEMA CFL Metering Study. For example (14 W CFL replace 60 W Inc): CFL savings impact = 35. 4 k. Wh (46 W * 2. 34 hours/day * 365 days/year * 0. 9) / 1000 watts/k. Wh CFL demand impact = 3. 35 W 46 W * 0. 9 * 0. 081 3
Non-Weather Sensitive Res. Measures Residential Water Heating Measures High efficiency water heater (electric EF=0. 93, gas EF=0. 63) Heat pump water heater (EF=2. 9) Point of use water heater Low flow showerhead (from 2. 5 to 2. 0 gallons per minute) Pipe wrap Faucet aerators Savings expressed as % of base use Base use varied by utility service area (same method as 2001) 4
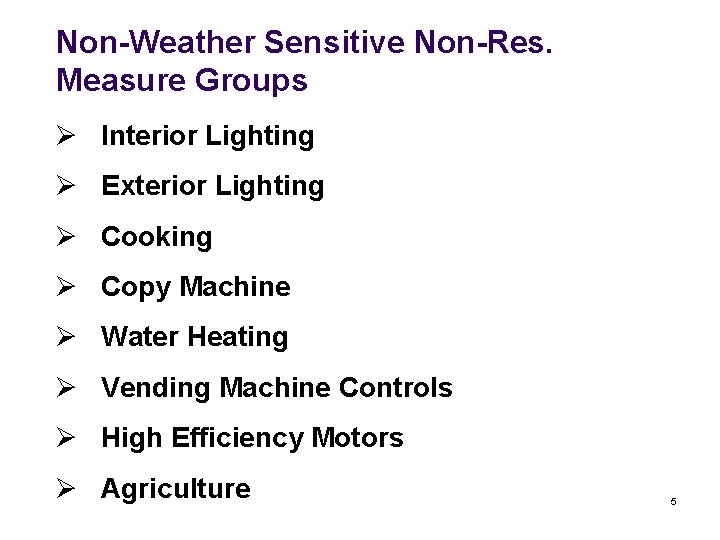
Non-Weather Sensitive Non-Res. Measure Groups Ø Interior Lighting Ø Exterior Lighting Ø Cooking Ø Copy Machine Ø Water Heating Ø Vending Machine Controls Ø High Efficiency Motors Ø Agriculture 5
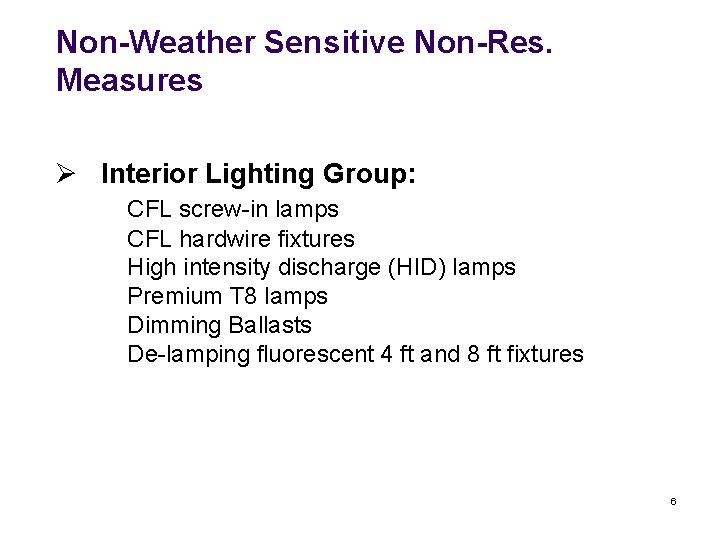
Non-Weather Sensitive Non-Res. Measures Ø Interior Lighting Group: CFL screw-in lamps CFL hardwire fixtures High intensity discharge (HID) lamps Premium T 8 lamps Dimming Ballasts De-lamping fluorescent 4 ft and 8 ft fixtures 6
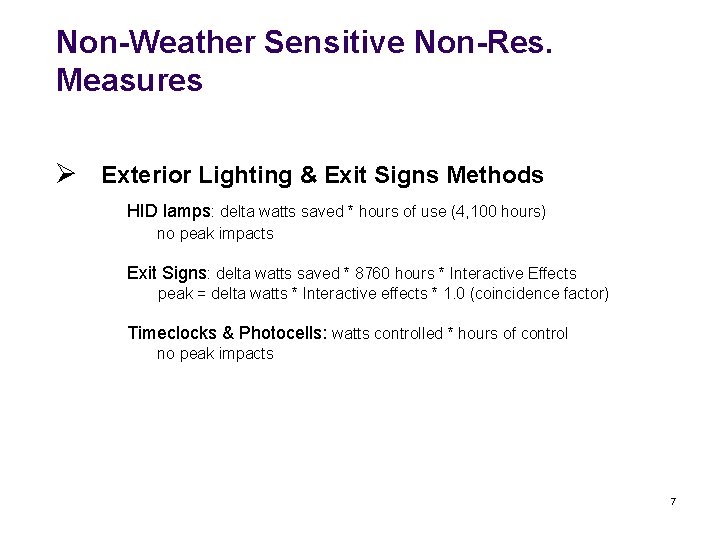
Non-Weather Sensitive Non-Res. Measures Ø Exterior Lighting & Exit Signs Methods HID lamps: delta watts saved * hours of use (4, 100 hours) no peak impacts Exit Signs: delta watts saved * 8760 hours * Interactive Effects peak = delta watts * Interactive effects * 1. 0 (coincidence factor) Timeclocks & Photocells: watts controlled * hours of control no peak impacts 7
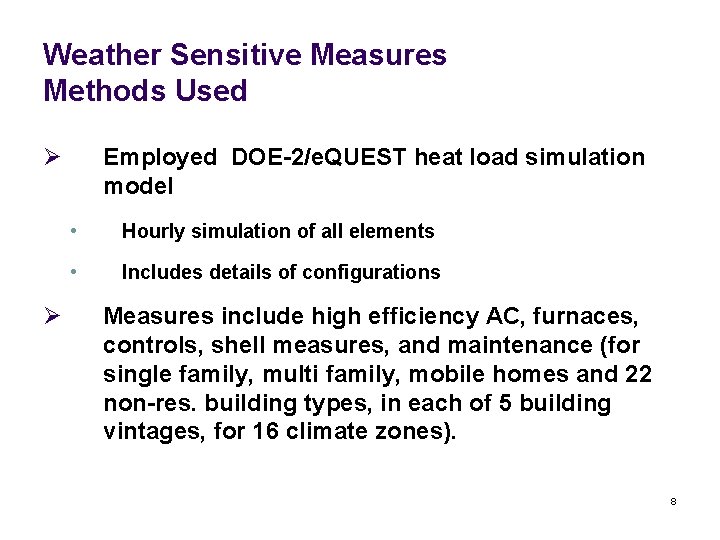
Weather Sensitive Measures Methods Used Ø Ø Employed DOE-2/e. QUEST heat load simulation model • Hourly simulation of all elements • Includes details of configurations Measures include high efficiency AC, furnaces, controls, shell measures, and maintenance (for single family, multi family, mobile homes and 22 non-res. building types, in each of 5 building vintages, for 16 climate zones). 8
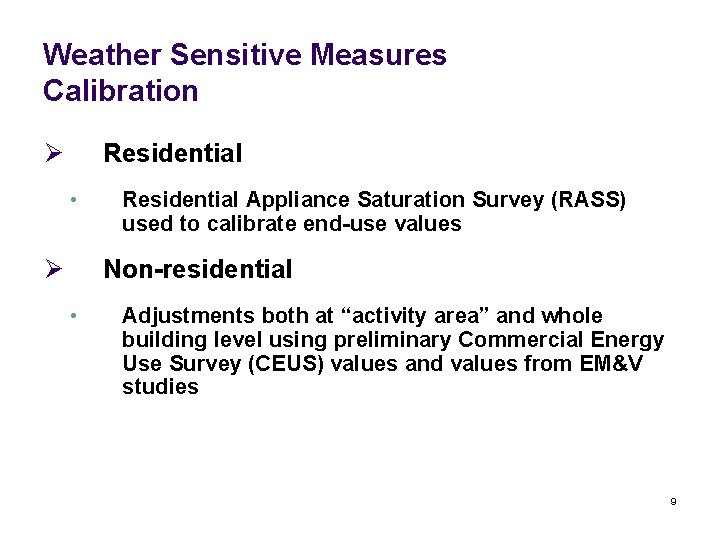
Weather Sensitive Measures Calibration Ø Residential • Ø Residential Appliance Saturation Survey (RASS) used to calibrate end-use values Non-residential • Adjustments both at “activity area” and whole building level using preliminary Commercial Energy Use Survey (CEUS) values and values from EM&V studies 9
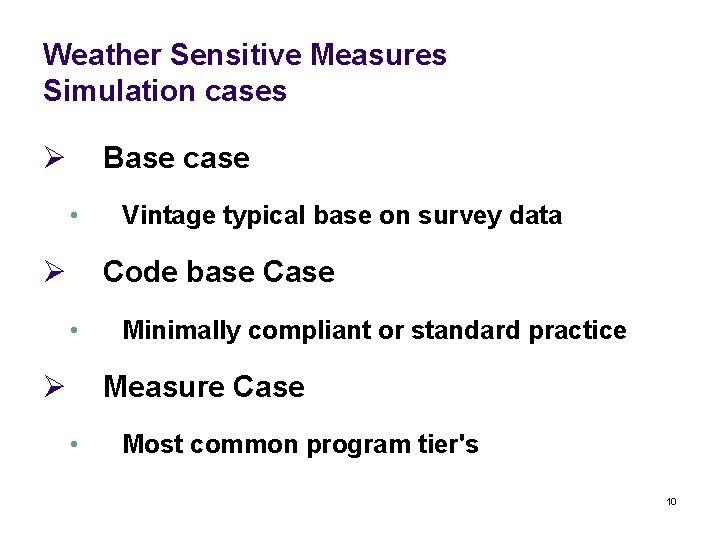
Weather Sensitive Measures Simulation cases Ø Base case • Ø Vintage typical base on survey data Code base Case • Ø Minimally compliant or standard practice Measure Case • Most common program tier's 10
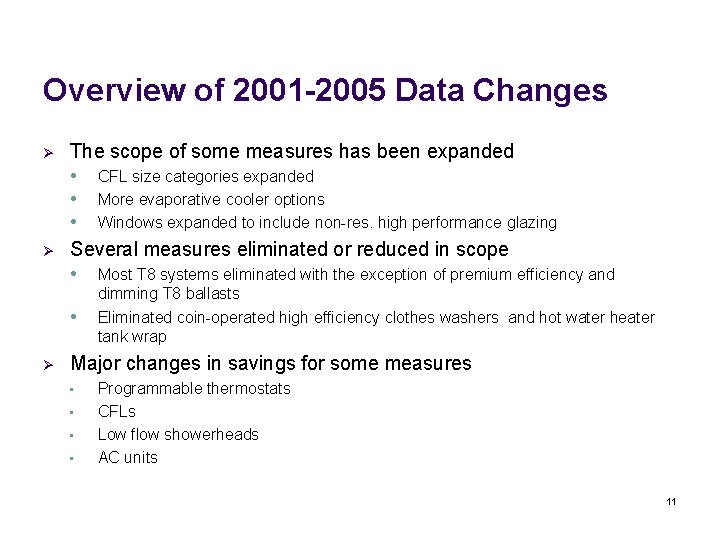
Overview of 2001 -2005 Data Changes Ø The scope of some measures has been expanded • • • Ø Several measures eliminated or reduced in scope • • Ø CFL size categories expanded More evaporative cooler options Windows expanded to include non-res. high performance glazing Most T 8 systems eliminated with the exception of premium efficiency and dimming T 8 ballasts Eliminated coin-operated high efficiency clothes washers and hot water heater tank wrap Major changes in savings for some measures • • Programmable thermostats CFLs Low flow showerheads AC units 11
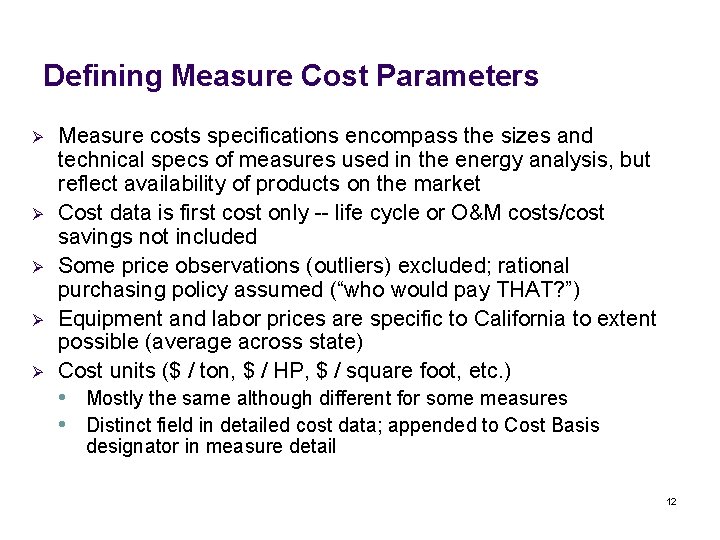
Defining Measure Cost Parameters Ø Ø Ø Measure costs specifications encompass the sizes and technical specs of measures used in the energy analysis, but reflect availability of products on the market Cost data is first cost only -- life cycle or O&M costs/cost savings not included Some price observations (outliers) excluded; rational purchasing policy assumed (“who would pay THAT? ”) Equipment and labor prices are specific to California to extent possible (average across state) Cost units ($ / ton, $ / HP, $ / square foot, etc. ) • Mostly the same although different for some measures • Distinct field in detailed cost data; appended to Cost Basis designator in measure detail 12
Cost Data Defining Cost Parameters Ø How to find the most applicable cost information? • Measure detail pages for each run ID - the per unit equipment measure cost of $13. 65 for all 90% residential furnaces • This provides an average cost based on a 100, 000 Btu furnace • The ‘Cost Data’ file under ‘Supporting Documents’ provides prices on a range of furnace sizes • This provides a range of costs for 90% AFUE furnaces from 60, 000 Btu to 140, 000 Btu. Per unit costs ($/KBtu) ranges from $21. 53 to $12. 13, respectively • The cost workbook section – Can use either statistical summary or individual price observations • For example, the per unit equipment measure cost for 90% AFUE 100, 000 furnaces ranges from to $12. 31 to $16. 52 based on 9 observations 13
Website Considerations Ø Two Levels of Savings l l Ø Customer savings - for system savings and early replacement savings. “Above Code” Savings - for all measures affected by an energy code or standard (reportable savings for replace on burnout. ) Common Units l l l The energy and cost common units are distinct Over 90% of cases, they are the same When different, distinctly identified 14
Website Considerations Ø Application – indicates if the cost is for: • Retrofit (RET) - replacing a working system with a new technology or adding a technology. • Replace-on-burnout (ROB) - replacing a technology at the end of its useful life • New construction or major renovation (NEW) - installing a technology in a new construction or major renovation Ø Cost Basis – indicates if the cost is: • Incremental (INCR) - the differential cost between a base technology and an energy efficient technology • Installed (FULL) - the full or installed cost of the measure including equipment, labor, overhead & profit (OH&P) 15
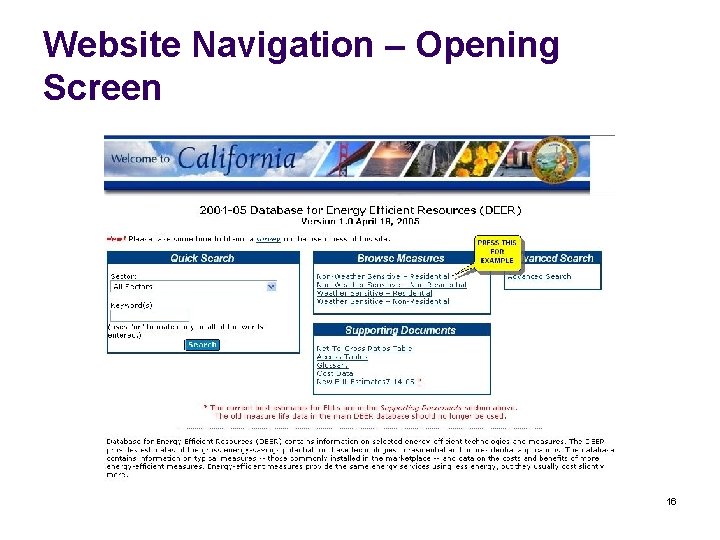
Website Navigation – Opening Screen 16
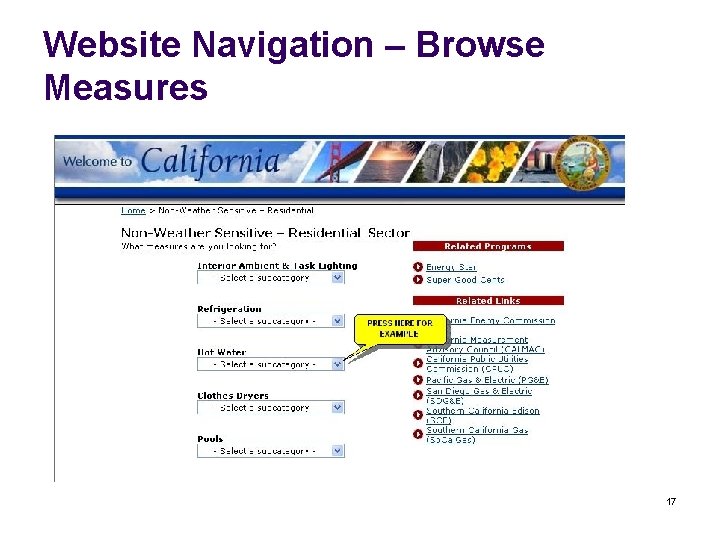
Website Navigation – Browse Measures 17
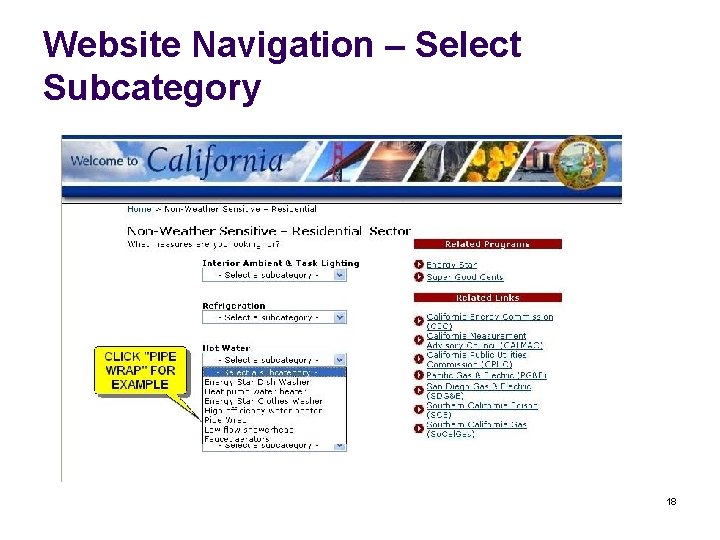
Website Navigation – Select Subcategory 18
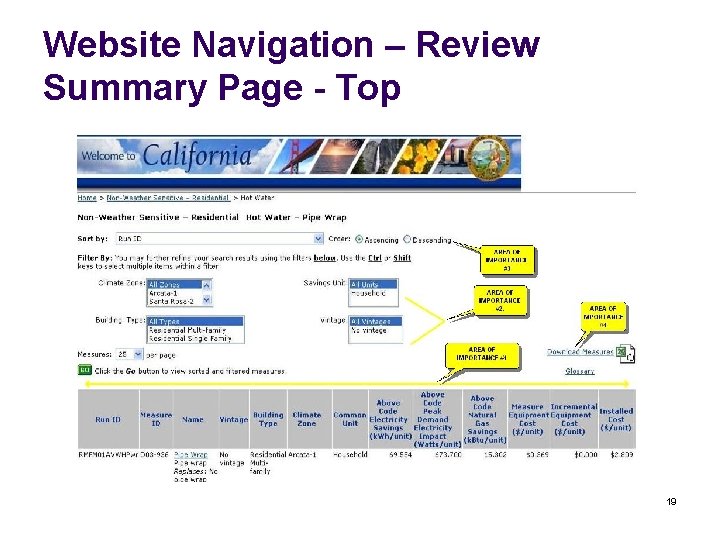
Website Navigation – Review Summary Page - Top 19
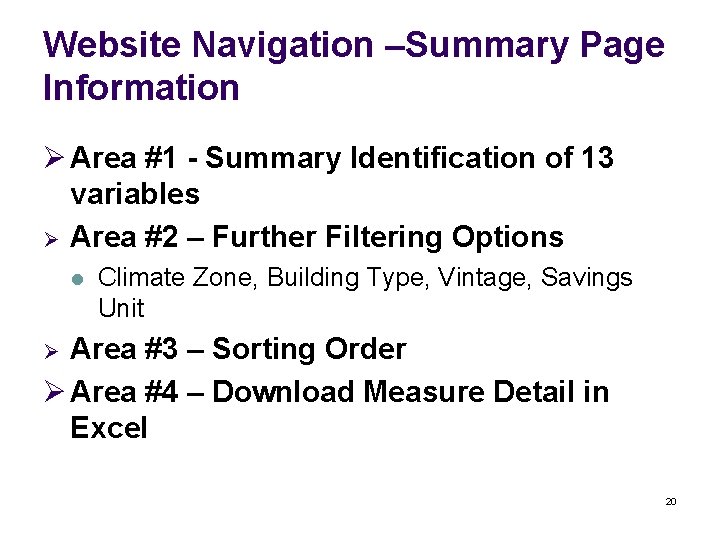
Website Navigation –Summary Page Information Ø Area #1 - Summary Identification of 13 variables Ø Area #2 – Further Filtering Options l Climate Zone, Building Type, Vintage, Savings Unit Area #3 – Sorting Order Ø Area #4 – Download Measure Detail in Excel Ø 20
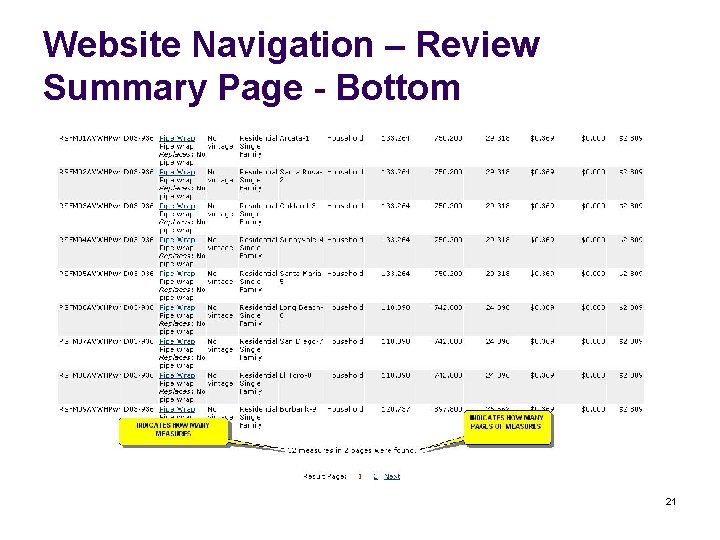
Website Navigation – Review Summary Page - Bottom 21
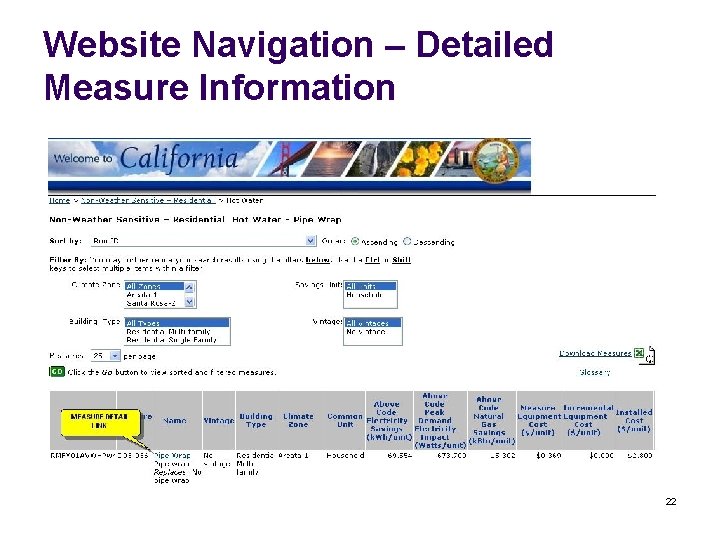
Website Navigation – Detailed Measure Information 22
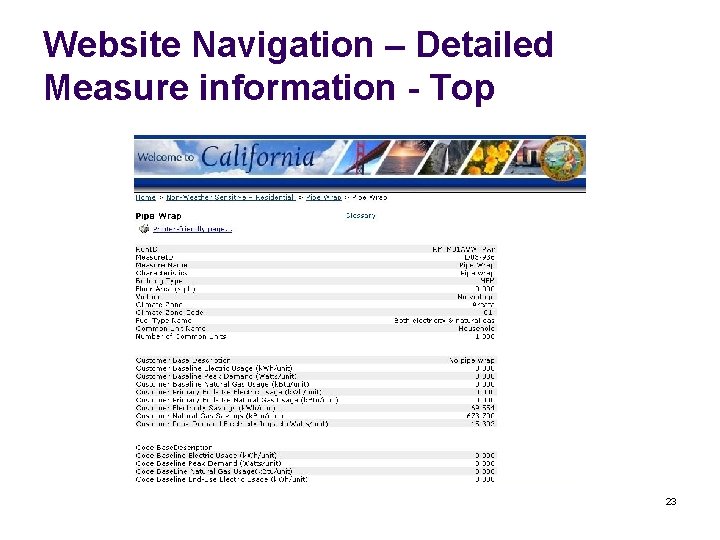
Website Navigation – Detailed Measure information - Top 23
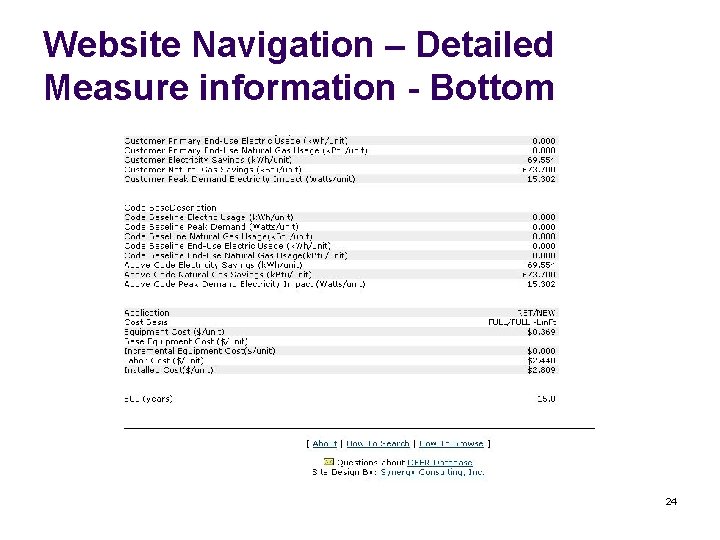
Website Navigation – Detailed Measure information - Bottom 24
Supporting Documents Section Ø Website Users Guide Ø Net-to-Gross Ratios Table (if in doubt use. 8) Ø Access Tables Ø Glossary Ø Cost Data User’s Guide Ø New EUL Estimates (7 -14 -05 SERA Report) Ø Consolidated Measure Data 25
- Slides: 25