
What is DEB theory Bas Kooijman Dept theoretical
What is DEB theory? Bas Kooijman Dept theoretical biology Vrije Universiteit Amsterdam Bas@bio. vu. nl http: //www. bio. vu. nl/thb Melbourne 2012/08/06
What is DEB theory? Contents Bas Kooijman Dept theoretical biology Vrije Universiteit Amsterdam Bas@bio. vu. nl http: //www. bio. vu. nl/thb • What is DEB theory? • Stylised facts • Supply/demand systems • How was it invented? • Selection of concepts • DEBs vs SEBs Melbourne 2012/08/06
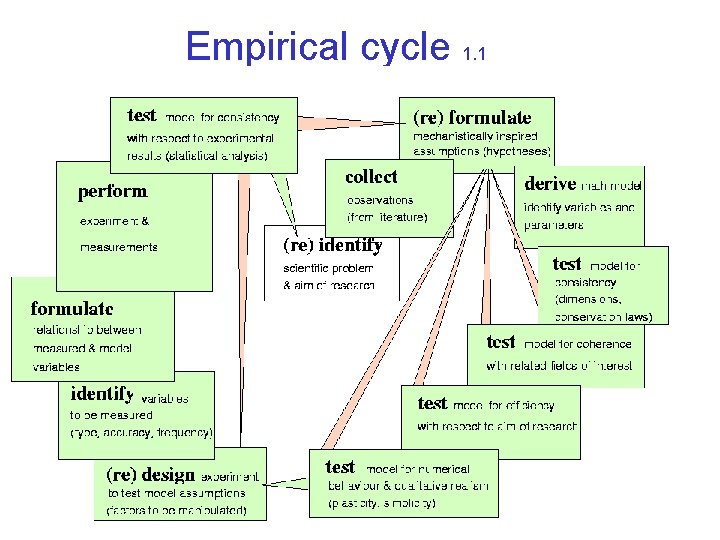
Empirical cycle 1. 1
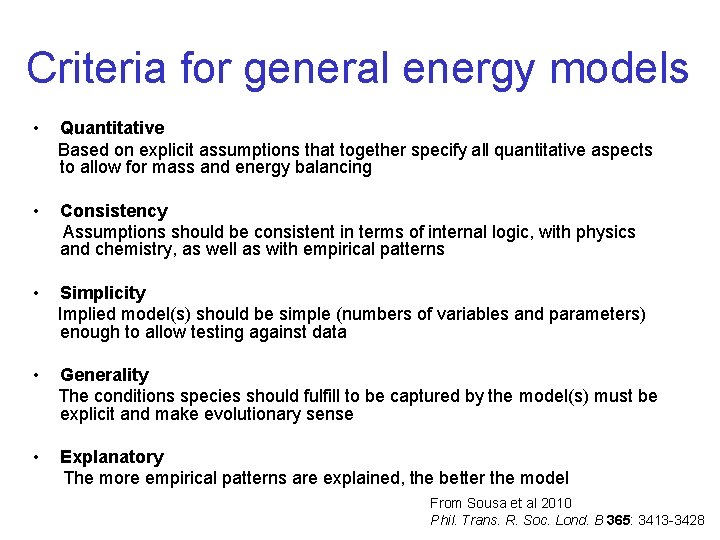
Criteria for general energy models • Quantitative Based on explicit assumptions that together specify all quantitative aspects to allow for mass and energy balancing • Consistency Assumptions should be consistent in terms of internal logic, with physics and chemistry, as well as with empirical patterns • Simplicity Implied model(s) should be simple (numbers of variables and parameters) enough to allow testing against data • Generality The conditions species should fulfill to be captured by the model(s) must be explicit and make evolutionary sense • Explanatory The more empirical patterns are explained, the better the model From Sousa et al 2010 Phil. Trans. R. Soc. Lond. B 365: 3413 -3428
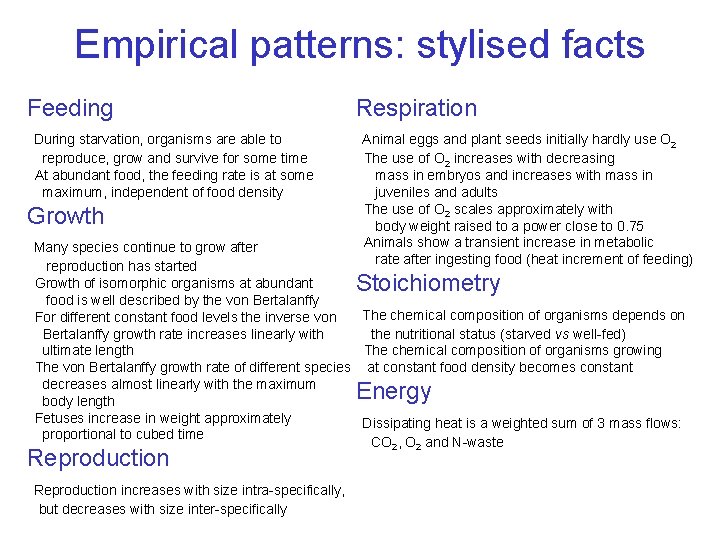
Empirical patterns: stylised facts Feeding During starvation, organisms are able to reproduce, grow and survive for some time At abundant food, the feeding rate is at some maximum, independent of food density Growth Respiration Animal eggs and plant seeds initially hardly use O 2 The use of O 2 increases with decreasing mass in embryos and increases with mass in juveniles and adults The use of O 2 scales approximately with body weight raised to a power close to 0. 75 Animals show a transient increase in metabolic rate after ingesting food (heat increment of feeding) Many species continue to grow after reproduction has started Growth of isomorphic organisms at abundant food is well described by the von Bertalanffy The chemical composition of organisms depends on For different constant food levels the inverse von Bertalanffy growth rate increases linearly with the nutritional status (starved vs well-fed) ultimate length The chemical composition of organisms growing The von Bertalanffy growth rate of different species at constant food density becomes constant decreases almost linearly with the maximum body length Fetuses increase in weight approximately Dissipating heat is a weighted sum of 3 mass flows: proportional to cubed time CO 2, O 2 and N-waste Stoichiometry Energy Reproduction increases with size intra-specifically, but decreases with size inter-specifically
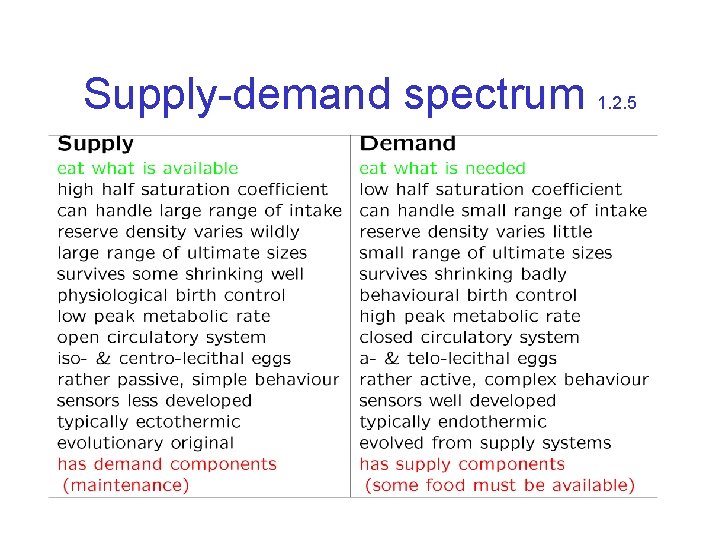
Supply-demand spectrum 1. 2. 5
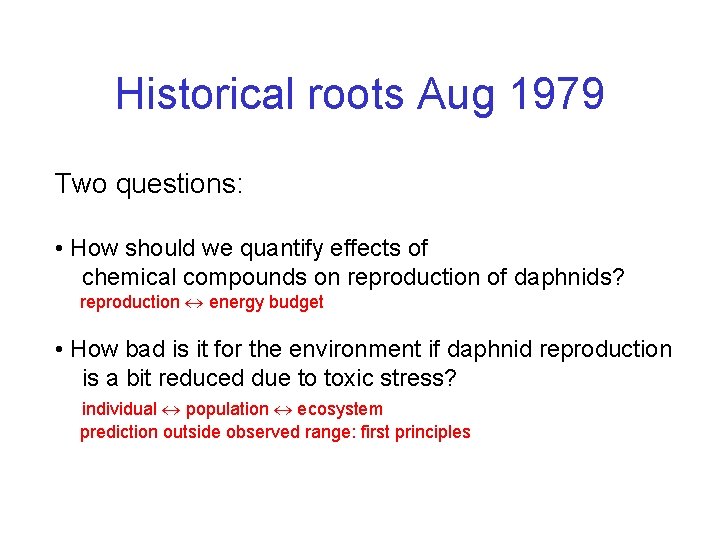
Historical roots Aug 1979 Two questions: • How should we quantify effects of chemical compounds on reproduction of daphnids? reproduction energy budget • How bad is it for the environment if daphnid reproduction is a bit reduced due to toxic stress? individual population ecosystem prediction outside observed range: first principles
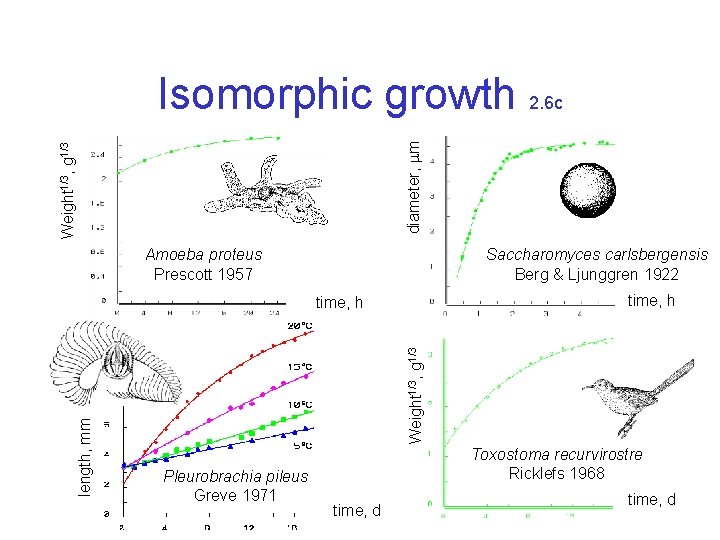
Weight 1/3, g 1/3 diameter, m Isomorphic growth 2. 6 c Amoeba proteus Prescott 1957 Saccharomyces carlsbergensis Berg & Ljunggren 1922 time, h Weight 1/3, g 1/3 length, mm time, h Pleurobrachia pileus Greve 1971 Toxostoma recurvirostre Ricklefs 1968 time, d
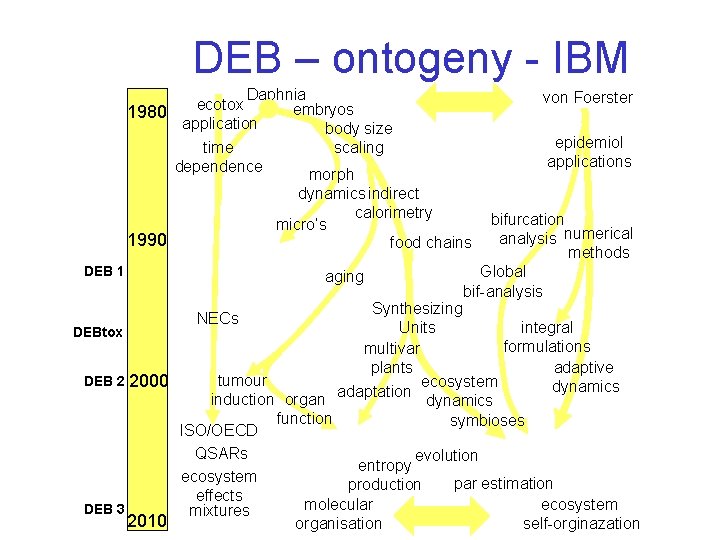
DEB – ontogeny - IBM Daphnia ecotox embryos 1980 application body size time scaling dependence morph dynamics indirect calorimetry micro’s 1990 food chains DEB 1 aging von Foerster epidemiol applications bifurcation analysis numerical methods Global bif-analysis Synthesizing integral Units DEBtox formulations multivar adaptive plants DEB 2 2000 tumour ecosystem dynamics adaptation induction organ dynamics function symbioses ISO/OECD QSARs evolution entropy ecosystem par estimation production effects ecosystem molecular DEB 3 mixtures 2010 self-orginazation organisation NECs
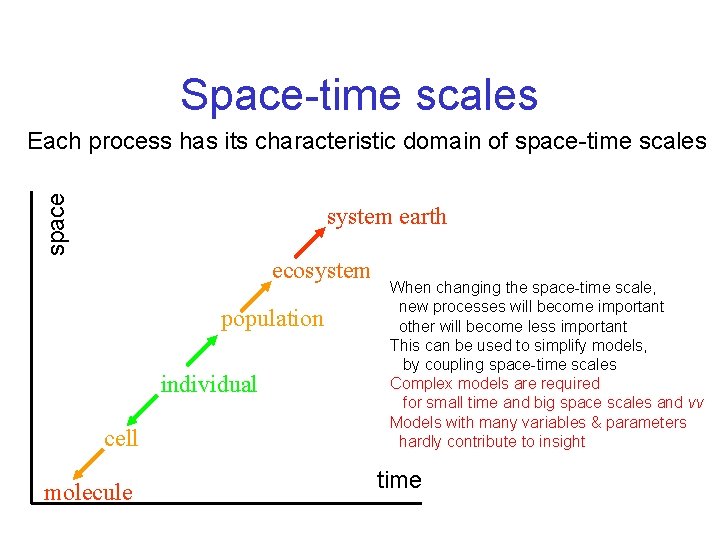
Space-time scales space Each process has its characteristic domain of space-time scales system earth ecosystem population individual cell molecule When changing the space-time scale, new processes will become important other will become less important This can be used to simplify models, by coupling space-time scales Complex models are required for small time and big space scales and vv Models with many variables & parameters hardly contribute to insight time
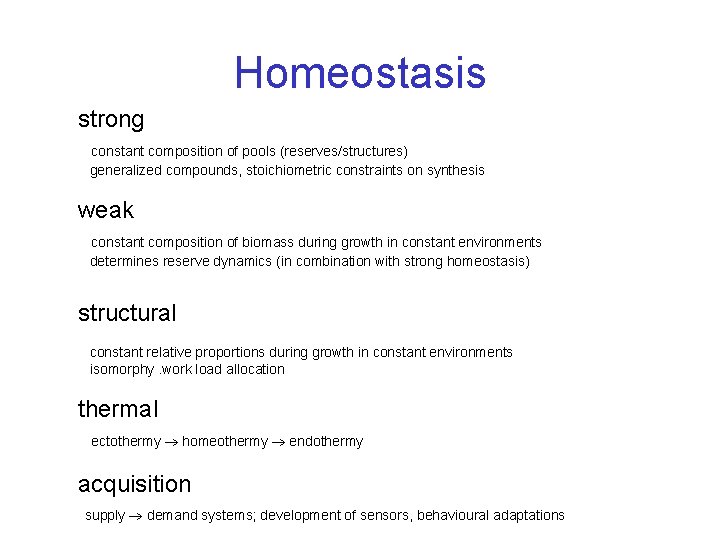
Homeostasis strong constant composition of pools (reserves/structures) generalized compounds, stoichiometric constraints on synthesis weak constant composition of biomass during growth in constant environments determines reserve dynamics (in combination with strong homeostasis) structural constant relative proportions during growth in constant environments isomorphy. work load allocation thermal ectothermy homeothermy endothermy acquisition supply demand systems; development of sensors, behavioural adaptations
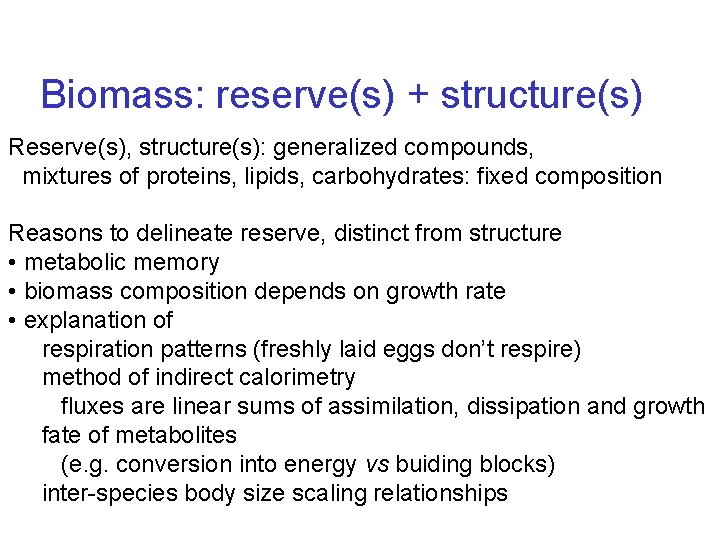
Biomass: reserve(s) + structure(s) Reserve(s), structure(s): generalized compounds, mixtures of proteins, lipids, carbohydrates: fixed composition Reasons to delineate reserve, distinct from structure • metabolic memory • biomass composition depends on growth rate • explanation of respiration patterns (freshly laid eggs don’t respire) method of indirect calorimetry fluxes are linear sums of assimilation, dissipation and growth fate of metabolites (e. g. conversion into energy vs buiding blocks) inter-species body size scaling relationships
Reserve vs structure 2. 3 Differences between reserve & structure • Life span of compounds in reserve: limited due to turnover of reserve all reserve compounds have the same mean life span structure: controlled by somatic maintenance structure compounds can differ in mean life span • no maintenance costs for reserve freshly laid eggs consist of reserve and do not respire Reserve does not mean: • “set apart for later use’: compounds in reserve can have active functions • lipids: the rest would be structure and lipids cannot convert to protein • `material that does not require maintenance’: can also apply to compounds in structure • `material that is synthesize from assimilates’: indirectly applies to all compounds
Reserve residence time 2. 3. 1 b
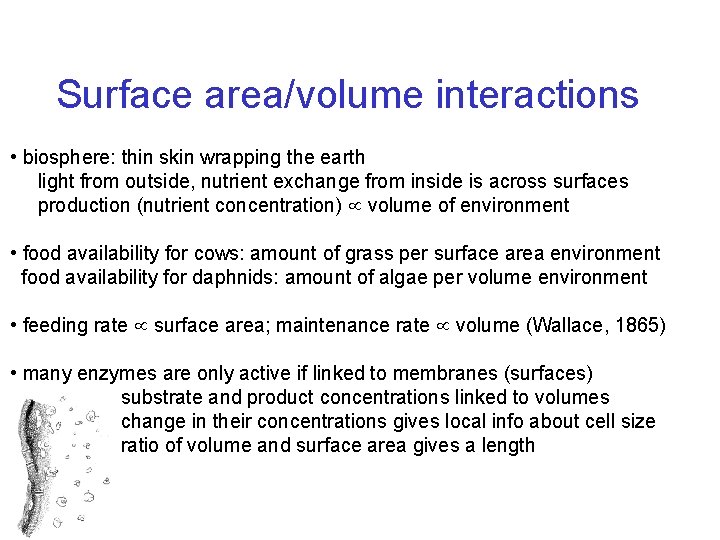
Surface area/volume interactions • biosphere: thin skin wrapping the earth light from outside, nutrient exchange from inside is across surfaces production (nutrient concentration) volume of environment • food availability for cows: amount of grass per surface area environment food availability for daphnids: amount of algae per volume environment • feeding rate surface area; maintenance rate volume (Wallace, 1865) • many enzymes are only active if linked to membranes (surfaces) substrate and product concentrations linked to volumes change in their concentrations gives local info about cell size ratio of volume and surface area gives a length
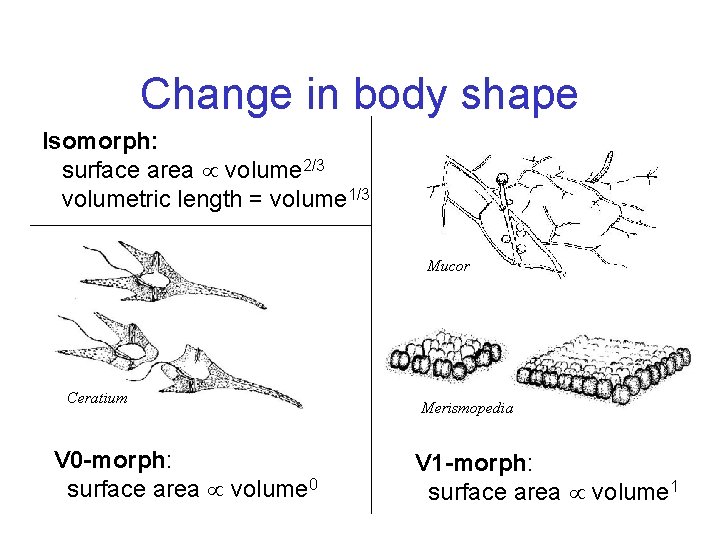
Change in body shape Isomorph: surface area volume 2/3 volumetric length = volume 1/3 Mucor Ceratium V 0 -morph: surface area volume 0 Merismopedia V 1 -morph: surface area volume 1
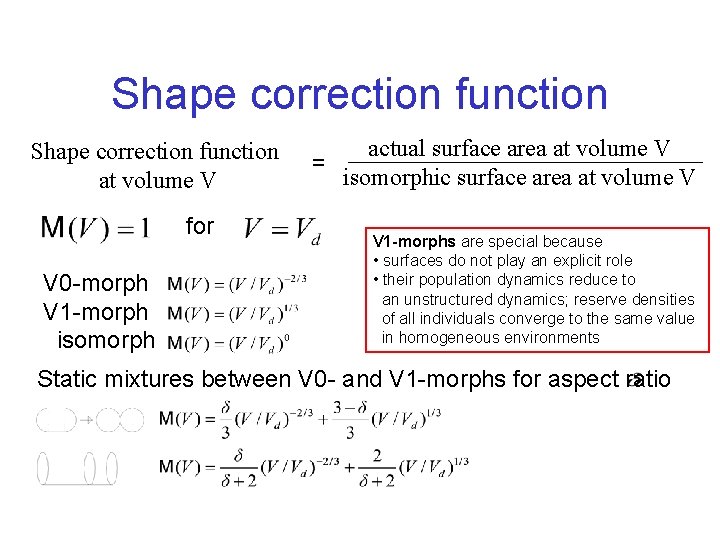
Shape correction function at volume V for V 0 -morph V 1 -morph isomorph = actual surface area at volume V isomorphic surface area at volume V V 1 -morphs are special because • surfaces do not play an explicit role • their population dynamics reduce to an unstructured dynamics; reserve densities of all individuals converge to the same value in homogeneous environments Static mixtures between V 0 - and V 1 -morphs for aspect ratio
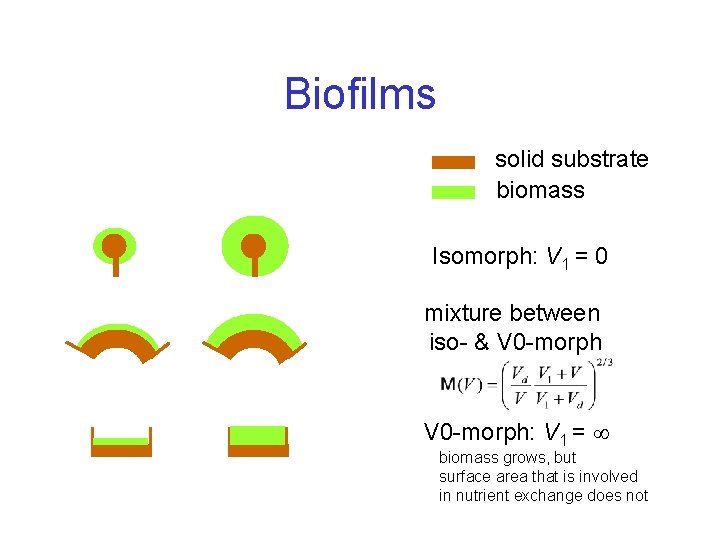
Biofilms solid substrate biomass Isomorph: V 1 = 0 mixture between iso- & V 0 -morph: V 1 = biomass grows, but surface area that is involved in nutrient exchange does not
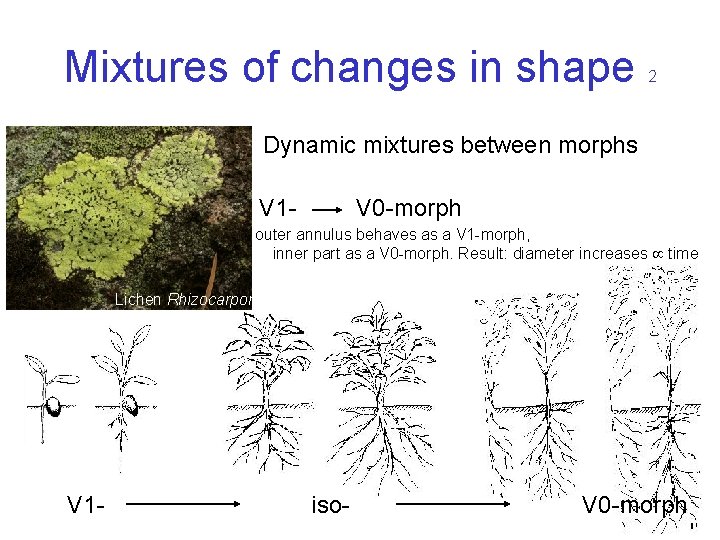
Mixtures of changes in shape 2 Dynamic mixtures between morphs V 1 - V 0 -morph outer annulus behaves as a V 1 -morph, inner part as a V 0 -morph. Result: diameter increases time Lichen Rhizocarpon V 1 - iso- V 0 -morph
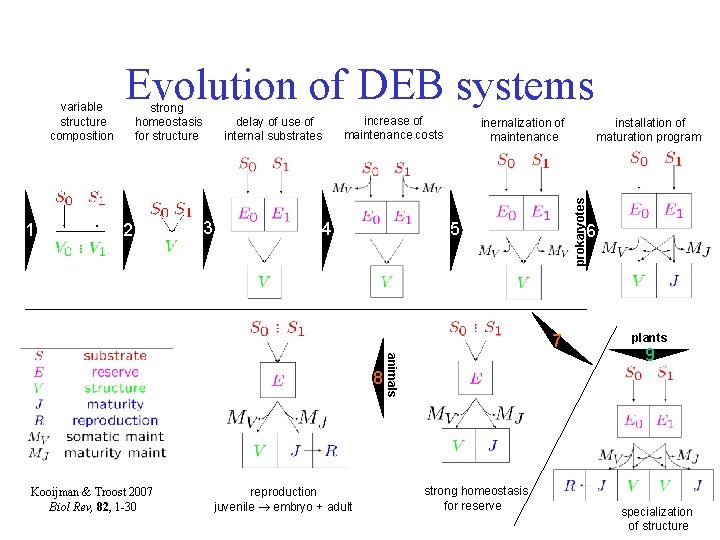
1 Evolution of DEB systems strong homeostasis for structure 2 delay of use of internal substrates 3 increase of maintenance costs 4 inernalization of maintenance 5 7 Kooijman & Troost 2007 Biol Rev, 82, 1 -30 reproduction juvenile embryo + adult animals 8 strong homeostasis for reserve installation of maturation program prokaryotes variable structure composition 6 plants 9 specialization of structure
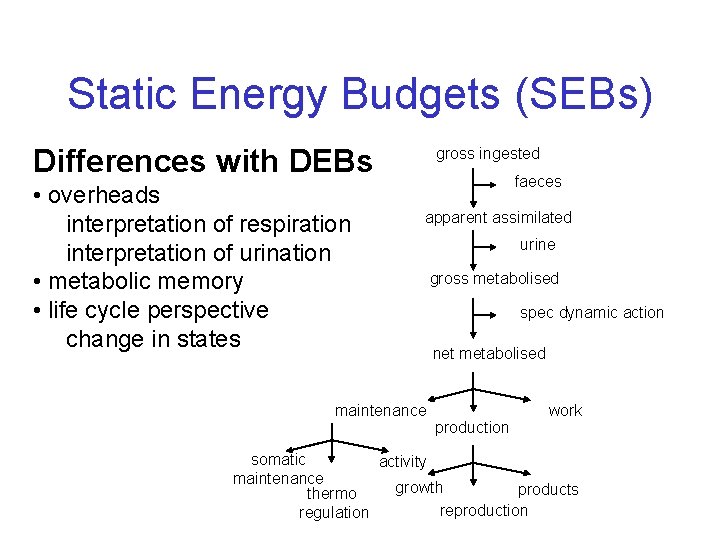
Static Energy Budgets (SEBs) Differences with DEBs • overheads interpretation of respiration interpretation of urination • metabolic memory • life cycle perspective change in states gross ingested faeces apparent assimilated maintenance urine gross metabolised spec dynamic action net metabolised production work somatic activity maintenance growth products thermo reproduction regulation
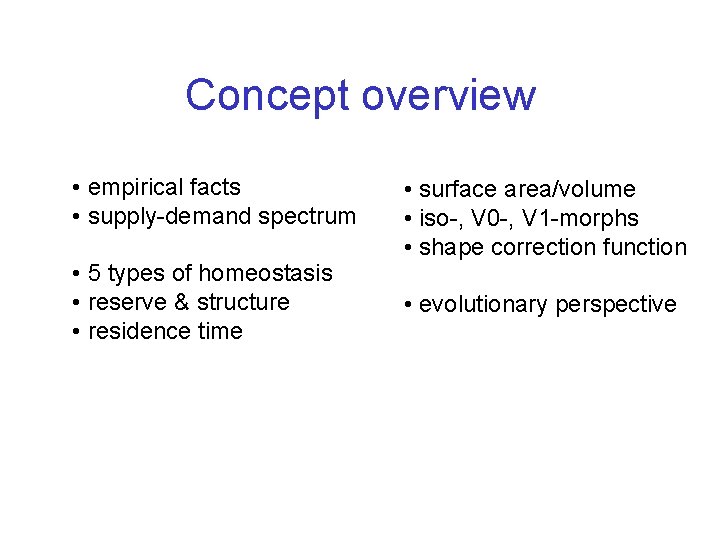
Concept overview • empirical facts • supply-demand spectrum • 5 types of homeostasis • reserve & structure • residence time • surface area/volume • iso-, V 0 -, V 1 -morphs • shape correction function • evolutionary perspective
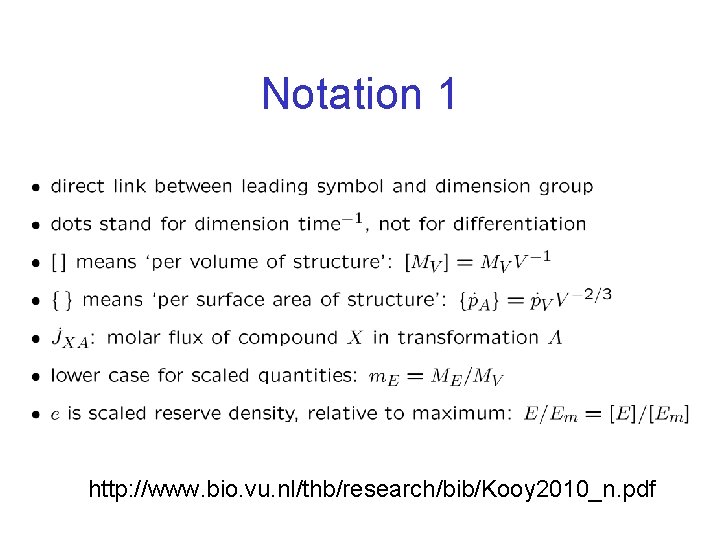
Notation 1 http: //www. bio. vu. nl/thb/research/bib/Kooy 2010_n. pdf
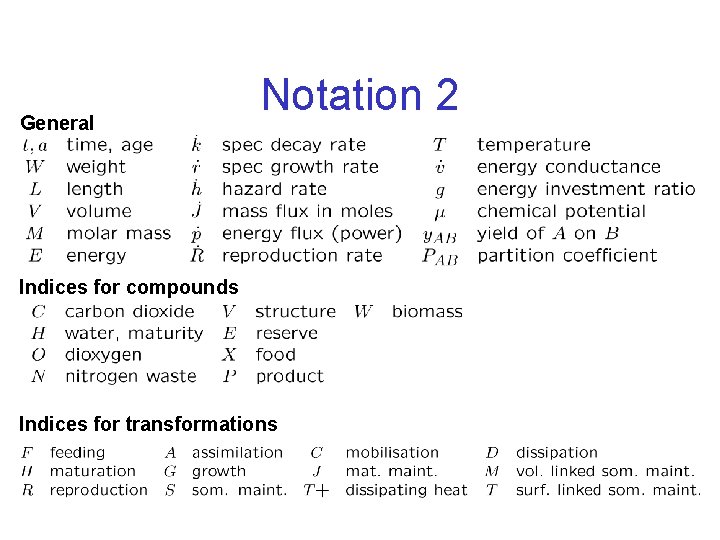
General Notation 2 Indices for compounds Indices for transformations
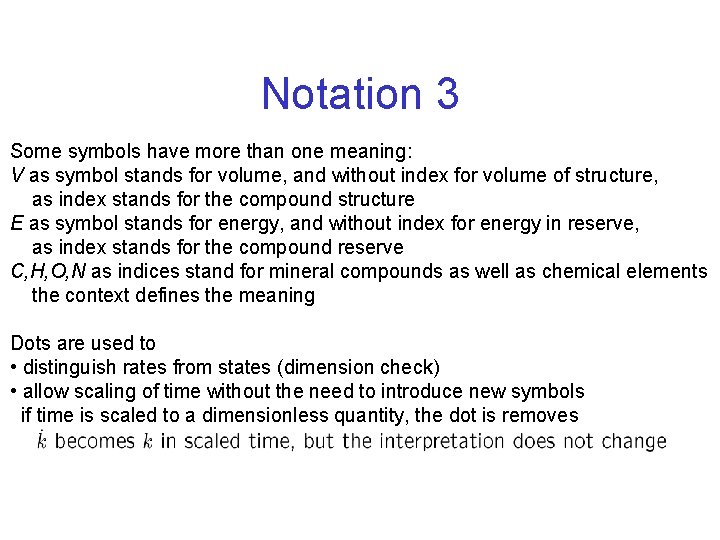
Notation 3 Some symbols have more than one meaning: V as symbol stands for volume, and without index for volume of structure, as index stands for the compound structure E as symbol stands for energy, and without index for energy in reserve, as index stands for the compound reserve C, H, O, N as indices stand for mineral compounds as well as chemical elements the context defines the meaning Dots are used to • distinguish rates from states (dimension check) • allow scaling of time without the need to introduce new symbols if time is scaled to a dimensionless quantity, the dot is removes
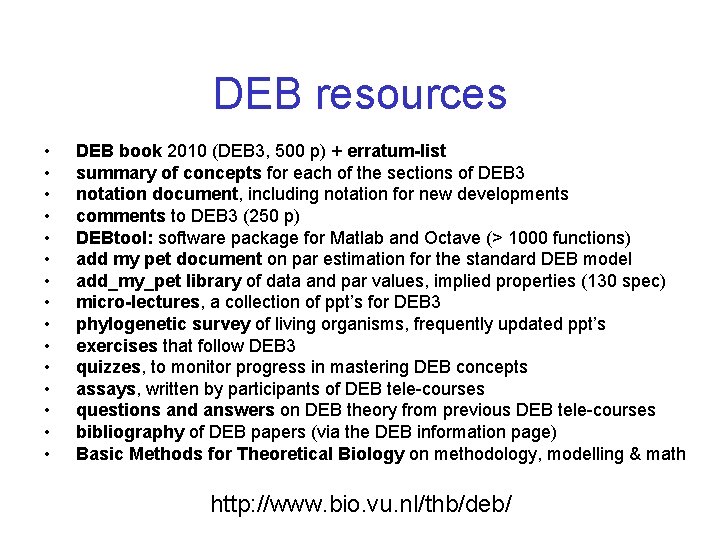
DEB resources • • • • DEB book 2010 (DEB 3, 500 p) + erratum-list summary of concepts for each of the sections of DEB 3 notation document, including notation for new developments comments to DEB 3 (250 p) DEBtool: software package for Matlab and Octave (> 1000 functions) add my pet document on par estimation for the standard DEB model add_my_pet library of data and par values, implied properties (130 spec) micro-lectures, a collection of ppt’s for DEB 3 phylogenetic survey of living organisms, frequently updated ppt’s exercises that follow DEB 3 quizzes, to monitor progress in mastering DEB concepts assays, written by participants of DEB tele-courses questions and answers on DEB theory from previous DEB tele-courses bibliography of DEB papers (via the DEB information page) Basic Methods for Theoretical Biology on methodology, modelling & math http: //www. bio. vu. nl/thb/deb/
- Slides: 26