What is a map It is a representation


")


 70 65 60 55")
 70 65 60 55")


- Slides: 30
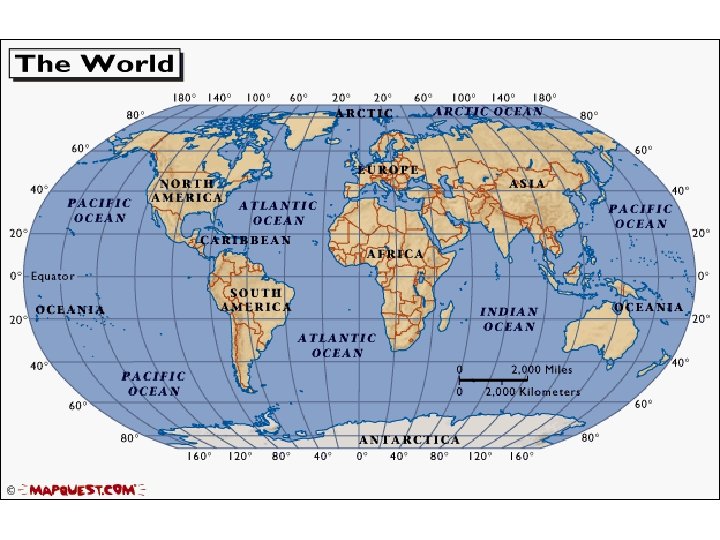
What is a map? • It is a representation of something (Earth, stars, solar system, a building, etc…
Uses of Maps • • To determine where you are going. To act as a model of Earth’s surface. Used to locate various places To show the distribution of various features or types of materials.
Latitude and Longitude • The earth is divided into lots of lines called latitude and longitude.
Lines • Longitude lines run north and south. (the LONG sides of the ladder) • Latitude lines run east and west. (the steps of the ladder) • The lines measure distances in degrees. Longitude Latitude
P M E R R I I D M I E A N Where is 0 degree? • The prime meridian is 0 degrees longitude. This imaginary line runs through England, France, Spain, western Africa, and Antarctica.
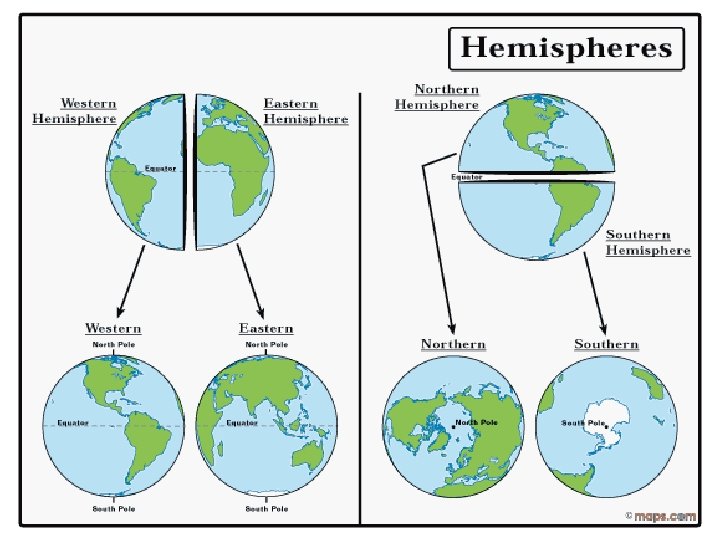
Hemispheres • By using the Equator and Prime Meridian, we can divide the world into four hemispheres: 1. The Northern Hemisphere 2. The Southern Hemisphere 3. The Eastern Hemisphere 4. The Western Hemisphere
Reading coordinates
Reading coordinates
1. Locate equator and prime meridian
2. Locate destination’s latitude and longitude degrees
2. Locate destination’s latitude and longitude degrees
2. Locate destination’s latitude and longitude degrees
3. Compare latitude to north or south of the equator and longitude east or west of the prime meridian
4. Coordinates: 75⁰ N 90⁰ W
Scale • Maps are made to scale; that is, they tell the distance between places on a map.
Scale
Using a scale 1. Identify the scale on the map 2. Measure the distance with you wish to know using a ruler – Make sure to use the correct side of the ruler 3. Convert your measured length to the actual length using your scale 2 inches
Topographic Maps Topographic maps represent Earth’s surface in three dimensions; they show elevation, distance directions, and slope angles.
Topographic Maps • Contour lines are lines on a topographic map that indicate an elevation. All lines have a value but not all are labelled with a value. • Contour interval is the distance in elevation between adjacent contour lines. It is the same value throughout the map.
Contour Lines • Lines on topographic maps. • Connect points of equal elevation. – Everything connected to that line has the same elevation. – Elevation: the distance something is above sea level. Sea level= 0 m or 0 ft.
Determining the value of the contour interval Two ways to determine the value 1. Count how many lines are in between and what makes sense. Often it is a value of 5, 10, 25 or 50. 2. Math
Determining the value of the contour interval (1 ST method) 70 65 60 55 1. Count how many lines are in between and what makes sense. Often it is a value of 5, 10, 25, or 50. There are four lines between the index contours 50 and 75. Therefore the only option that would fit is an contour interval of 5.
Determining the value of the contour interval (2 nd method) 70 65 60 55 2. Math Contour interval = Difference between the contour index lines/ the number of lines it takes to get to the next contour index (75 – 50)/5 = 25/5 = contour interval
Practice 1. What is the contour interval? 2. What is the elevation at the red dot? 3. What is the elevation at the blue dot?
Practice 1. What is the contour interval? 20 feet 2. What is the elevation at the red dot? 620 feet 3. What is the elevation at the blue dot? 680 feet
Reading a topographic map- Slope • Closely spaced contour lines represent steep slopes. • Widely spaced contour lines represent gentle slopes.
Reading a topographic map- Hills • Hills are represented on a topographic map by a series of concentric contour lines in a rough circle
Reading a topographic map- Depression Contours • Depression contours show areas of lower elevation. • Drawn like contour lines with marks on the inside. • Hachure marks- tick marks on inside of closed circle.