What Have We Learned about Incarceration and Race

What Have We Learned about Incarceration and Race? Lessons from 30 years of Research Samuel L. Myers, Jr. University of Minnesota LERA/ASSA Panel, San Francisco, CA January 4, 2016

Overview • Stylized Facts About Black Incarceration Rates, 1970 s to Present • Catalogue of Explanations • The Dire Consequences • Implications for the Future

STYLIZED FACTS

Incarceration • USA: second highest incarceration rate in the world • Black incarceration rates 6 -7 times that of whites • Incarceration rose from 200, 000 in 1970 s to more than 1. 5 Million in 2010

Countries with the largest number of prisoners per 100, 000 of the national population, as of June 2014 data Number of prisoners per 100, 000 population 1000 868 900 800 707 700 611 543 535 529 510 495 492 471 450 430 425 424 422 411 396 389 383 600 500 400 300 200 100 U an SA An d N ev gu Vi is rg illa in (U Is la. nd K. ) s (U. S. ) Ba rb ad os C ub a Be liz e R w an da R us s Th ia ai la Vi nd rg G i n r en St Is. V ad la nd in a ce s ( nt U. K El an Sa. ) d th lv e ad G o re na r d G ua ines Si nt Be m ( M U rm aa. S ud. ) rte a n An (Ne (U. K th tig. ) er ua l an and d s) Ba rb ud Pa a na m a s St. K itt Se yc he lle s 0 Note: Worldwide; As of June 25, 2014 Further information regarding this statistic can be found on page 8. Source: ICPS; ID 262962
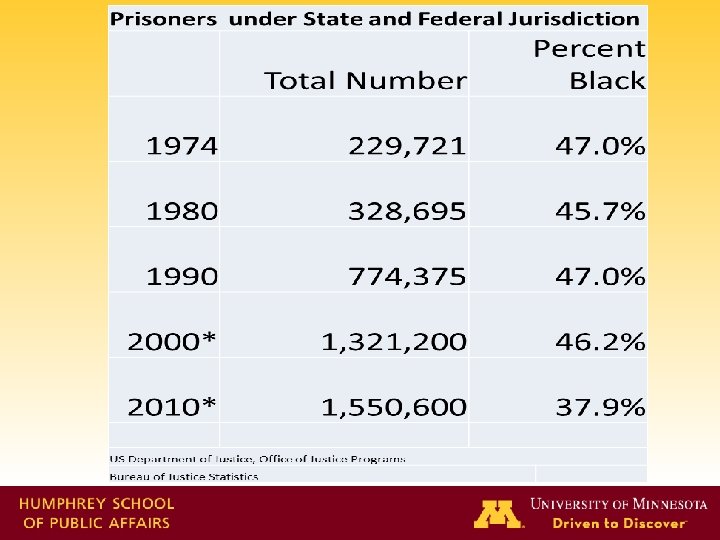

Sharp increases 1970 s – 1990 s; Rise in White incarcerations in 2000 s

CATALOGUE OF EXPLANATIONS

Social and Economic Explanations • Structural – Labor markets – Schools (suspensions as pipelines to prison) – Housing markets (segregated islands of isolation) • Behavioral – Drug use and drug sales – Theft and larceny – Thrill seeking – Anti-authoritarianism

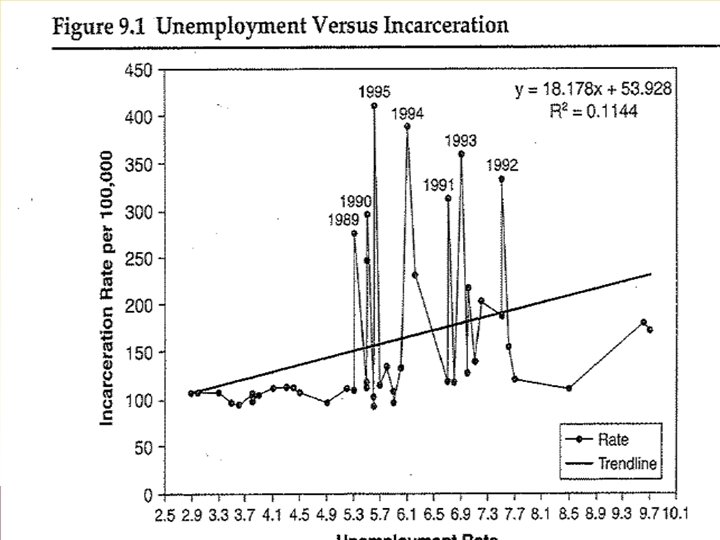
• Structural Explanations • Prisons as labor market equilibrating devices – Superfluous labor: Prisons drain off unwanted workers – Labor shortages Prisons release workers into labor markets • Behavioral • High unemployment produces high incentives to engage in criminal activities • High rates of criminal involvement produce high arrests rates and high incarceration rates
 Structural • Discrimination in: – – – Traffic Stops Arrests Bail")
Explanations (cont. ) Structural • Discrimination in: – – – Traffic Stops Arrests Bail setting Prosecution Sentencing Probation and Parole Behavioral • Offender decisions that result in higher rates of: – – – Traffic stops Arrests Bail Guilty Pleas Longer sentences Lower probabilities of probation or parole
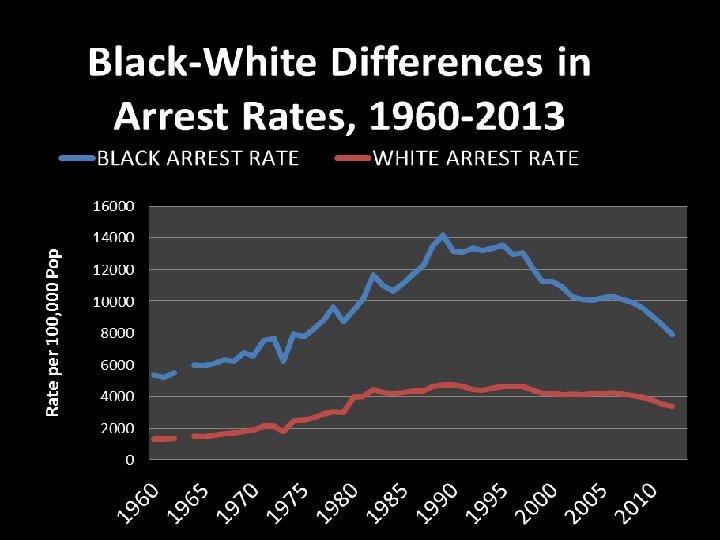

Disparity in Incarcerations Greater than the Disparity in Arrests
Efficiency of Racial Disparities in Incarceration")
The (in)Efficiency of Racial Disparities in Incarceration

The Problem • Wide racial disparities in incarceration – Are these disparities “efficient” in the sense that they help to reduce crime? – Are these disparities the result of discrimination?

Sources of Potential Inefficiency in Racial Disparities in Incarceration • Family Instability Effects – Higher black incarceration rates lead to lower supplies of marriageable black males – Lower supplies of marriageable black males results in lower black marriage rates – Lower black marriage rates result in higher rates of femaleheadship • Higher female-headship rates associated with lower incomes, higher drop-out rates, higher crime rates • Absence of fathers associated with higher rates of criminality – Widening gaps in family incomes (Darity, et al. “Racial Earnings Disparities and Family Structure, " Southern Economic Journal 65(1)(July 1998): 20– 41) • Accumulation of Criminal Human Capital

Sources of Potential Efficiencies of Racial Disparities in Incarceration • Deterrent Effects – Lower crime rates among blacks who estimate that they will serve longer prison terms if convicted – Lower entry into crime overall by observation of lengthy prison sentences for minor crimes • Incapacitation Effects – Lower overall crime rates due to incarceration of career criminals

CASE STUDY: FEDERAL PRISON PAROLE

The Context of the Debate • Sentencing reforms – Eliminate different punishments for same crimes – Reduce judicial discretion – Reduce racial disparities • Conservative support for sentencing reforms – Racial discrimination does not exist; need to reign in the discretion of “liberal” judges – More lengthy sentences for more “serious crimes” e. g. crack cocaine possession • Liberal support for sentencing reforms – Lower racial disparities – Increase “rationality” of punishment – Eliminate discretion of “racist” judges

TESTING FOR DISCRIMINATION IN PUNISHMENT


Efficiency Effects of Discrimination in Punishment • Replace black Release on Parole rate with")
(in)Efficiency Effects of Discrimination in Punishment • Replace black Release on Parole rate with discrimination free-value • More blacks released on parole • But, positive coefficient on release on parole in black recidivism equation • Result, higher black recidivism rate at higher black release rates • By how much? – Note coefficient is small and statistically insignificant – Works out to about 1 out of 222 releases

ARE RACIAL DISPARITIES IN INCARCERATION DUE TO RACIAL DISPARITIES IN DRUG ARRESTS?

Effects of Drug Arrests on Incarceration Rates Larger impacts of lagged white drug arrests on white incarceration rates than lagged black drug arrests on black incarceration rates

Effects of Drug Arrests on Incarceration Rates BLACKS WHITES 0. 9 0. 8 0. 7 0. 6 0. 5 0. 4 0. 3 0. 2 0. 1 0. 0 Percentage change in Incarceration rates due to changes in drug arrest rates

THE DIRE CONSEQUENCES

Consequences • States where felons cannot vote: – – – Alabama Arizona Delaware Florida Iowa Kentucky • States where felons cannot vote: – – – Mississippi Nevada Tennessee Virginia Wyoming

Consequences • Reduced supply of marriageable males • Increases in female headed families • Lower incomes in families with head with conviction
 •")
Jobs Convicted Felons Cannot Hold Texas Minnesota • Work with children (childcare, education) • Elderly adults (home care) • Locksmith • Barbers • Electricians • Pharmacists • MORTGAGEORIGINATOR; • INSURANCE AGENT • NURSING HOMES AND HOME CARE • AUDIOLOGISTS • PHYSICAL THERAPISTS • DENTISTS, • VETERINARIANS,

Implications for the Future • Jobs for returning ex -offenders • Re-integration into communities • Subsidies for hiring ex-offenders • Family support • Entrepreneurship opportunities – Small business ownership – Skilled trades (e. g. electricians, plumbers, painters) • Rethinking licensing restrictions

Thank you! myers 006@umn. edu www. hhh. umn. edu/centers/wilkins
- Slides: 35