What has happened to the Middle Class Stephen


 generated 58%")


")


- Slides: 144
What has happened to the Middle Class? Stephen B. Young Global Executive Director The Caux Round Table
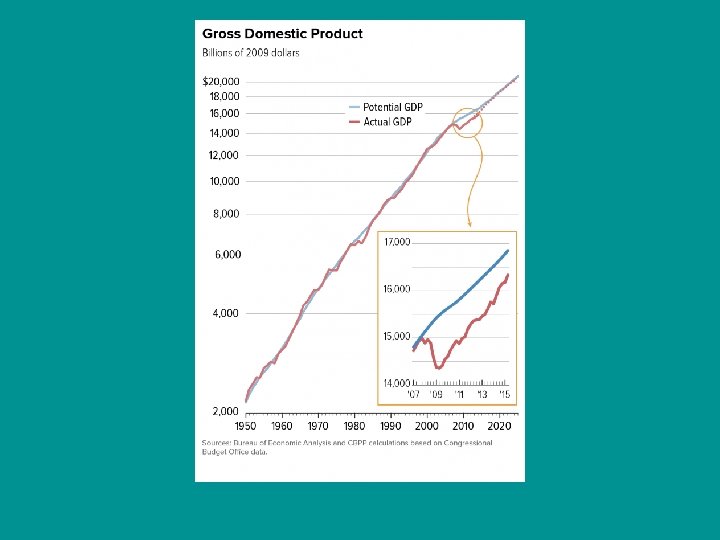
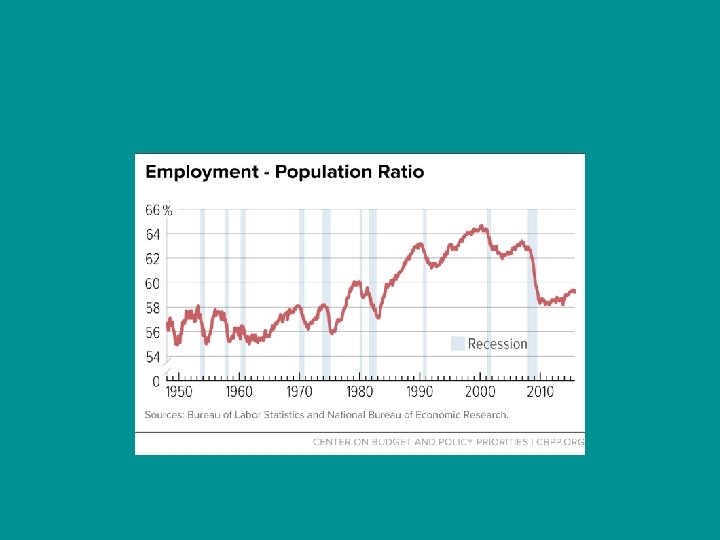
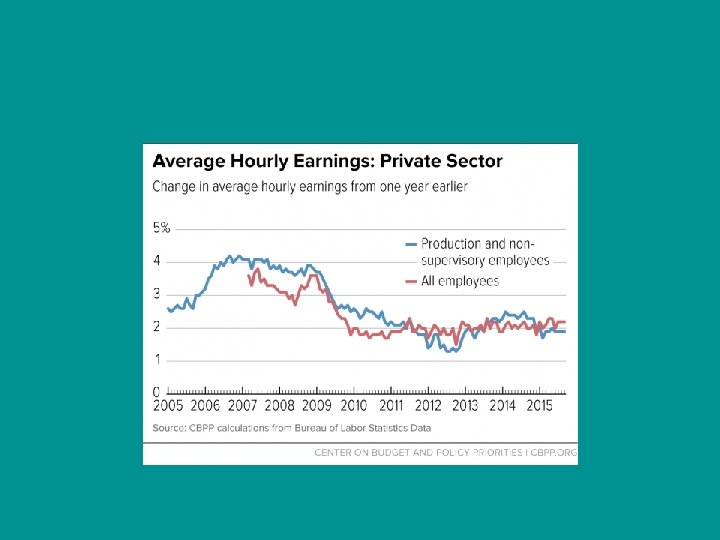
A Satisfactory Recovery? A Dynamic Economy for the Middle Class? Since 2007 : 15, 000 American Factories have shut down; more than 2 million manufacturing jobs gone Slow recovery since 2009 has caused a growth gap of $5. 4 trillion unearned and 5. 5 million fewer jobs - Republican Presidential Candidate Rick Santorum Higher wage industries lost 3. 6 million jobs; regained 2. 6 million. Lower wage industries lost 2 million jobs but regained 3. 8 million 6. 9 million working part-time as of Nov 2014 because they couldn’t find full time work – far higher than pre-financial crisis levels. Wall Street Journal Since recovery, 2. 5 million more people employed than in Dec 2007 but employable population has grown by 18 million 2007 average take home pay - $55, 627. 2012 average take home pay - $51, 017 $868: average weekly wage for all American workers in Sept 2015 (up 2. 2% from Sept 2014) Time Nov 2, 2015 From 2009 to 2012, 95% of all income gains were taken in by the top 1% of Americans. Wall Street Journal
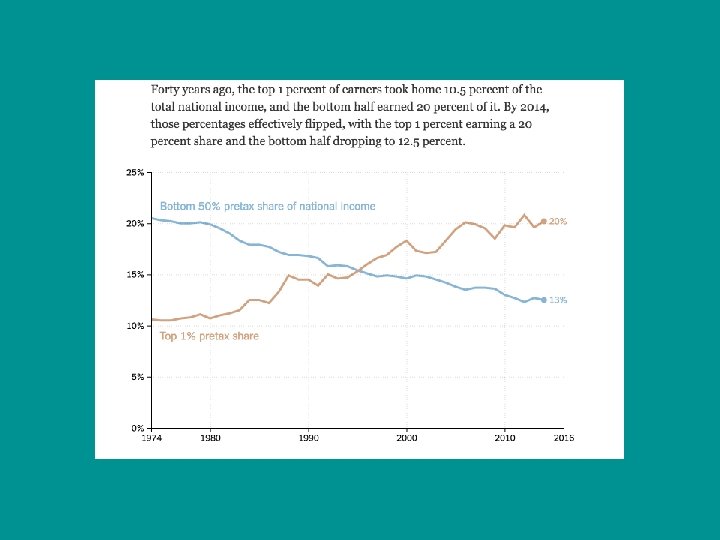
Share of Pre-tax income
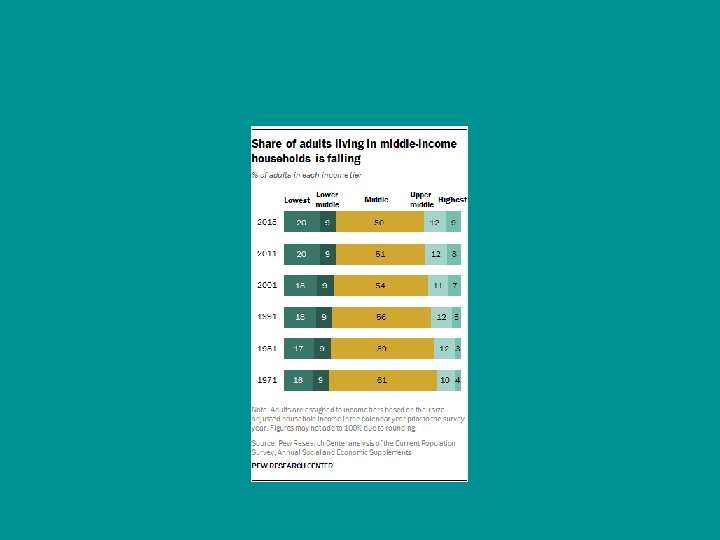
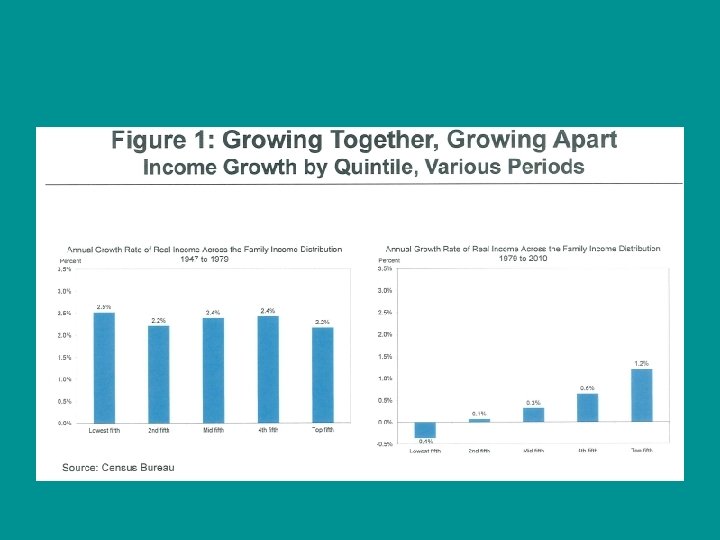
Upper Middle Class has Grown
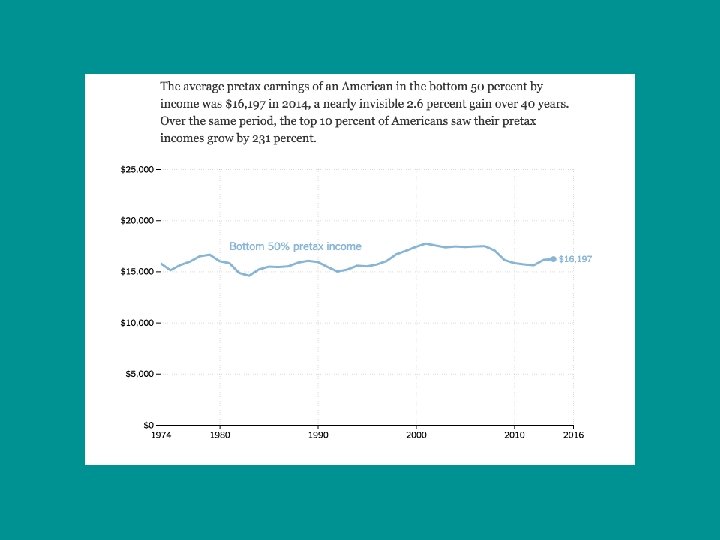
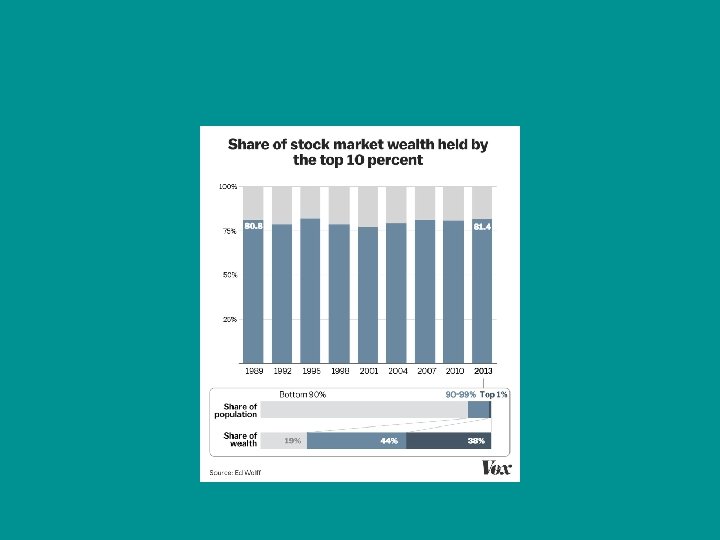
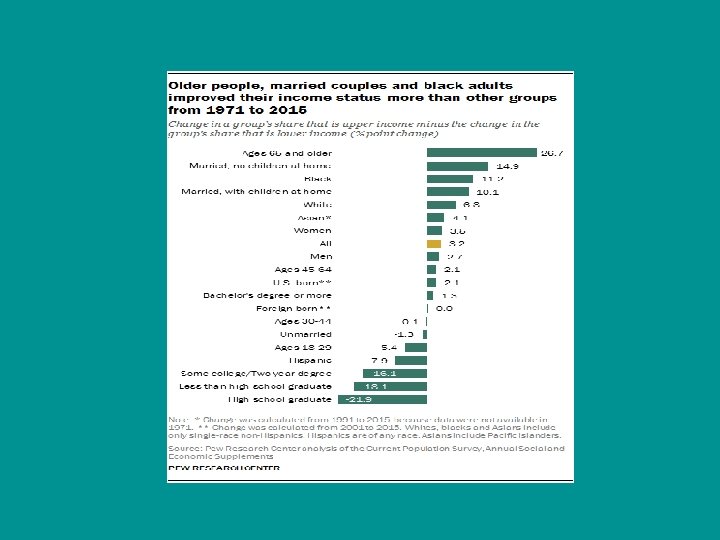
Shrinking Middle Class Income and Wealth • Fully 49% of U. S. aggregate income went to upper-income households in 2014, up from 29% in 1970. The share accruing to middle-income households was 43% in 2014, down substantially from 62% in 1970. • In 2014, the median income of middle income households was 4% less than in 2000. Moreover, because of the housing market crisis and the Great Recession of 2007 -09, their median wealth (assets minus debts) fell by 28% from 2001 to 2013. • Meanwhile, the far edges of the income spectrum have shown the most growth. In 2015, 20% of American adults were in the lowestincome tier, up from 16% in 1971. On the opposite side, 9% are in the highest-income tier, more than double the 4% share in 1971. - Pew Foundation Dec 2015
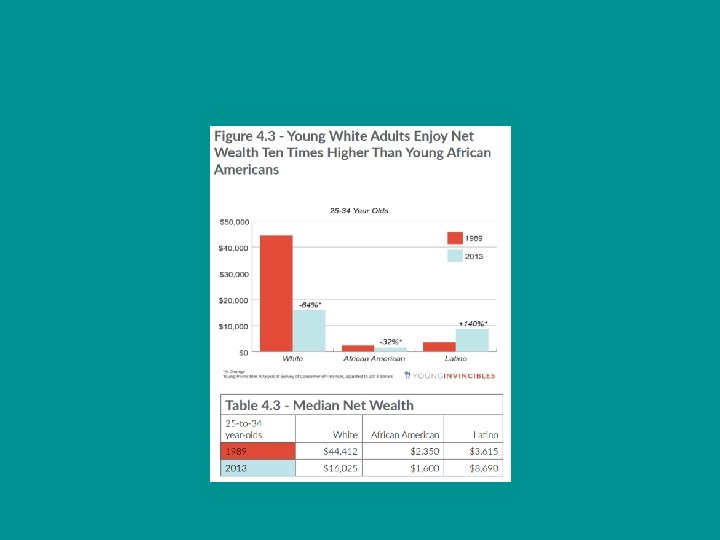
Decline in Household Net Worth 2007 White household median net worth - $192, 500 2013 White family median net worth - $141, 900 2007 Black household median net worth - $19, 200 2013 Black household median net worth - $11, 000 2007 Hispanic household median net worth – $23, 600 2013 Hispanic household median net worth - $13, 700 - New York Times Dec 13, 2014
102. 6 million working age Americans do not have a job right now 7. 9 million working age Americans are “officially unemployed” 94. 7 million working age Americans are considered to be “not in the labor force”. - Michael Snyder, Wash Post Blog
S&P 500 Stock Index
Dow Jones Industrial Average
Ab us e Tyranny, Corruption Government ry of lity sibi uc ia Fid NGOs pon Res Social Justice Business Stewardship Breakdown of Social Capital Negative Externalities Power
20
Wisdom from Warren Buffet “When you combine ignorance and leverage, you get some pretty interesting results. ”
Corporate Profits: Financial and Non. Financial Sectors
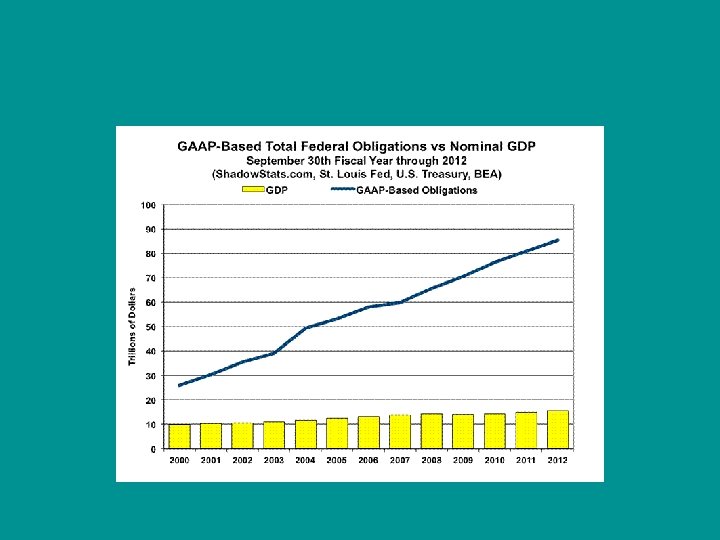
Oh, by the way … USA Debt Clock. com estimates that Total Unfunded Liabilities of the US government are $123 trillion. - Social Security - Medicare - prescription drugs - national healthcare
2014 World GDP – US$77. 86 Trillion - - - - - - - - -
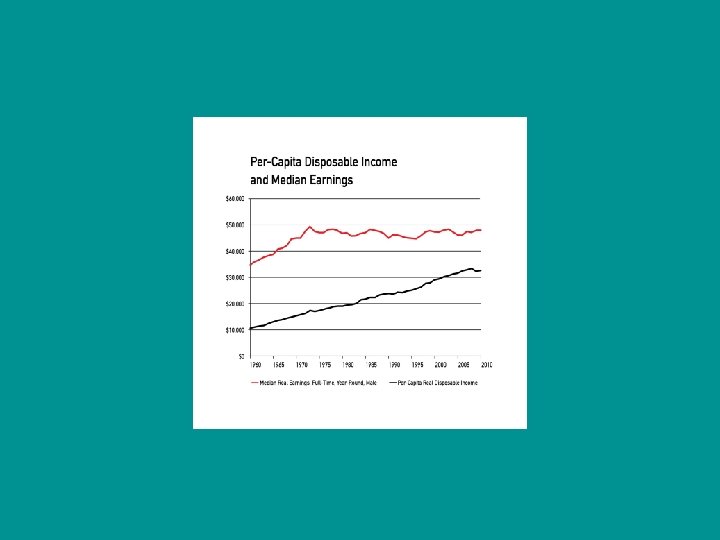
Income Growth for Americans 1962 2014
Dow Jones Industrial Average
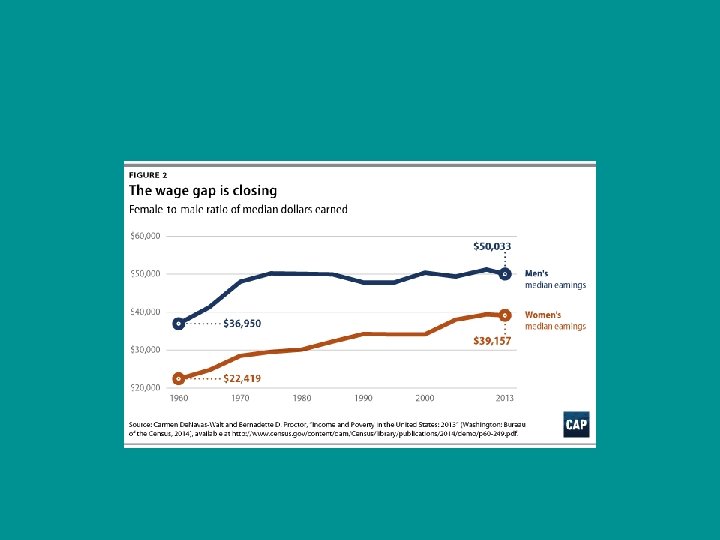
Social Security Administration • 38 percent of all American workers made less than $20, 000 last year. • 51 percent of all American workers made less than $30, 000 last year. • 62 percent of all American workers made less than $40, 000 last year. • 71 percent of all American workers made less than $50, 000 last year.
Russell Sage Foundation As Allison Schrager writes over at Bloomberg Businessweek, middle class families are poorer today than in the Reagan days for two main reasons. For starters, housing collapsed—and for most Americans, their home is their biggest source of savings by far. Second, household debt has risen significantly over time. Because wealth is just the value of what we own minus what we owe, the typical family is now worth less than 30 years ago. Or is it closer to 45 years ago? In case the chart didn't make you depressed enough, consider this: New York University professor Edward Wolff has calculatedthat, by 2010, median net worth in the U. S. had plummeted to its lowest level since at least 1969. Now, Wolff's research and the Russell Sage report were based different data sets. But the newer numbers still suggest that middle-class wealth has declined a bit in the last four years. So when it comes to their financial health, many American households might well be stuck back in the age of Aquarius.
Inflation adjusted percentage increase in after-tax household income for the top 1% and the four quintiles between 1979 and 2005
Statistics on Wealth Disparities • Income of the top 1 percent of Americans is twice that of the bottom 50 percent. • • The wealth of the top 160, 000 families is greater than that of the poorest 145 million families. • • The average income of the top 1 percent in 2012 was $717, 000. • • The income in 2014 of the average American was $51, 939. • • The average wealth in 2012 of the top 1 percent was $8. 4 million. • • The wealth of the median American family in 2012 was $121, 000. • • The wealth of one family, the Waltons of Wal-Mart fame, is equal to that of the bottom 40 percent of Americans. • • Between 1979 and 2007, the income of the top 1 percent has grown five times that of the average American. • • The average income in 2012 of the Fortune 500 Companies’ CEOs was $10. 5 million.
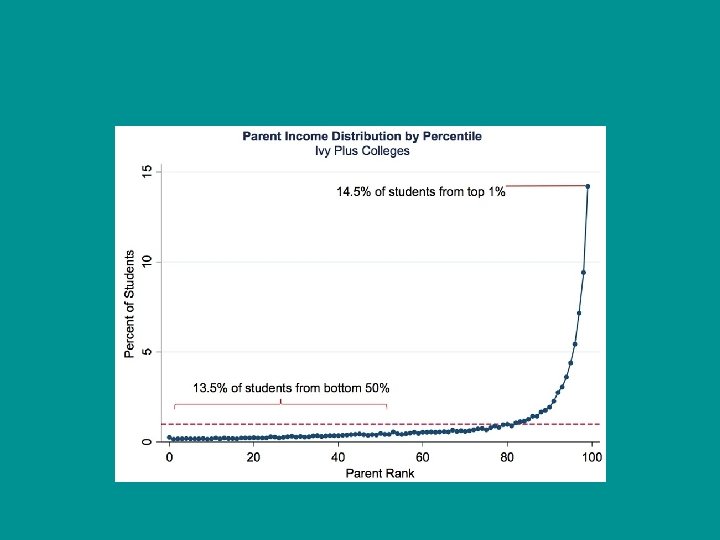
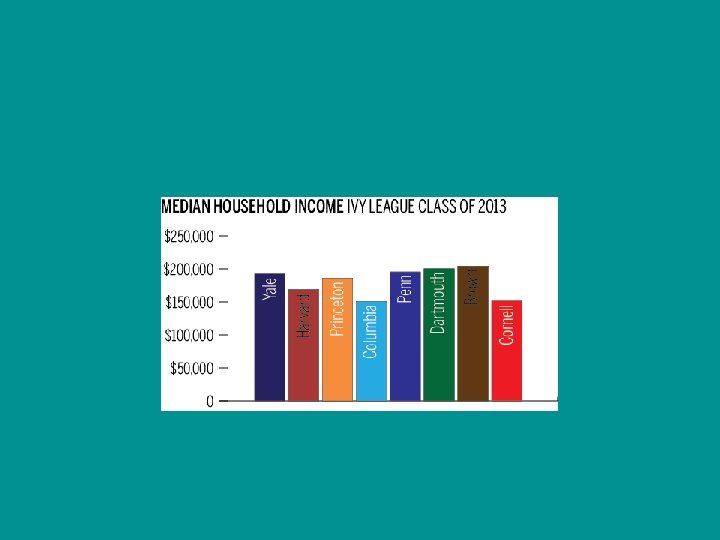
The Rich Get Richer via Education
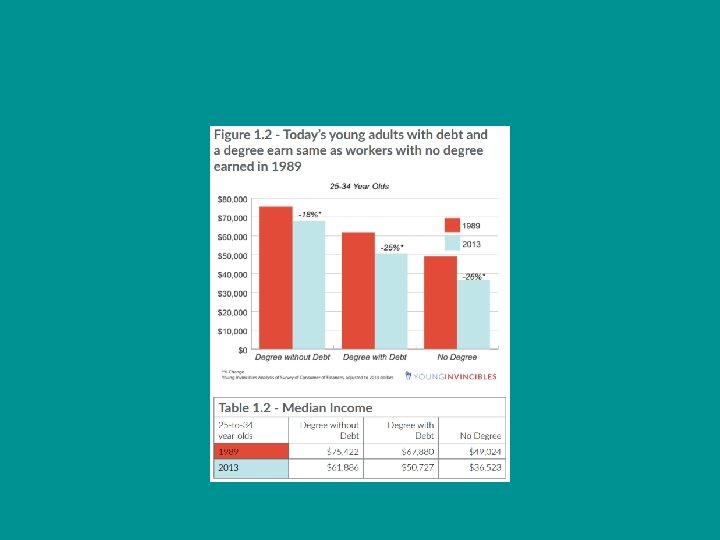
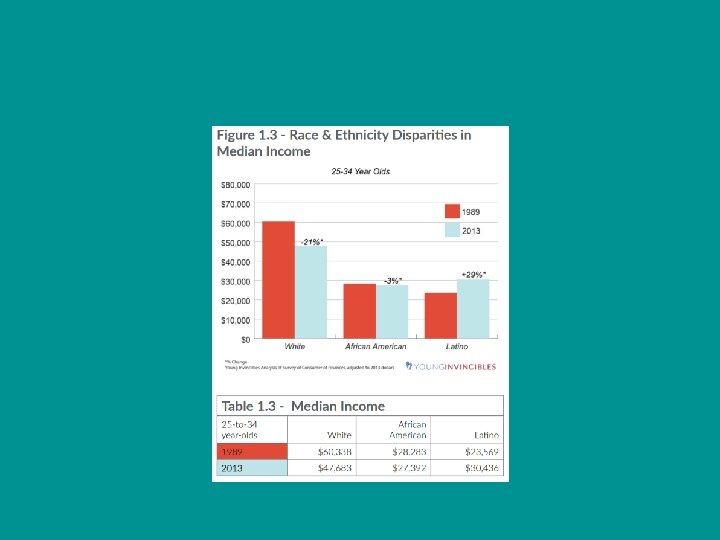
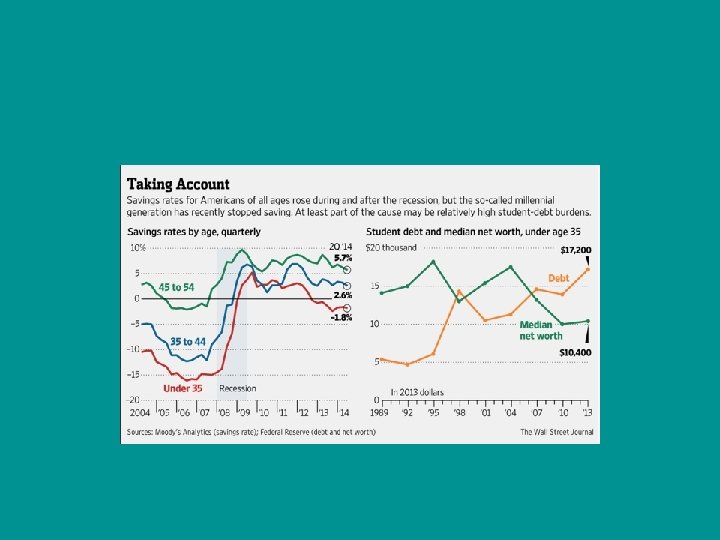
Boomers and Millennials
US New Company Formation • 1997 – 550, 000 new business establishments • 2006 – new business establishments peaked at 650, 000 – created 3. 6 million new jobs • 2012 – 400, 000 new business establishments • Since 2008 annual business closures have exceed annual business formations • 2015 start ups created 2. 8 million new jobs
Small Business Job Creation 1980 s – small businesses (under 100 employees) generated 58% of net new jobs 1990 s – small businesses generated 49% of net new jobs 2016 – small businesses generate 31% of net new jobs
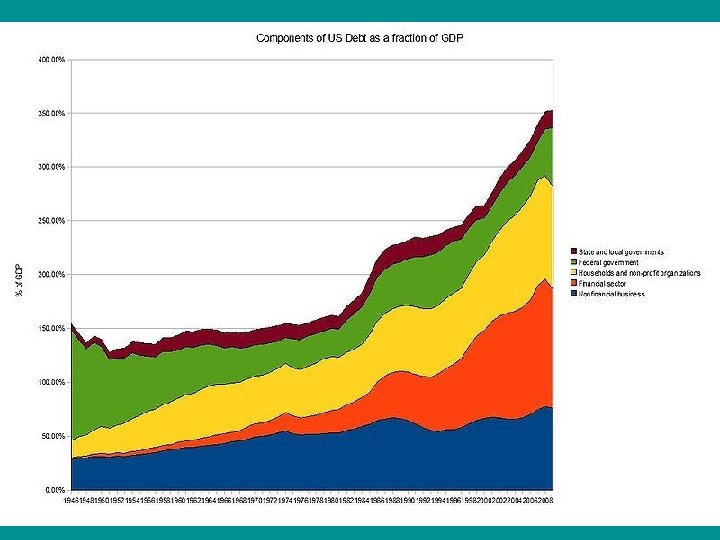
Why did Our Appetite for Debt Change? The Baby Boomers Arrived Raised under an ethic of entitlement “Teenagerism” invented An allowance mentality cultivated Vietnam War protest and rejection of personal responsibility “Inner-Directed” became “Other-directed” as core values evaporated and Mammon’s seductive promises grew in appeal
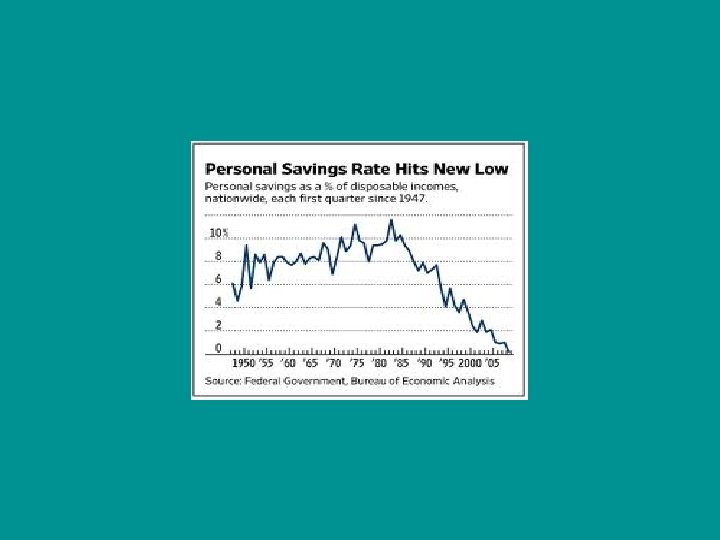
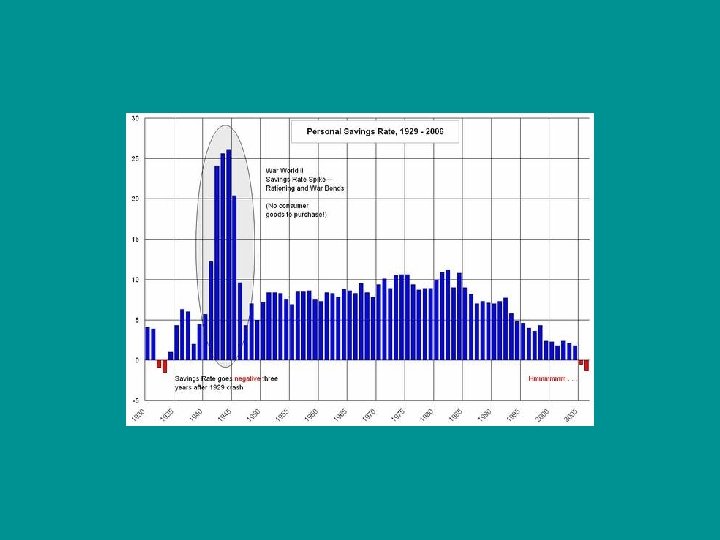
US Average Savings • Approximately 62% of Americans have less than $1, 000 in their savings accounts; well over half have less than $25, 000 in their accounts; 28% have nothing in their accounts; and 21% don’t even have a savings account • 66 million adults have no dollars saved for emergencies • 42% of Americans say they could not afford emergency expenses of $400 - NBC News June 21, 2016
Retirement Savings • In 2015 of all Americans nearing retirement - those between the ages of 55 and 64 – only 60% have retirement accounts Average Account Balance is $104, 000 • All US retirement accounts Median balance is $29, 603 • Incomes from $61, 000 to $100, 000 have savings of $100, 000 • Incomes more than $138, 000 have savings of $452, 000 • Fortune 500 CEOs have $17. 7 million in retirement savings (Employee Benefit Research Institute) • Total retirement savings of Fortune 500 CEOs: $4. 9 billion or the equivalent to the retirement savings of the 41% of Americans at the lower income levels
Social Security and Medicare • Medicare and Social Security – 41% of Federal Spending in 2015 (up from 36% in 2011) • Social Security spent more than tax receipts since 2010 but funding with interest on prior collections. In 2020 will spend more than collected, including interest earned. In 2034 will be exhausted. • 2008 – 3. 2 contributing workers for each SS recipient; 2015 2. 8 contributing workers; will drop to 2. 2 contributing workers over next two decades • Medicare trust fund (supporting 55 million Americans) will be exhausted by 2028 - 2016 annual report of Medicare and Social Security Trustees
Social Security and Medicare Winners and losers Estimate: Current retiree will receive $327, 000 more from Social Security and Medicare than contributed in working lifetime New born will pay into Social Security and Medicare $421, 000 more that he/she will receive in future benefits (Todd Buchholz, The Disunited State of America, 2016)
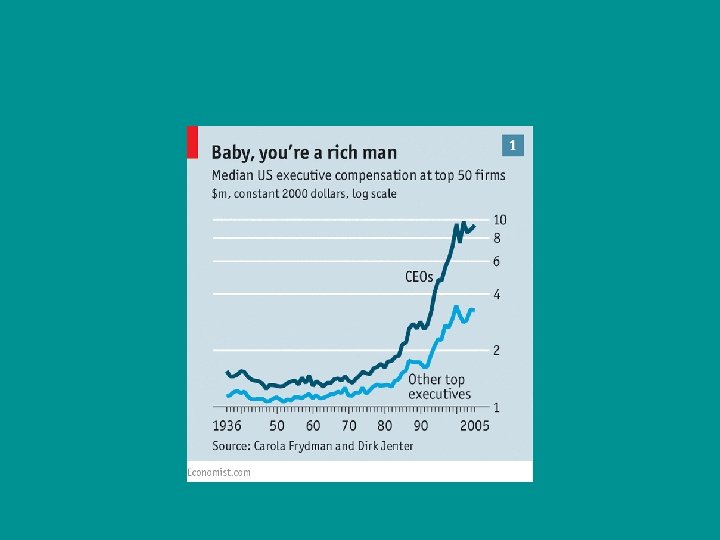
CEO Compensation Ratio to average worker salary (Economic Policy Institute)
US Risk-Averse Culture
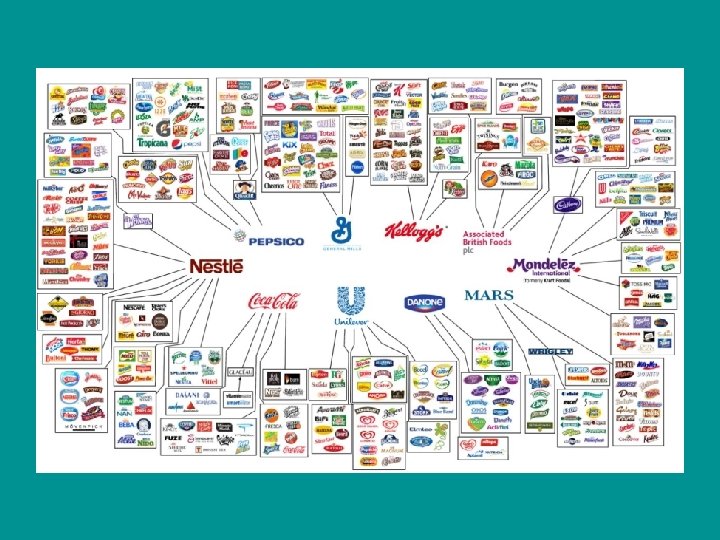
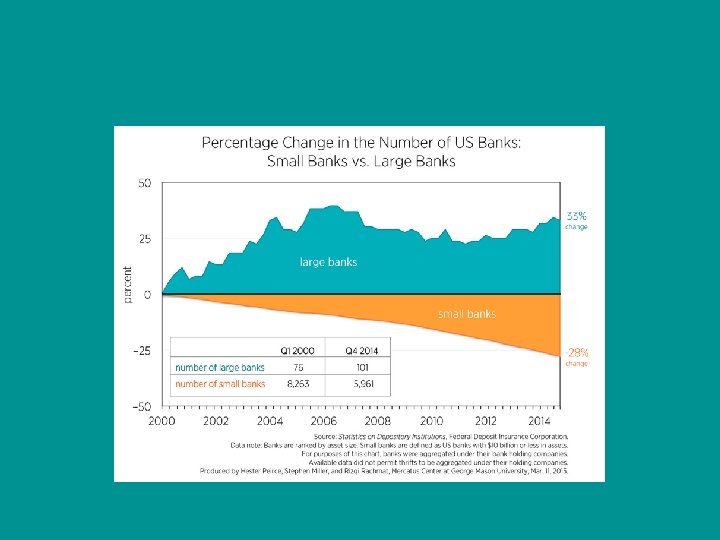
Retail Markets are More Concentrated Now
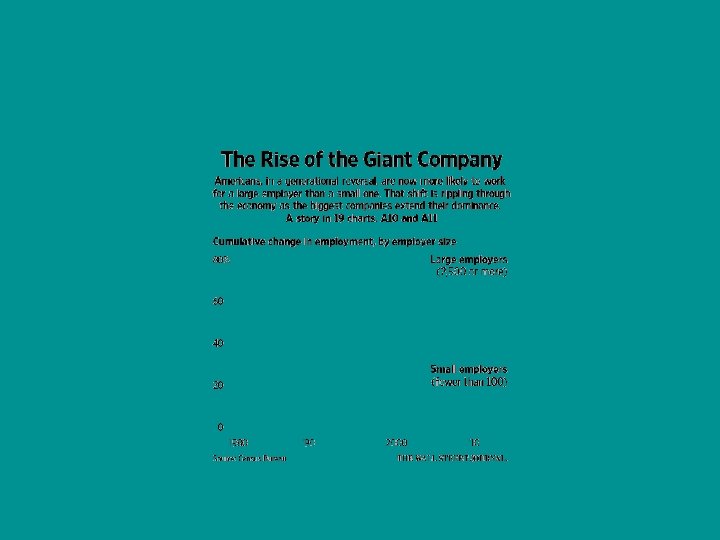
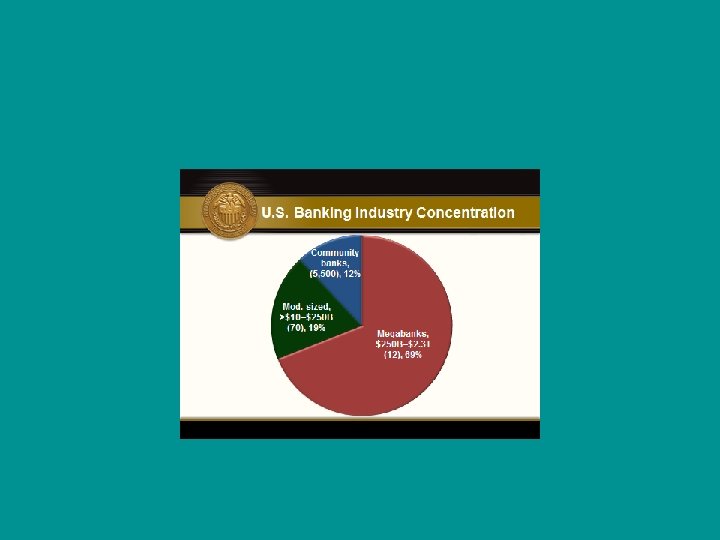
Concentration of Market Power America’s largest companies 1994 – 33% of GDP 2013 – 46% of GDP Five Largest Banks 2000 – 25% of banking assets 2013 – 45% of banking assets
Concentration of Market Power • Of 13 sectors in US Economy, 10 were more concentrated in 2007 than in 1997 • Since 2008, $11 trillion in deals (46% of market value of such companies) to increase market share and pricing power – airlines, cable tv, telecoms, food and health care • Tech firms with high market share make huge profits – they hold 41% of all cash held by nonfinancial firms - The Economist, Dec 5, 2015
6 Companies now own 90% of all of our media.
4 Top Firm Concentration of Total Revenues
US Companies Cash On Hand
US Companies – Cash Abroad Total: $1. 73 trillion
J&J Stock Buyback Drugmaker Johnson & Johnson announced a $10 billion stock buyback program today (Tuesday Oct 13, 2015) amid a mixed Q 3 earnings report. The $10 billion JNJ stock buyback represents about 3. 7% of the company's outstanding shares. The JNJ stock buyback will be made at management's discretion periodically on the open market or through privately negotiated transactions. Company officials said the buyback program has no time limit and may be suspended or discontinued at any time. The $10 billion JNJ stock buyback will be financed through debt issuance, company officials said. JNJ shares are down slightly today after the mixed earnings report. Year to date, the JNJ stock price has fallen 8. 4%. The JNJ stock buyback is part of a huge share repurchasing movement we've seen on Wall Street in recent years. In fact, an average of $500 billion in stock buybacks have taken place each of the last four years.
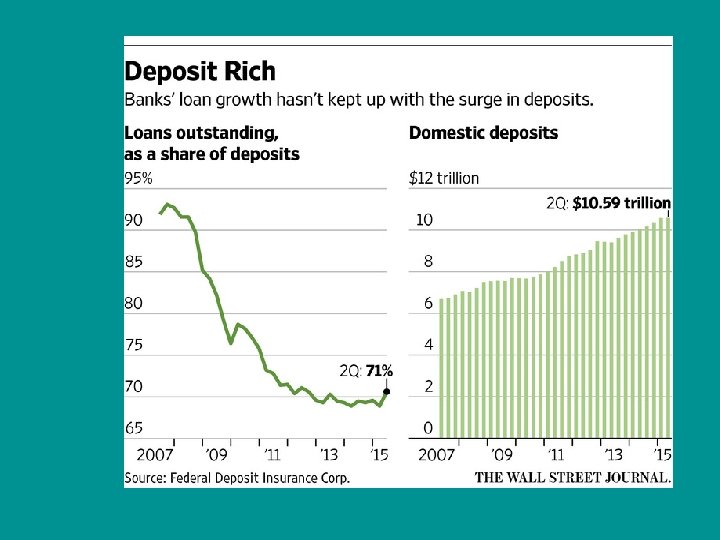
Big Banks Don’t Want Cash JP Morgan has cut unwanted cash deposits by $150 billion by charging fees for holding large sums of cash for customers. Estimate that 4 largest US banks are holding $650 billion of “nonoperating” deposits - Wall Street Journal, Monday Oct 19, 2015
Surplus bank reserves Reserve balances required Reserve balances maintained 4 Date Reserve balance requirements 1 Top of penalty- free band 2 Bottom of penalty free band 3 Balances maintained to satisfy reserve balance requirements 5 Total Balances maintained that exceed the top of the penalty- free band 6 Month 7 Sept. 2014 81, 892 90, 096 73, 690 2, 759, 284 89, 839 2, 669, 445 Oct. 2014 85, 026 93, 544 76, 511 2, 705, 668 93, 260 2, 612, 408 Nov. 2014 86, 424 95, 081 77, 769 2, 519, 578 94, 838 2, 424, 740 Dec. 2014 82, 770 91, 061 74, 481 2, 606, 700 90, 852 2, 515, 848 Jan. 2015 90, 522 99, 589 81, 458 2, 683, 709 99, 273 2, 584, 437 Feb. 2015 89, 118 98, 045 80, 193 2, 496, 868 97, 853 2, 399, 015 Mar. 2015 91, 495 100, 660 82, 333 2, 675, 202 100, 477 2, 574, 726 Apr. 2015 92, 469 101, 729 83, 209 2, 698, 960 101, 495 2, 597, 465 May 2015 92, 358 101, 607 83, 111 2, 584, 359 101, 248 2, 483, 111 June 2015 87, 882 96, 684 79, 082 2, 553, 138 96, 362 2, 456, 776 July 2015 91, 834 101, 030 82, 638 2, 590, 841 100, 727 2, 490, 114 Aug. 2015 96, 142 105, 770 86, 517 2, 608, 263 105, 413 2, 502, 851 Sept. 2015 91, 977 101, 188 82, 767 2, 643, 958 100, 898 2, 543, 060
Parking Money On Monday October 5, the US Government sold $21 Billion in 0% 3 -month Treasury Bills For each $1 offered for sale, bids came in for $4. 14
US M 1 Money Multiplier
Big Banks Cut Back on Lending to Small Businesses 2006: 10 largest banks lent $72. 5 billion in small loans 2014: 10 largest banks lent $44. 7 billion in small loans (decrease of 38%) Nonbank lenders increased market share from 10% to 26% - charging up to 39% interest instead of bank rates of 5% to 6% - Wall Street Journal Nov 27, 2015
Venture Capital for Startups is Down 2014 - $7. 5 billion invested in 3, 368 financing deals 2015 - $6. 91 billion invested in 1, 983 financing deals (But in line with average annual financing deals since 2011)
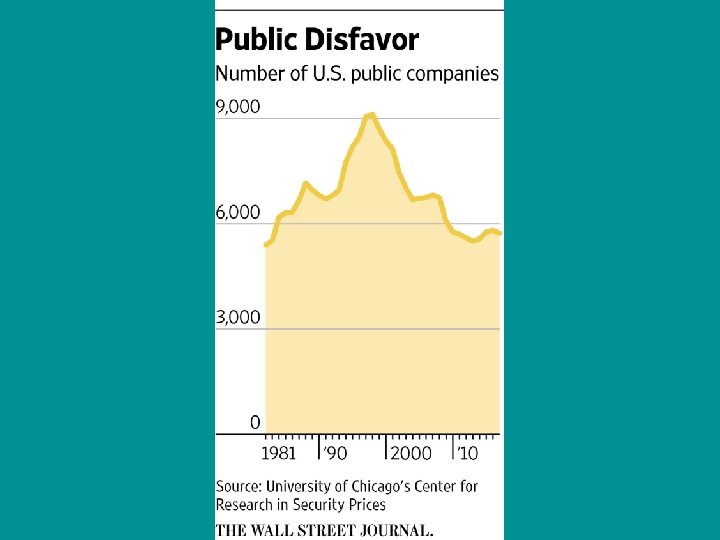
IPO Market is Down 2014 - $95 billion in IPOs 2015 - $36 billion in IPOs 2016 - $11. 5 billion in 54 deals in first seven months —down from the $22. 9 billion raised through 118 deals through the same period last year.
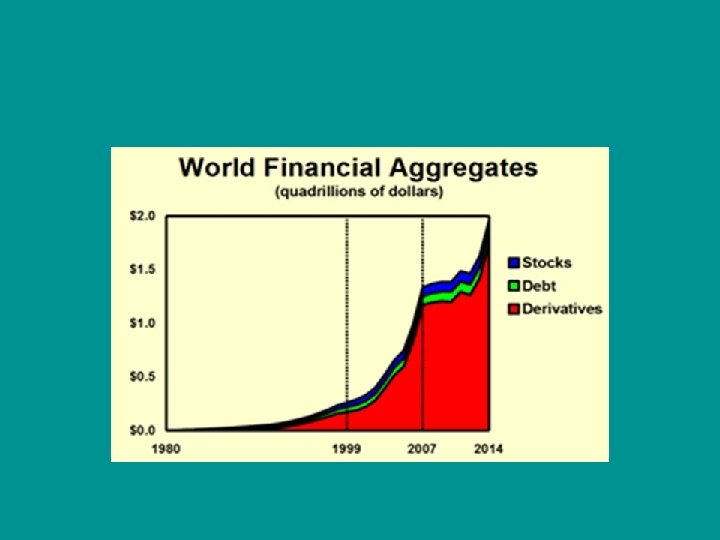
Global Market for Derivatives
How many medals does it take to make a commander?
US Spending on Education and Student Achievement
Education and Wealth US top 200 colleges/universities admit 70% of their students from families in top 25% of income distribution Since 1996 affluent families have increased educational spending on their children by 300%; no increase for education of middle and lower class children
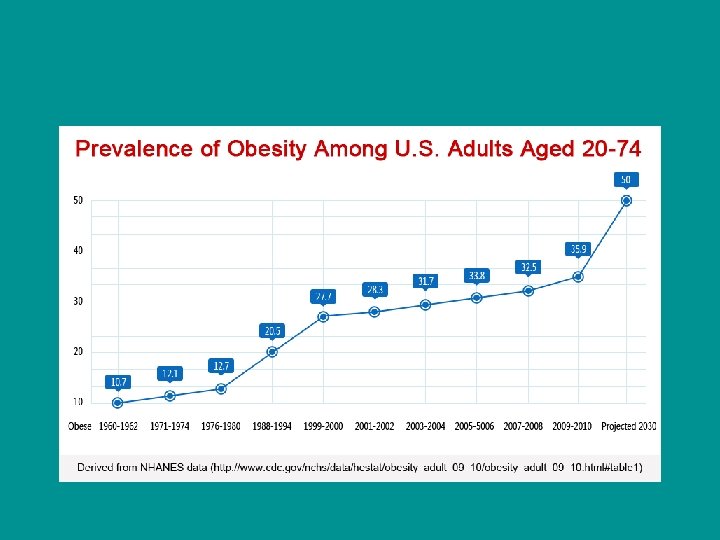
US Obesity Levels 2014 38% of adults obese – up from 32% in 2004 38% of women; 34% of men; 57% of African American women; 38% of African American men; 46% of Hispanic women; 39% of Hispanic men 2016 50% of adults obese; 20% of adolescents
Proxy for rise in ADHD cases
Open. Table, the popular site for online reservations, recently announced that over the past two years, reservations for parties of one have grown by 62 percent in the U. S. , making it the fastestgrowing table party size. The trend mirrors a wider cultural shift, with the number of singleperson households rising as never before.
US Marriage/Divorce Rates
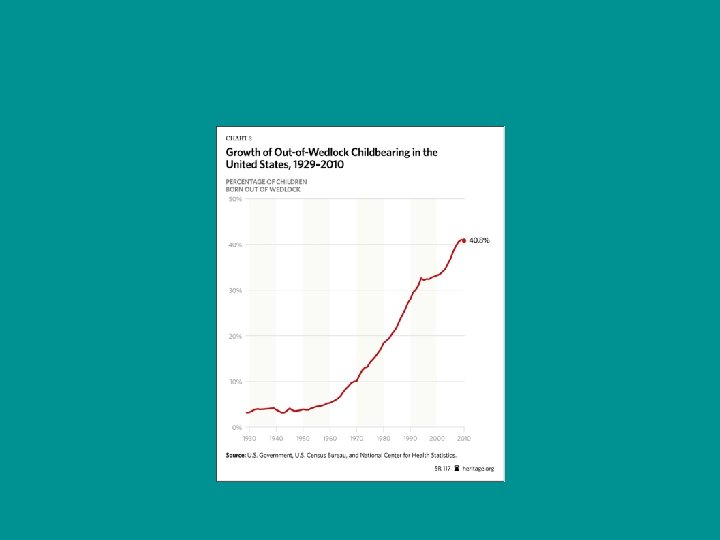
Mother’s Marital Status 2011
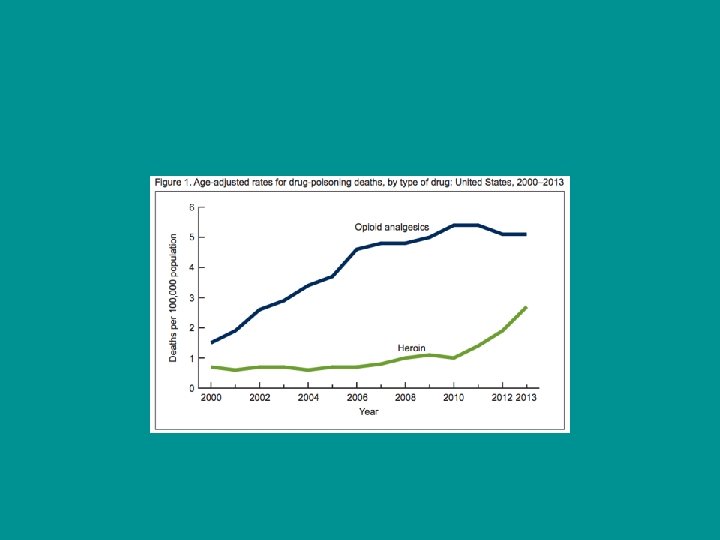
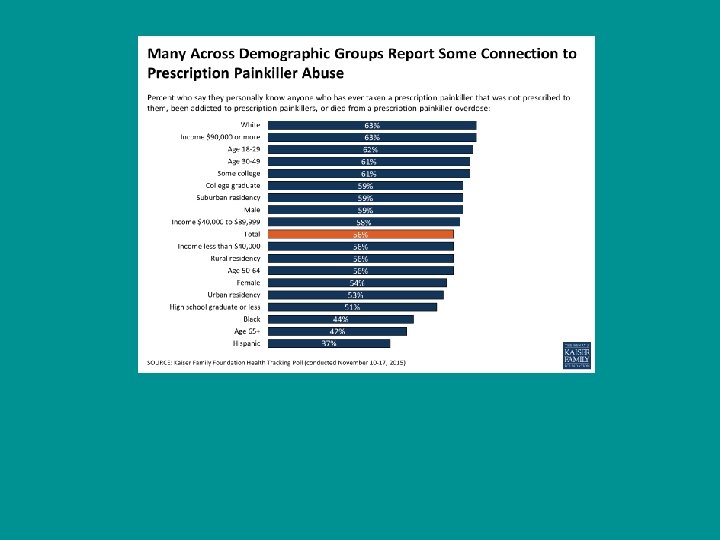
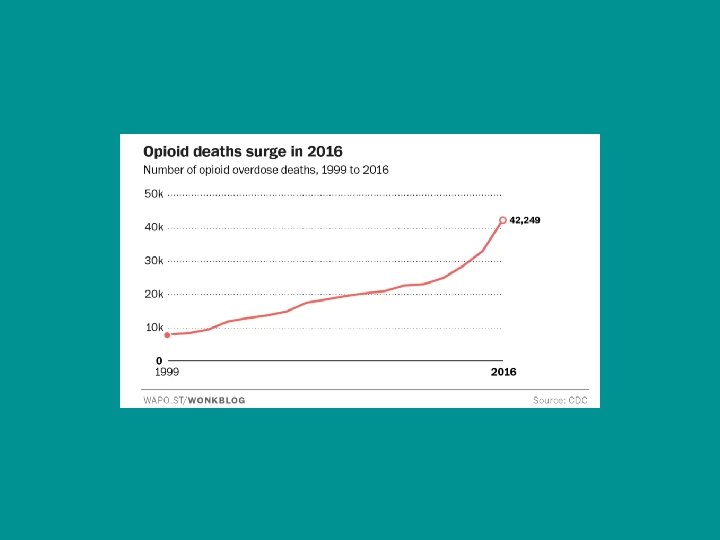
Drugs of Abuse • • • • Alcohol Club Drugs Cocaine Fentanyl Heroin Inhalants LSD (Acid) Marijuana MDMA (Ecstasy) Methamphetamine PCP/Phencyclidine Prescription Drugs Steroids (Anabolic) Tobacco Addiction (Nicotine)
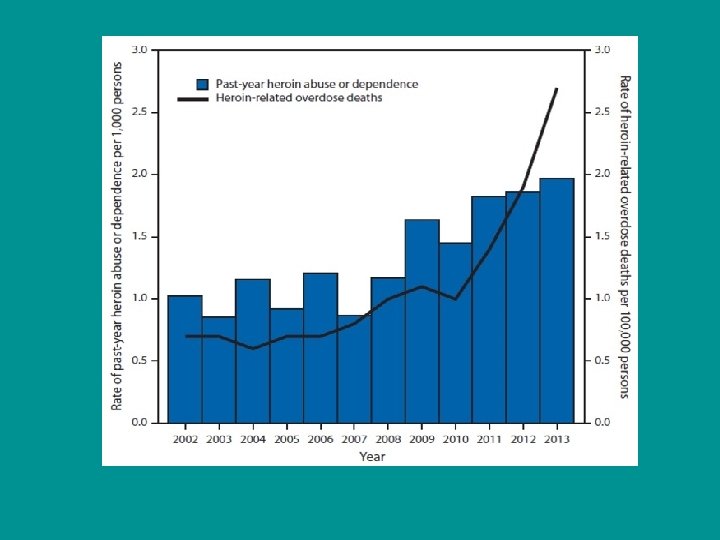
Opioid use in a nation of 325 million people
Please join us at the 2018 Cultural STAR Program Information Session Attend to learn more about the program and the application process • When: Monday, January 22, 2018 from 1: 00 -2: 00 p. m. • Location: George Latimer Central Library: Otto Bremer Room 1 st Floor • 90 W 4 th St Saint Paul 55102 See map: Google Maps Tel. 651 -266 -7000
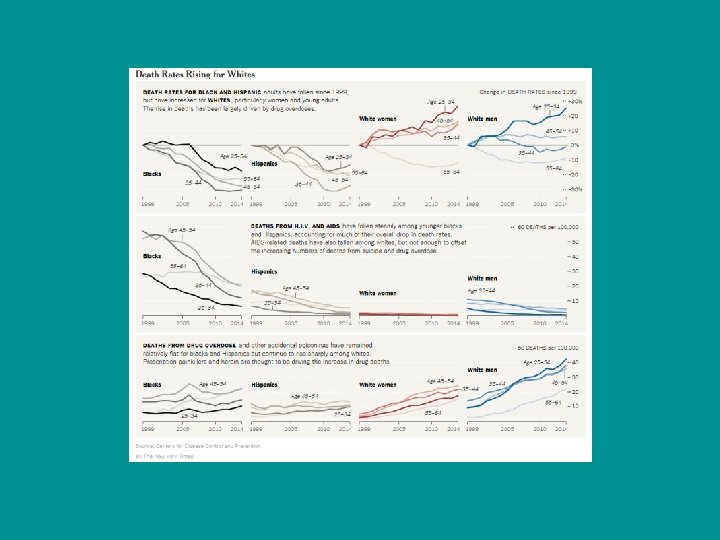
US mortality rates
Age at First Birth US Women green – over 30; dark pink under 20
Death by Gunshot Every day on average 300 Americans are shto 2015: 36, 252 firearms deaths (22, 018 suicides and 12, 979 homicides) (Total US casualties in VN War – 58, 000) 85, 000 injuries Over the last 50 years more Americans have been killed by guns than in all the wars in US history
Voting Participation 1824 - 2008
Trust in Federal Government
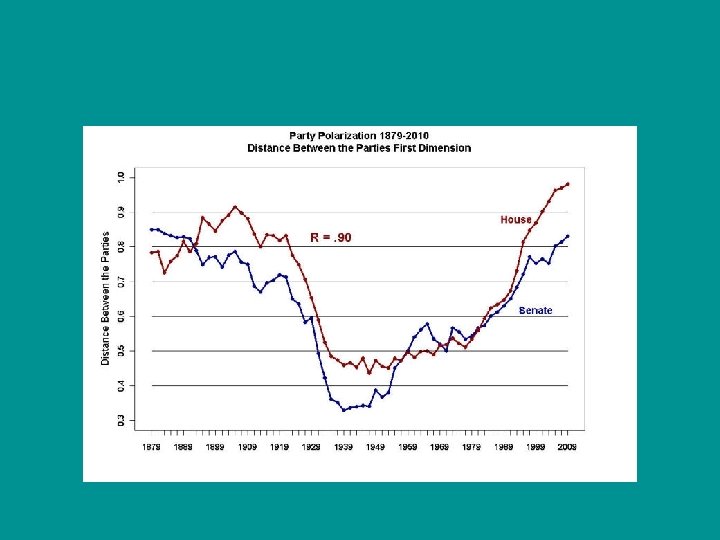
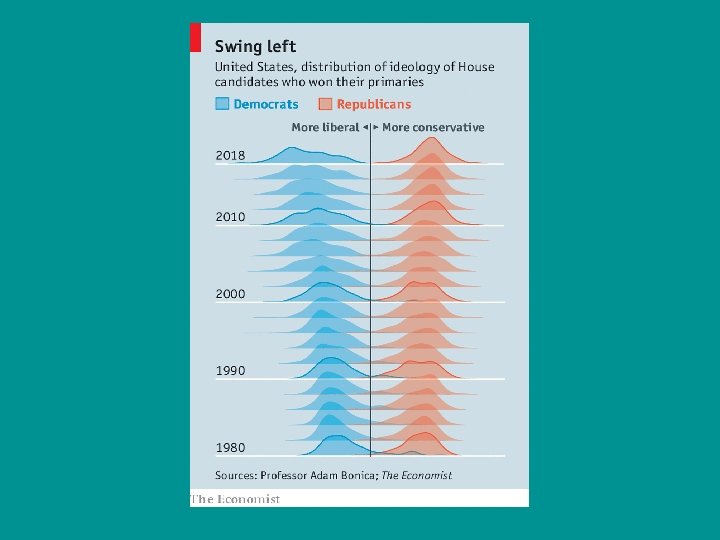
Party Polarization in US House of Representatives
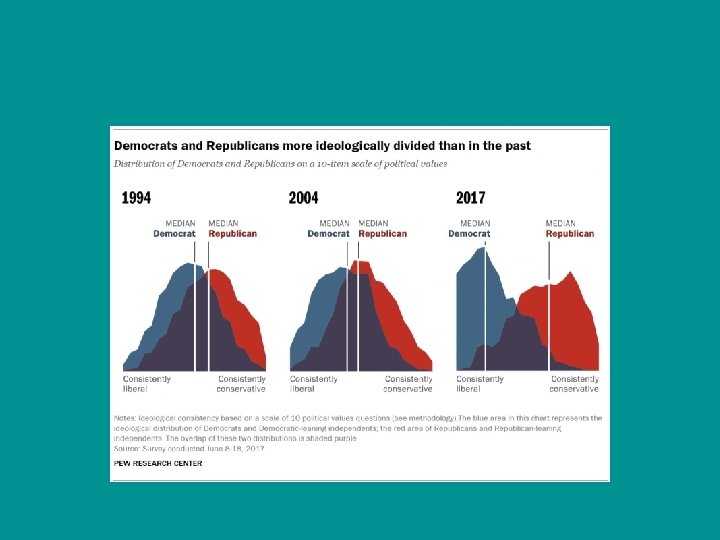
Would You Want Your Daughter/Son to Marry a … 1960: 5% of Republicans and 4% of Democrats would be displeased if their children married someone of the opposite Party 2012: 49% of Republicans and 33% of Democrats would be displeased if that happened
Trust in Institutions - 2015
Confidence in Institutions: 2016 and 2017 June 2016 June 2017 Change: 2016 to 2017 % % pct. pts. Newspapers 20 27 7 Public schools 30 36 6 Banks 27 32 5 Organized labor 23 28 5 U. S. Supreme Court 36 40 4 Criminal justice system 23 27 4 Congress 9 12 3 Television news 21 24 3 Big business 18 21 3 Small business 68 70 2 Police 56 57 1 Church or organized religion 41 41 0 Military 73 72 -1 Medical system 39 37 -2 Presidency 36 32 -4 News on the internet n/a 16 n/a GALLUP
Church Attendance Source: General Social Survey, 2010. © 2012 The Heritage Foundation
Why? Thesis 1: culture – it was the Baby Boomers – the “Me Generation” Solution: ashes to ashes, dust to dust; educate the young in wisdom and virtue Thesis 2: Rent seeking (The redistribution of benefits at another’s expense without added social value) – the rich and the poor live off government; regulation (K Street, Uber); intellectual property (drug companies, Apple, Google); corporate control premium for management; “Make ‘em an offer they can’t refuse” Solution: more use of market forces Thesis 3: Global Trends Globalization/sustainability costs more No Solution. Live with it. Increase your real value added to society Thesis 4: Binary Economics – higher returns to capital than labor - own capital/earn salary – computerization. Solution: make everyone a capitalist through ownership of assets
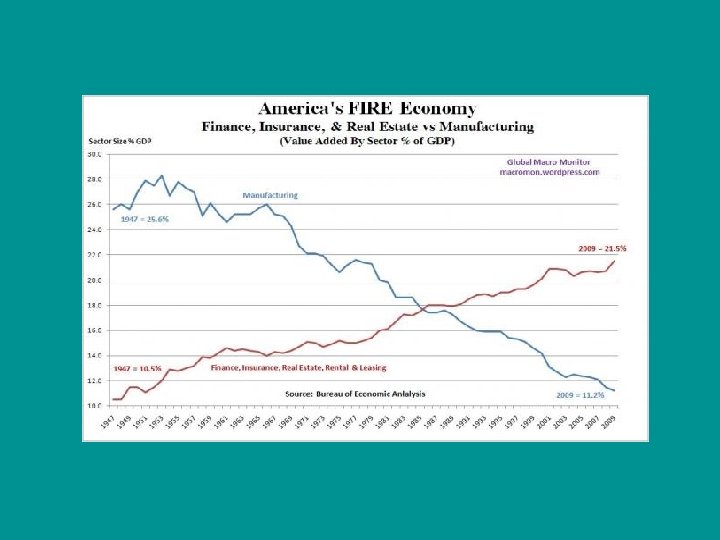
Thesis 5: Finalization or “Other People’s Money” (Commodity: contract rights; based on legal claims to future payments; like fiat currencies) In 1980 Financial Sector contributed 4. 9% to GDP In 2006 it contributed 8. 6% to GDP The U. S. finance industry comprised only 10% of total nonfarm business profits in 1947, but it grew to 50% by 2010. The mean salary in New York City's finance industry rose from $80, 000 in 1981 to $360, 000 in 2011, while average New York City salaries rose from $40, 000 to $70, 000.
Financialization and Rent Extraction Trading tax on system – profits to one are loss to another High-frequency/cartel position due to capital invested Having the “Edge” inside knowledge of market prejudices Leverage; ending Glass-Steagell. Bear – 35 to 1 ratio; Lehman 44 to 1; Deutsche Bank 50 to 1 Arbitrage – Regulatory arbitrage (credit default swaps, repo transactions); Fiscal arbitrage (tax dodge); Accounting Arbitrage (Enron “sales” to Citibank and JP Morgan; Bros. Repo 105 s) Lehman Solution: market competition; break up the big institutions; self-insurance; bring back Glass-Steagell – (Volcker Rule: proprietary trading is down in big banks)
Thank You 144