What Has Caused the Global Warming Hiatus Since

What Has Caused the Global Warming Hiatus Since Year 2000? Aiguo Dai Dept. of Atmospheric & Environ. Sci. , SUNY, Albany, NY Related papers: Dai, A. , J. C. Fyfe, S. -P. Xie, and X. Dai, 2015: Decadal modulation of global surface temperature by internal climate variability. Nature Climate Change 5, 555 -559. England, M. and Co-authors, 2014: Recent intensification of wind-driven circulation in the Pacific and the ongoing warming hiatus. Nature Climate Change 4, 222– 227. Fyfe, J. C. , N. P. Gillett and F. W. Zwiers, 2013: Overestimated global warming over the past 20 years. Nature Climate Change 3, 767 -769. Hausfather, Z. et al. 2017: Assessing recent warming using instrumentally homogeneous sea surface temperature records. Sci. Adv. , e 1601207, DOI: 10. 1126/sciadv. 1601207 Kosaka Y. and S. -P. Xie, 2013: Recent global-warming hiatus tied to equatorial Pacific surface cooling. Nature 501, 403 -407. Meehl eta l. 2016: Contribution of the Interdecadal Pacific Oscillation to twentieth-century global surface temperature trends. Nature Climate Change. 6, 005– 1008, doi: 10. 1038/nclimate 3107 Steinman, B. A. , M. E. Mann, S. K. Miller, 2015: Atlantic and Pacific multidecadal oscillations and Northern Hemisphere temperatures. Science, 347, 988 -991. Trenberth, K. E. , and J. Fasullo, 2013: An apparent hiatus in global warming? Earth’s Future, 1, 19 -32. Watanabe, M. , et al. 2014: Contribution of natural decadal variability to global warming acceleration and hiatus. Nature Climate Change, 4, 893 -897. Xie, SP. & Kosaka, Y. , 2017: What caused the global surface warming hiatus of 1998– 2013? Curr Clim Change 1 Rep. doi: 10. 1007/s 40641 -017 -0063 -0

Outline • Introduction: - What is the warming hiatus? - Why do we care about it? - What are the possible causes? - Forced changes vs. unforced natural variations - Multi-decadal climate oscillations: PDO, IPO, and AMO • Results from a new analysis: - Data and Method - Main findings • Conclusions
")
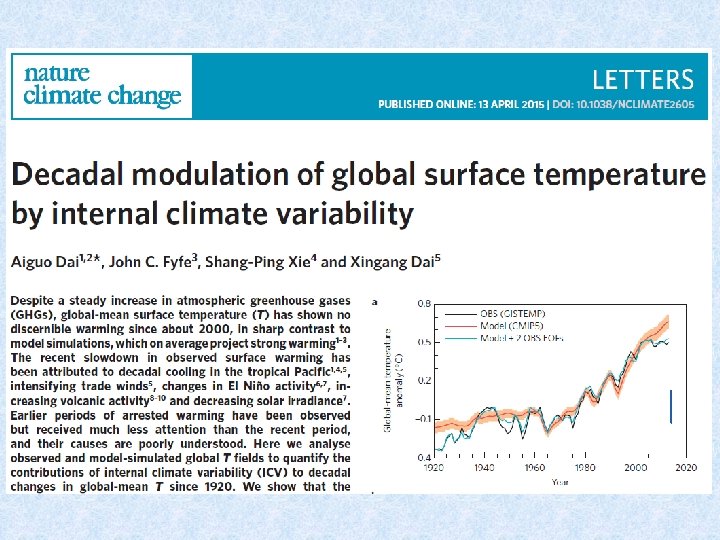
Global-mean Temperature Anomaly: 1920 -2013 Shading=95% confidence range volcanic eruptions Dai et al. (2015)

Karl et al. 2015
")
Hausfather et al. (2017)

Temperature Trend: 1993— 2012 Obs. Models

The Warming Hiatus Has Been Used to Dismiss Nature Climate Science Change, March Issue, 2014 • The warming hiatus undermines the credibility of climate models and their projections of future climate change. • Explaining the hiatus will help us understand decadal

Possible Causes • Cooling in tropical Pacific (Kosaka and Xie 2013; Trenberth and Fasullo 2013; England et al. 2014; Drijfhout et al. 2014): - most likely natural (Watanabe et al. , 2014; Dai et al. 2015; Steinman et al. 2015), but may also be partly forced - involve increased ocean heat storage and trade winds • Stratospheric aerosol forcing (Solomon et al. 2011; Fyfe et al. 2013; Schmidt et al. 2014; Ridley et al. 2014): - due to volcanic activities not considered by CMIP 5 models - but spatial patterns are inconsistent with observations. • Changes in ENSO activities (Kaufmann et al. 2011; Schmidt et al. 2014) • Changes in solar activities (Schmidt et al. 2014) • Other causes: NAO (Li et al. 2013), AMO (Steinman et al. 2015), etc. NAO = North Atlantic Oscillation; AMO = Atlantic Multi-decadal Oscillation CMIP 5 = Climate Model Intercomparison Project, Phase 5

Annual Temperature Change Patterns 2000 -2013 minus 1990 -1999 d. T due to all forcing, CMIP 5 d. T due to anthropogenic aerosols Dai et al. (2015) d. T due to volcanic aerosols Observed d. T

Forced Changes vs. Internal Variations Monthly mean Temperature at Albany, NY: 1874 -2015 Total variations and changes d. T = d. Tforced + d. Tunforced Sun-forced seasonal cycle Residual: mostly unforced internal variations, but may still contain GHGforced changes.
 is the 2")
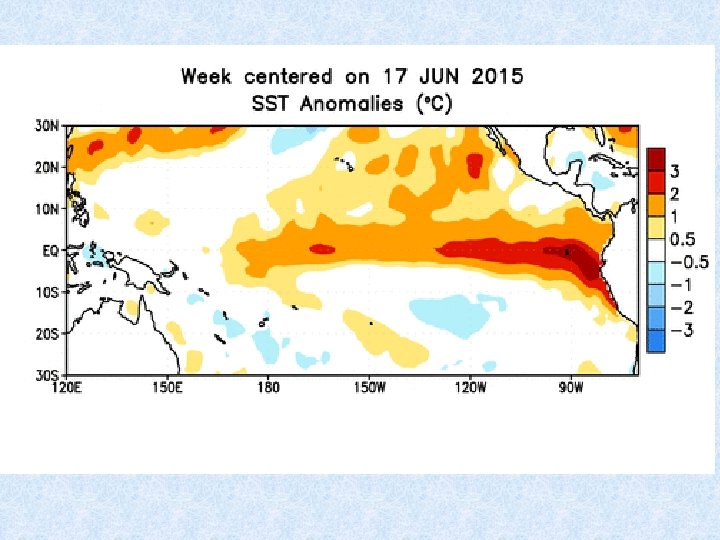
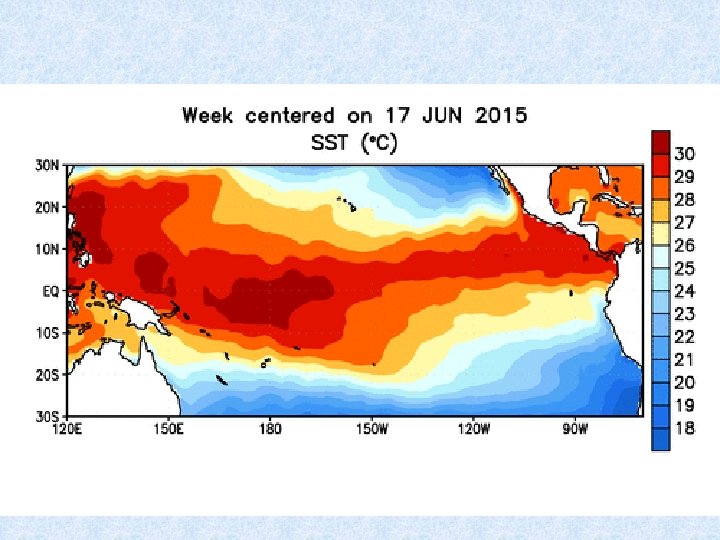
ENSO, PDO and IPO • • The El Niño-Southen Oscillation (ENSO) is the 2 -7 yr quasi-oscillation in the Pacific basin. The PDO is the ENSO-like multi-decadal (40 -60 yr) quasi-oscillation in the North Pacific The IPO is the ENSO-like multi-decadal quasi-oscillations in the whole Pacific Interdecadal Pacific El Niño- of ENSO The PDO and IPO may be Oscillation considered(IPO) as the decadal variability Source: http: //research. jisao. washington. edu/pdo/ Southern Oscillation activity Color: SST Anomaly, contours: SLP anomaly
 • The AMO is the multi-decadal (60 -80 yr) oscillation")
Atlantic Multidecadal Oscillation (AMO) • The AMO is the multi-decadal (60 -80 yr) oscillation in North Atlantic SST and other related fields. • The AMO may result from changes in Atlantic thermohaline ocean circulation. • AMO warm phase leads to more drought over the U. S. Midwest and Southwest, but more rainfall over Florida, and is associated with more hurricanes.

Fully coupled simulation With observed SST in equatorial central to eastern Pacific (~8% of global surface)

IPO=Inter-decadal Pacific Oscillation England et al. 2014

N. H. Temperature is correlated with T in the N. Pacific and N. Atlantic T (X 1) N. Pacific T (X 2) N. Hemispheric T a. X 1 + b. X 2 r 2(black, red)=0. 86 Steinman et al. 2015
 for the")
Outstanding Questions: • What is the role of internal climate variability (ICV) for the warming hiatus? • Can the warming hiatus be largely accounted for by the IPO and other known ICV, so that external forcing is not a major contributor? • How long will the warming hiatus last?
, with SST from")
Data • Observational T data: - GISTEMP (Hansen et al. 2010), with SST from NOAA - Had. CRUT 4 (Morice et al. 2012), with SST from Hadley Ctr. - Sparse observations before about 1920 • Model T data: - CMIP 5 HISTORICAL (1920 -2005) + RCP 4. 5 (2006 -2013) ensemble mean of 66 model runs from 33 models: the forced signal for detrending observed T. - NCAR CESM 1 30 -member ensemble runs from 1920 -2080: for finding warming hiatus in individual model runs. - CESM 1 1000 -yr control run: for quantifying modes of internal climate variability (ICV)
 Analysis • An EOF analysis projects a dataset D (a")
Empirical Orthogonal Function (EOF) Analysis • An EOF analysis projects a dataset D (a series of 2 -d maps) onto a series of orthogonal base functions or spatial patterns (EOFs): Xk = (xjk), j=1, 2, …, M, k=1, 2, …, p, and their corresponding temporal coefficients or principal components (PCs): Yk = (yik), i=1, 2, …, N, k=1, 2, …, p, where i = time index, j=space index, k=EOF mode index, p=min(N, M): • The global-mean time series represented by the kth EOF is Global-mean of the EOF coeffs.

eading EOFs in Observed Surface Temperature global-mean T Global warming mode IPO mode Summary: - Forced & unforced change are mixed together Arctic Oscillation (AO)? - EOF 1 contains both forced trend and unforced variatio - Other EOFs have little effe on global-mean T - Need to first remove the fo component

Method • Removal of the Forced T Changes: A key step - Use CMIP 5 multi-model ensemble mean of global-mean T (Tm) as the forced signal in local T series - Remove the d. T associated with Tm from obs. at each box - Residual d. T contains mostly unforced internal climate variability (ICV) • EOF analysis of the detrended d. T fields: - Contribution of the leading EOFs to global-mean d. T - Comparison of the leading EOF modes to known physical modes such as IPO and AMO

IPO is defined as the 2 nd EOF in global SST fields PC IPO’s temporal pattern IPO Index EOF IPO’s spatial patterns similar to ENSO Dong and Dai (2015)
")
IPO’s Influence on Surface Temperature Dong and Dai (2015)

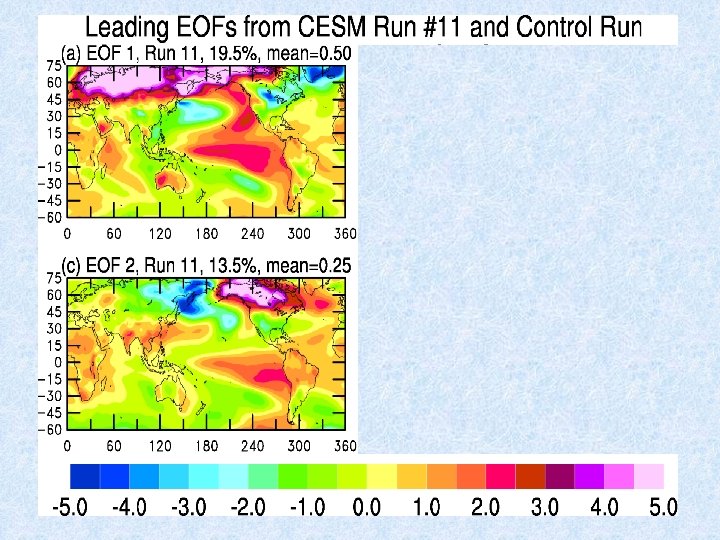
Leading EOFs of detrended T from O EOF 2 and EOF 3 have a global mean close to zero little effect on global-mean T EOF 1 and EOF 4 have a positive global mean significant impacts

EOF 1: IPO Mode GISTEMP EOF 4: AMO-related IPO Had. CRUT 4 AMO

Contribution to Global-mean Temperature 1920 -2013 x 0. 863

T Difference: OBS ─ Model

No Re-scaling x 0. 863 With Re-scaling

Equatorial Central & Easter Pacific T (15 o. S-15 o. N, 180 o-80 o. W)

lobal-mean Temperature: Had. CRUT 4 Case x 0. 762

Global-mean Temperature in NCAR Model CESM 1

Near-future IPO Phase and Global Warming Rate IPO Index ? 1924 -1945 22 yrs 1946 -1976 31 yrs 1977 -1998 22 yrs 19992029? 31 yrs 2020 2030

Conclusions • The recent warming hiatus is caused by the cooling over the Pacific Ocean since around 1993 that cancels warming over other places; • This cooling results from the phase change of the IPO from a warm maximum around 1993 to a cold minimum around 2012; • The IPO, together with secondary contributions from another mode, largely explains the recent warming hiatus and earlier decadal variations in global-mean temperature; • Similar warming hiatus is seen in a coupled model and it is also accounted for by the IPO and another mode of ICV; • The recent warming hiatus is caused mainly by ICV. Any missed external forcing is likely to be a secondary factor. • Such decadal variations in global warming rate should be expected in observations and individual model runs, but not in model ensemble mean, which represents primarily GHG-forced changes; • Recent history suggests that the IPO may reverse course soon,
- Slides: 37