What Goes Around Comes Around FactBased Planning Using

What Goes Around Comes Around: Fact-Based Planning “Using Statistics and Data to Fuel Emergency Plans” Susan Singer Pennsylvania Department of Health Jonathan Anschutz Pennsylvania Emergency Management Agency

How important are data and statistics in the decision-making process? What data and statistics do we need? Where do we get the data and statistics? How do we know if the data is correct? How do we use the data and statistics from prior disasters to drive decision-making for the current disaster? • How do we use the data and statistics from prior disasters to drive plans for future disasters? • •

A 2006 study on contingency planning 1 showed that 46% of companies closed for three days due to a disaster, failed within 36 months. How Important are data and statistics to the decision-making process? Data Mining Meets the Needs of Disaster Information Management ; L. Zheng, et. Al (September 2013) IEEE 1 Transactions on Human-Machine Systems, Vol. 43 No. 5

What does it mean when a Walmart® store reopens after a disaster? • It means the community is beginning to recover. • Power and water have been restored. • There is a viable route to bring goods into the community. • Residents have access to supplies needed to begin rebuilding. • Other businesses will soon be able to reopen.

How important are data and statistics in the decision-making process? • Discussion: Does a hurricane affect a low-income population differently than an upper-middle-class population? How did you arrive at your conclusion? Did you use known data and statistics?

Hurricane Harvey August 27 th Houston, TX The amount of rain that fell In Houston during the first two days of Hurricane Harvey were more than three times the amount of rain that fell in New Orleans during Hurricane Katrina. 3400+ Water Rescues 2500 distress calls came into Houston’s 911 center on the morning of August 27 th How Important are data and statistics to the decision-making process? Source: www. humanityroad. org; Humanity Road is a 501 ©(3) volunteering to data-mine for statistics during disasters.

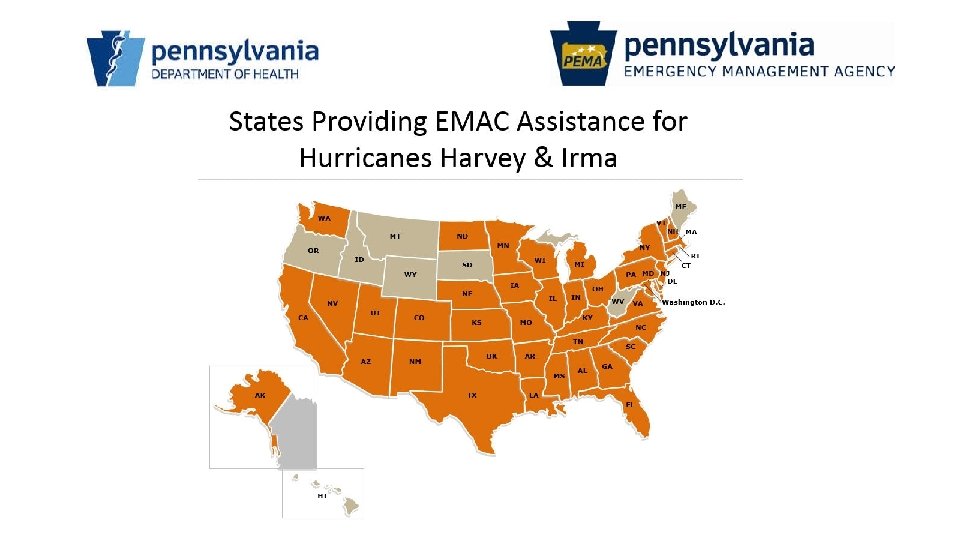
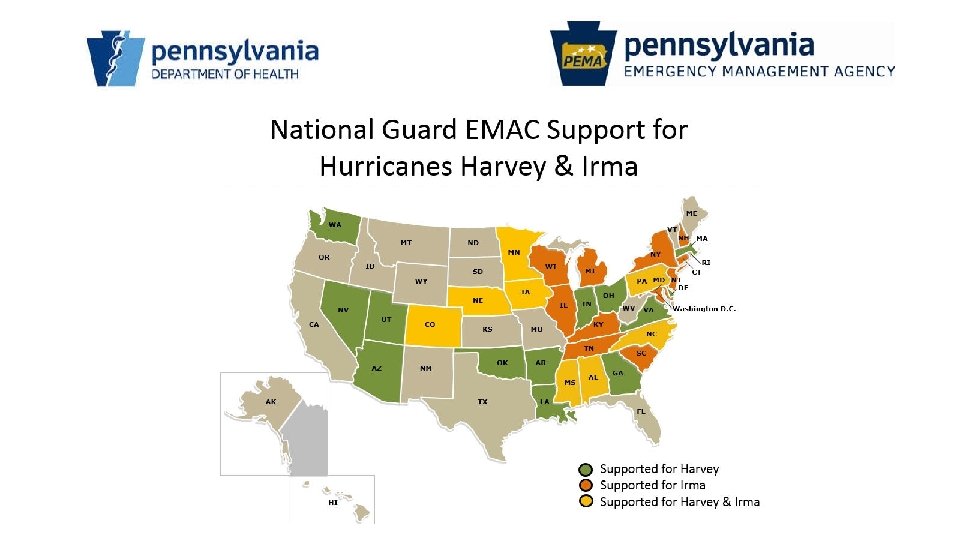
Hurricane Harvey Made landfall Friday morning August 26 th. Beginning on the morning of August 27 th Houston experienced 5 -6 days of hurricane force rains. • 60+ inches of rain fell in Houston, TX. • Later, 47 inches of rain fell in Beaumont, TX. Texas processed 126 EMAC requests for assistance. • 101 EMAC requests were fulfilled.

Hurricane Irma • Made landfall Sunday morning September 10 th. as a Category 3 storm. • The storm path shifted moving up the west coast of Florida. • Palm Beach County authorities rescued over 50 animals found tied to trees by residents who evacuated. • Miami-Dade County opened 44 shelters (many at capacity). Florida processed 101 EMAC requests for assistance. • 94 EMAC requests were fulfilled.

What is the difference between data and statistics? • Data is the raw information from which statistics are created. • Put in the reverse, statistics provide an interpretation and summary of data. Source: Data vs. Stats Intro; Georgia Tech Library, www. libguides. gatech. edu

Why Collect Data? • A starting point for planning. • Helps to determine needs / gaps. • Adds substance /credibility to plans and reports.

The Biggest Why: • Data and statistics may validate a need; influencing decisions. (ex. grant awards) • The numbers demonstrate the need.

What kind of data could I collect?

EOC Activations: • Requests for Assistance: • 911 calls and rate of calls; • Resource Requests • Utility Outages • Infrastructure Damage • Shelter Populations; • EOC Overhead Support • Staffing: • Office Supplies and Equipment • Support Services

Health and Medical Statistics: • • • Hospital staffing; Available beds; Equipment shortages; Medication quantities; Confirmed deaths; Unusual illness patterns; Patient demographics Dialysis Clinics affected; and Power requirements for durable medical equipment.
 • • Population (transient vs. permanent); Residences / Businesses")
Non – Emergent Data (Demographics) • • Population (transient vs. permanent); Residences / Businesses in vulnerable locations; Number of Fire / EMS / Police calls; Attendance at public events; College, university and public school populations; Vulnerable populations; Socio-Economic data; and Critical infrastructure status
; Specialty Beds (regular")
“Blue Sky” Data • • • Bed Counts (regular and surge); Specialty Beds (regular and surge); Staffing (regular and surge); Surgeries per day/year; ER visits per day/year; Decontamination Capabilities; Isolation Capabilities; Medication Inventory; and Surge equipment (ventilators, decontamination equipment)

How do I gather the data? • Crisis management/CAD/Common Operating Picture tools allow for information to be shared between local, county and state government. • Commercial software products that monitor social media to form situation alerts. • GIS mapping software can be used to visualize the location of power outages, resources etc. • Professional data acquisition services.

How else can I gather data? EM-DAT 3® : The International Disaster Database. • The United States Agency for International Development’s Office of Foreign Disaster Assistance (USAID has maintained EM-DAT, a worldwide database on disasters. • EM-DAT contains essential core data on the occurrence and impacts of more than 13, 000 natural and 7, 000 technological disasters dating from 1900 to the present. • For a disaster to be entered into the database: • 10 or more people reported killed; • 10 or more people reported affected; • Declaration of states of emergency; and • Calls for international assistance. 3. About EM-DAT: The International Database; (2013), Annual Disaster Statistical Review 2013 – The numbers and trends.
(3) specializing")
How else can I gather data? • Humanity Road is a 501 (C)(3) specializing in collecting and reporting information regarding people impacted by disasters. • They provide invaluable demographics and other pertinent information to federal, state, and local governments. • They try to provide public information so the public will know who to reach out to regarding disaster assistance. 2 www. humanityroad. org; Humanity Road is a 501( c )(3) volunteering to data mine for statistics during disasters.

Humanity Road After Hurricane Harvey Humanity Road conducted a special data mining effort in Houston, TX to identify urgent medical cases that required intervention. They identified 602 cases that included: • Dialysis patients; • Diabetics; • Heart patients; • Post-surgical patients; • Disabled and special needs patients; and • Children and newborn infants

We have our data. Now what can we do with it? • Include summarized data in situation reports. • Create visual displays of the data for briefings. • Use the data to determine response needs, develop plans, and identify next steps. • Save the data set to create a knowledgebase for future planning efforts.

Examples of collectable data These examples show the same data but they show it in different ways.

Examples of Collectable Data This data is being used as a preparedness tool to identify how many widgets are needed for a county for one week.

Examples of Collectable Data This combined table-graph shows the top 10 countries by number of reported disaster events in 2013. Source: About EM-DAT: The International Database; (2013), Annual Disaster Statistical Review.

Examples of Collectable Data The same data can be used to show different statistics: This graph shows the % of all vents within each DOH District This graph shows how many of each size vents are located within each DOH District

Examples of Collectable Data

How should I display my data? It’s good to use several methods of displaying data in a plan so that you can reach readers regardless of their “method” of learning.

How should I display my data? Adults grasp information in different ways: • Words • Pictures • Hands on… by doing the calculations themselves.

How should I display my data? For the adult who learns by words: The data can be written into a paragraph.

How should I display my data? For the adult who learns by pictures: Charts and graphs are pictorial representations of data that is otherwise hard to decipher. Charts: Represent a slice of the data at one particular point. Graphs: Represent 100% of the data.

How should I display my data? For the adult who learns by pictures: The data can be displayed in charts.

How Should I Display My Data? For the adult who learns by pictures: Resource Requests RRFs from Sunday 01/31/2024 …or graphs.

How Should I Display My Data? For the adult who learns by doing: Tables are a set of facts or figures systematically displayed. Usually displayed in columns.

How Should I Display My Data? For the adult who learns by doing: Tables provide the raw data and the learner can do the math.

How Data Changes Over Time • Burn Rate vs Population Change – • Burn Rate – • Are you actually using it? • Are you back-filling? • Populations – • Shelter Populations (Short Term) • Permanent Population Changes (Long Term) • What Type of Information Does That Data Provide?

How can I display data changes?

How can I display data changes?

How can I display data changes?

How can I display data changes?

Discussion: How does this data help me plan? • • • Cost per boxed meal / cost per pallet / cost per truckload; Dimensions of boxed meal / dimensions per pallet/ dimensions per truckload; Meals per pallet/ meals per truckload; Warehouse location to store boxed meals - refrigeration units, dollies, pallets, trucks, tables; Distribution locations; Housing and feeding staff/volunteers brought in to support the meal distribution effort; Security at warehouse and distribution sites; Meals for those with special dietary needs; Waste disposal; and How many meals are actually be served?

How does this data help me plan? • • Number of Hospitals in Impacted Area Displaced Beds Returned or Permanently Housed Patients 40 997 676 How long will our facility be out of service? Can our staff get here? Who will provide patient care to those in the area? Can we get patient care supplies and medications? Where will we put returning patients? Can our mutual aid partners assist us? Or are they affected? Federal assistance is available but it comes at a steep cost…

Validity of the data • Collect data over a span of several years. Ø This will identify averages and any outliers. • If you are not already collecting data, start now. Ø Go back through old records and gather the data. Ø Store it in a spreadsheet and add to it during future events. Ø Trends and patterns will emerge as datasets grow. Ø Use that data as a base for your planning efforts.

Validity of the data Natural disasters can be organized into five categories… 1. 2. 3. 4. 5. Biological; Geophysical; Hydrological; Meteorological; and Climatological

A Review • • Data is the information to be collected. Start collecting data now. Go back through old records. Statistics is what you do with the data. A table shows the raw data. You can work with the data to create graphs and charts. Look for trends and averages. Make sure your data is validated. Always use several ways to display data in your reports. Keep you reports high-level. You can share detailed raw data later if needed.

Any Questions ? Jonathan Anschutz Director Bureau of External Operations Pennsylvania Emergency Management Agency janschutz@pa. gov 717 -651 -2138 www. pema. state. pa. gov Susan Singer Public Health Program Administrator Bureau of Public Health Preparedness Pennsylvania Department of Health susinger@pa. gov 717 -736 -7305 www. padoh. state. pa. gov
- Slides: 47