What Does the Throx Say A Throx Demand


 Economic Order Quantity (EOQ)")
![2014 Demand Forecast ● Double exponential smoothing with seasonality ● Ft, t+k=St+k[Lt+k. Tt] Seasonality](https://slidetodoc.com/presentation_image_h/c9a19cf73f7ff4d1411e1a2f08e3a341/image-4.jpg "2014 Demand Forecast ● Double exponential smoothing with seasonality ● Ft, t+k=St+k[Lt+k. Tt] Seasonality")
 Q 5: 6, 685 o Q 6: 10,")

 ● Increase ROP from 1, 400 units to 4, 837 units")
 ● Optimal CSL = 97. 6% ○ Confidence of 97. 6%")
 • Equation chosen due to variation in lead times • SD,")
 • Decrease Q from 2, 800 units to 1, 668")
 Cost per Unit, $/unit EOQ Values 25. 00 1, 668")


![Forecast Calculations • Forecast: Ft, t+k = St+k[Lt+k. Tt] • Level: Lt = 8149](https://slidetodoc.com/presentation_image_h/c9a19cf73f7ff4d1411e1a2f08e3a341/image-18.jpg "Forecast Calculations • Forecast: Ft, t+k = St+k[Lt+k. Tt] • Level: Lt = 8149")

= 669(3. 111)=")

 • (. 25)(170) = 42. 5 Truck (500 units)")


- Slides: 25
What Does the Throx Say? A Throx Demand Fulfillment Strategy Caleigh, Alex F. , Simone, Greg H. , Greg L.
Throx Overview ● Often unable to meet demand o Variability in lead times o Variability in demand ● Highest costs are due to the proportion of transportation mode ● Throx needs new strategy to increase profits
Key Indicators • • 2014 Demand Forecast Reorder Point (ROP) Economic Order Quantity (EOQ) Transportation Mode
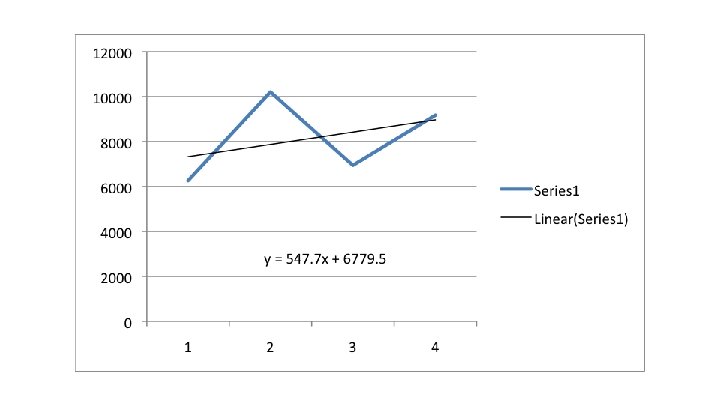
2014 Demand Forecast ● Double exponential smoothing with seasonality ● Ft, t+k=St+k[Lt+k. Tt] Seasonality factor determined from analysis of forecast ○ Kept Level and Trend constant ■ Level- Average demand in 2013 (8, 149) ■ Trend- Trend line in graph (548) ○
2014 Demand Forecast • Forecast (Quarters) Q 5: 6, 685 o Q 6: 10, 895 o Q 7: 7, 413 o Q 8: 9, 794 o • Forecast was compared to projected demand from Vensim Reader simulation o Using accuracy and bias measures
2014 Demand Forecast ● There is a 34% difference between projected demand forecast ● Throx has been overforecasting by approximately 1, 417 units
Reorder Point (ROP) ● Increase ROP from 1, 400 units to 4, 837 units Meet demand more effectively ○ Increasing responsiveness ○ Ordering more frequently ○
Reorder Point (ROP) ● Optimal CSL = 97. 6% ○ Confidence of 97. 6% in completing a replenishment cycle without a stock out ● Corresponding Z-score of 1. 99 ● Safety inventory (SI) = 2, 756. 15
Reorder Point (ROP) • Equation chosen due to variation in lead times • SD, L = 1, 385
Economic Order Quantity (EOQ) • Decrease Q from 2, 800 units to 1, 668 • Chose cost of $25. 00/unit • Annual demand (D) = 34, 787 • Unit order cost = $500 • Holding cost = 0. 5 Order Quantity, units Cost per Unit, $/unit 0 to 9, 999 25. 00 10, 000 to 14, 999 23. 75 15, 000 or more 22. 50
Economic Order Quantity (EOQ) Cost per Unit, $/unit EOQ Values 25. 00 1, 668 23. 75 10, 000 22. 50 15, 000 Cost/Unit Holding Cost Materials Cost Order Cost Total Cost 25. 00 10, 425 869, 675. 00 10, 427. 76 890, 528 23. 75 59, 375 826, 191. 25 1, 739. 35 887, 306 22. 50 84, 375 782, 707. 50 1, 159. 57 868, 242
Transportation Mode • • • Current utilizing both truck and intermodal transportation o Total costs = $28, 677 per order Implement only intermodal transportation Saves approximately $16, 150 in transportation costs per order o Total costs = $12, 527 per order
Transportation Mode
Performance Evaluation • • • Decreased EOQ from 2, 800 to 1, 668 units Raised ROP from 1, 400 to 4, 837 units Transportation mode changed to all intermodal Throx current projected profit = $371, 881 Projected profit based on new strategy = $480, 235 o 30 % increase in profit versus current projected profit o 5. 7% increase in profit from 2013
What Does the Throx Say? The outlook for Throx is not as bleak as we originally thought.
Supplemental Slides Calculations
Forecast Calculations • Forecast: Ft, t+k = St+k[Lt+k. Tt] • Level: Lt = 8149 • Lt = Average demand on graph • Trend: Tt=548 • Tt = Slope of trend line on graph • Seasonality: S 5=0. 77, S 6=1. 25, S 7=0. 85, S 8=1. 13 • St = Quarter/Average quarterly demand
CSL Calculation
ROP Calculations Z = 1. 99 SD, L= 1, 385 DL= D(L)= 669(3. 111)= 2, 081. 33 ROP = 1. 99(1, 385)+2, 081. 33 = 4, 838
Transportation Calculations Intermodal Only • 1. 45/5. 78 =. 2508 Truck Only • 1. 10/5. 78 =. 19 • (. 25)(669) = 167. 25 • (167)(2. 5)(. 5) = $208. 75 per week • 208. 75(13)= $2, 713. 75 per quarter • 2, 713. 75(4)= $10, 855 per year • 10, 855+669(2. 5)=$12, 527 • (19)(669) = 127. 3 • (127. 3)(4. 5)(. 4) = $229. 17 • (229. 17)(13) = $2, 979. 25 • (2, 979. 25)(4) = $11, 917 • 11, 917+669(4. 5) = $14, 927. 50
Transportation Calculations Intermodal (169 units) • (. 25)(170) = 42. 5 Truck (500 units) • (. 19)(500)=. 95 • (42. 5)(. 5)=53. 12 per week • (53. 125)(13)=690. 62 per quarter • (690)(4)= 2, 762. 5 per year • (2, 762. 5)+170(. 5) = 3, 187. 5 • (95)(4. 5)(. 4)=171 per week • (171)(13)=2, 223 per quarter • (2, 223)(4)=8, 892 per year • (8, 892)+500(. 4)= 9, 092 Total = $12, 279. 50
Vensim Comparison - Profit BEFORE AFTER
Vensim Comparison - Costs BEFORE AFTER
Vensim Comparison – PA Measures BEFORE AFTER