
What do you need to know about PSP
What do you need to know about PSP and how would it impact late outcomes of absorb Prof. Corrado Tamburino, MD, Ph. D Cardiology, Ferrarotto-Policlinico Hospital, University of Catania, Italy
I, Corrado Tamburino, MD Ph. D I have the following financial relationships Speaker’s Bureau/Advisory Board: Abbott, Medtronic Biosensors Symetis
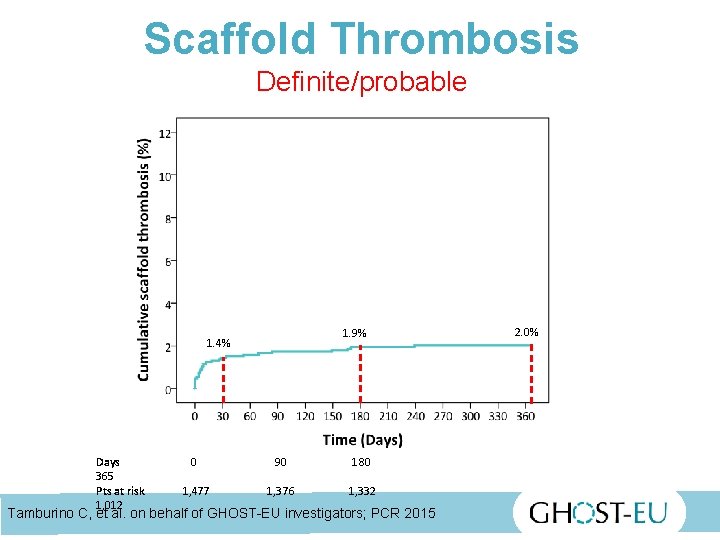
Scaffold Thrombosis Definite/probable 1. 9% 1. 4% Days 365 Pts at risk 1, 012 0 90 180 1, 477 1, 376 1, 332 Tamburino C, et al. on behalf of GHOST-EU investigators; PCR 2015 19/02/2017 2. 0% 3 3
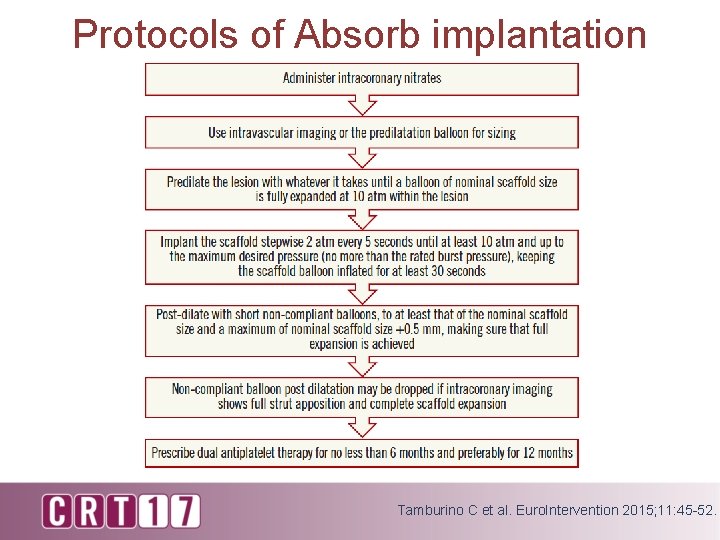
Protocols of Absorb implantation Tamburino C et al. Euro. Intervention 2015; 11: 45 -52.
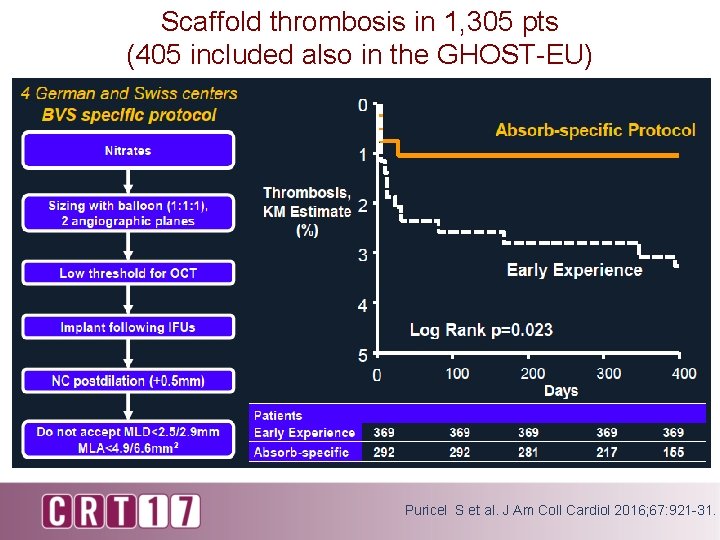
Scaffold thrombosis in 1, 305 pts (405 included also in the GHOST-EU) Puricel S et al. J Am Coll Cardiol 2016; 67: 921 -31.
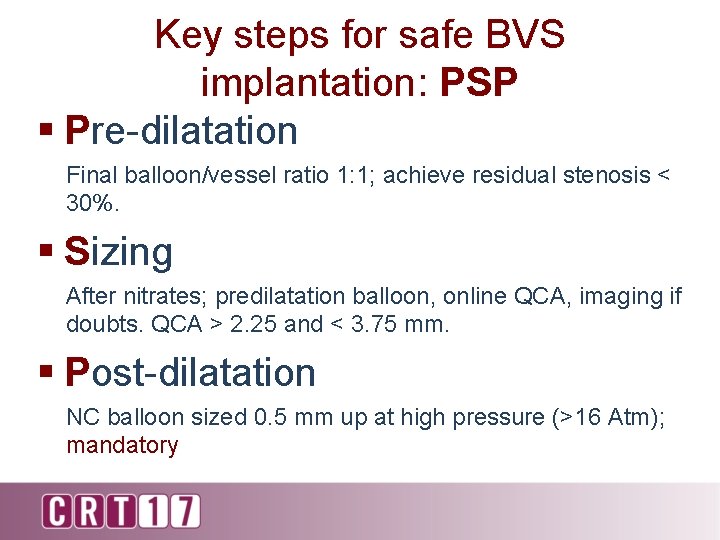
Key steps for safe BVS implantation: PSP § Pre-dilatation Final balloon/vessel ratio 1: 1; achieve residual stenosis < 30%. § Sizing After nitrates; predilatation balloon, online QCA, imaging if doubts. QCA > 2. 25 and < 3. 75 mm. § Post-dilatation NC balloon sized 0. 5 mm up at high pressure (>16 Atm); mandatory
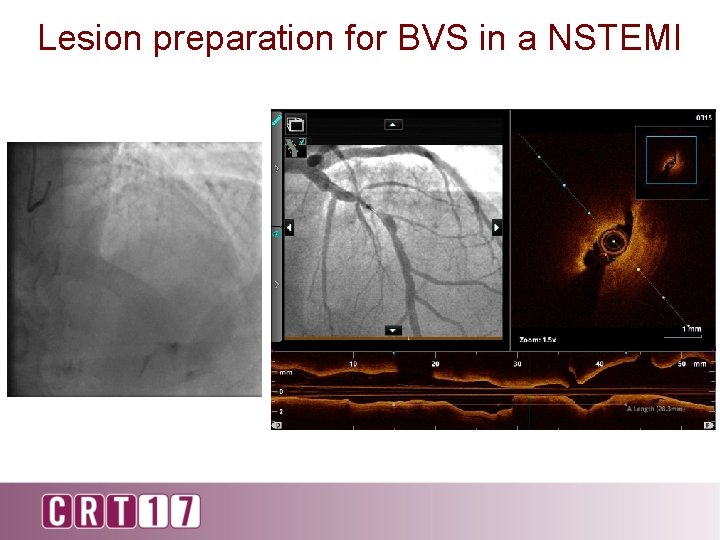
Lesion preparation for BVS in a NSTEMI
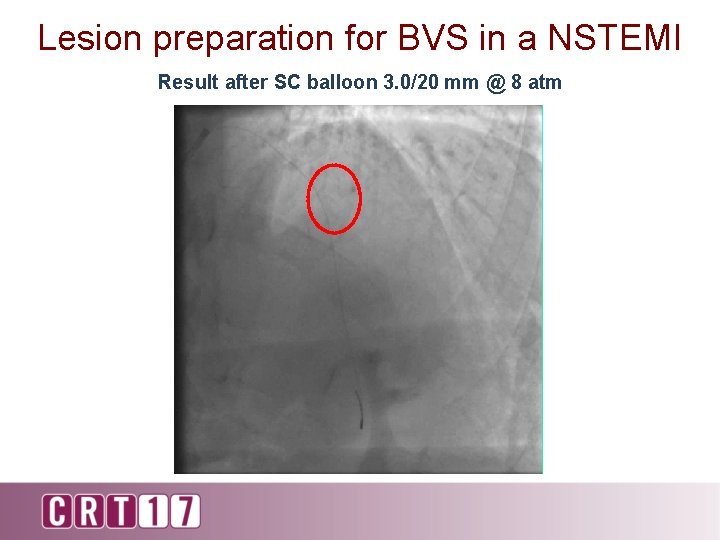
Lesion preparation for BVS in a NSTEMI Result after SC balloon 3. 0/20 mm @ 8 atm
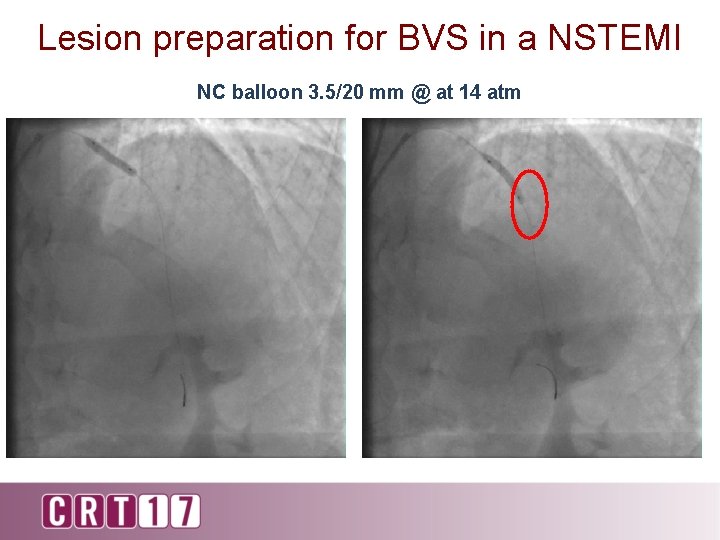
Lesion preparation for BVS in a NSTEMI NC balloon 3. 5/20 mm @ at 14 atm
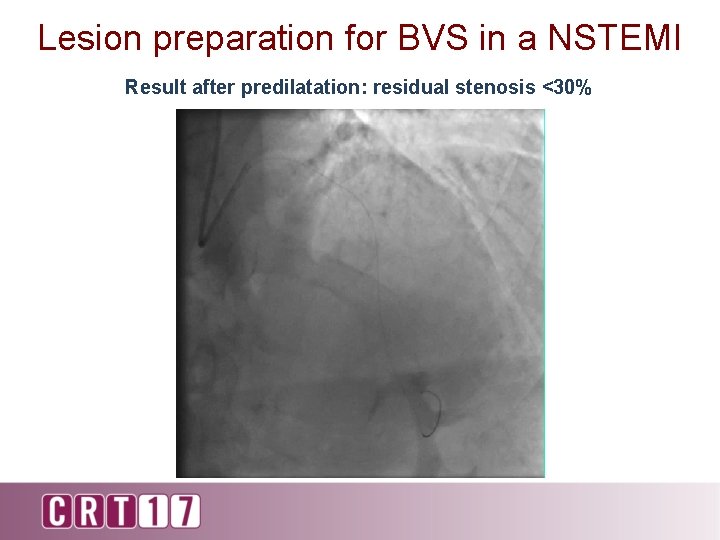
Lesion preparation for BVS in a NSTEMI Result after predilatation: residual stenosis <30%
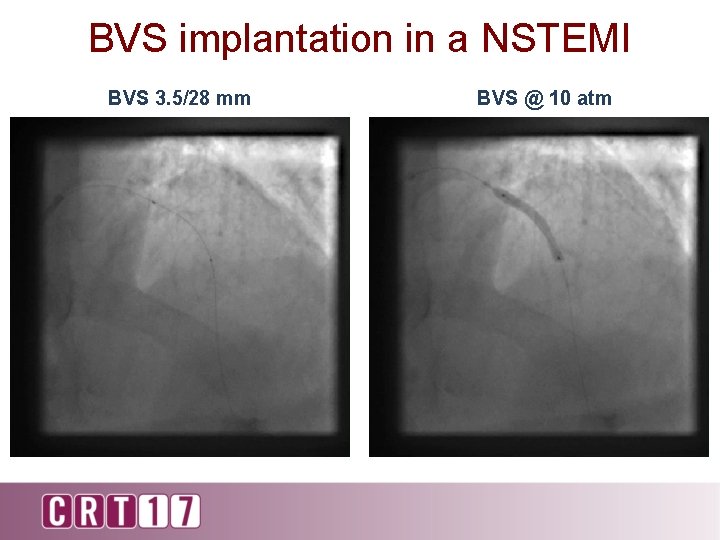
BVS implantation in a NSTEMI BVS 3. 5/28 mm BVS @ 10 atm
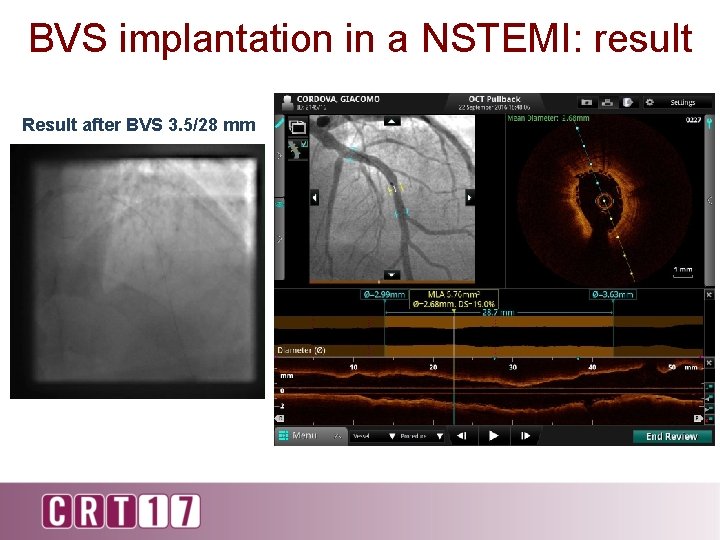
BVS implantation in a NSTEMI: result Result after BVS 3. 5/28 mm
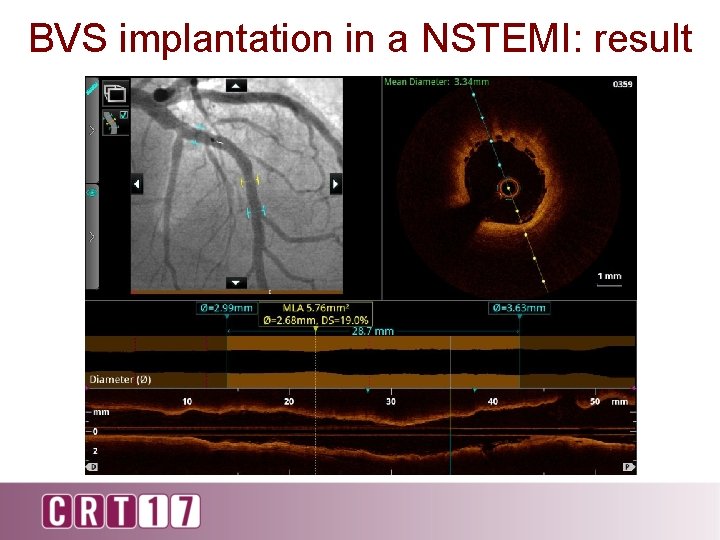
BVS implantation in a NSTEMI: result
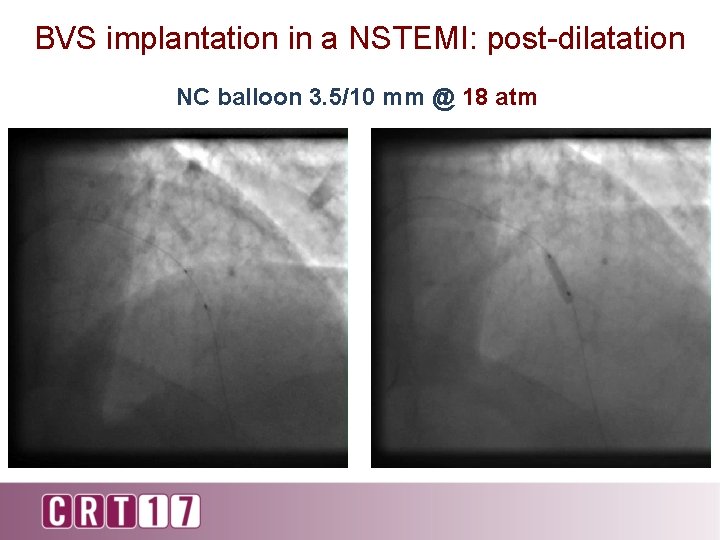
BVS implantation in a NSTEMI: post-dilatation NC balloon 3. 5/10 mm @ 18 atm
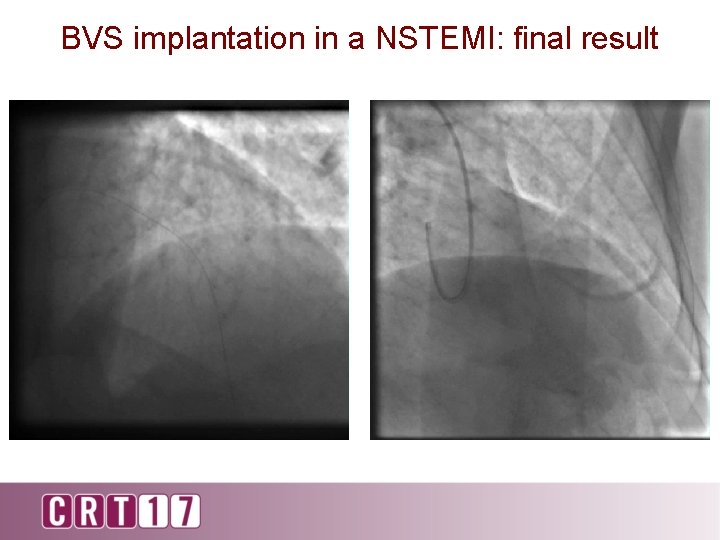
BVS implantation in a NSTEMI: final result
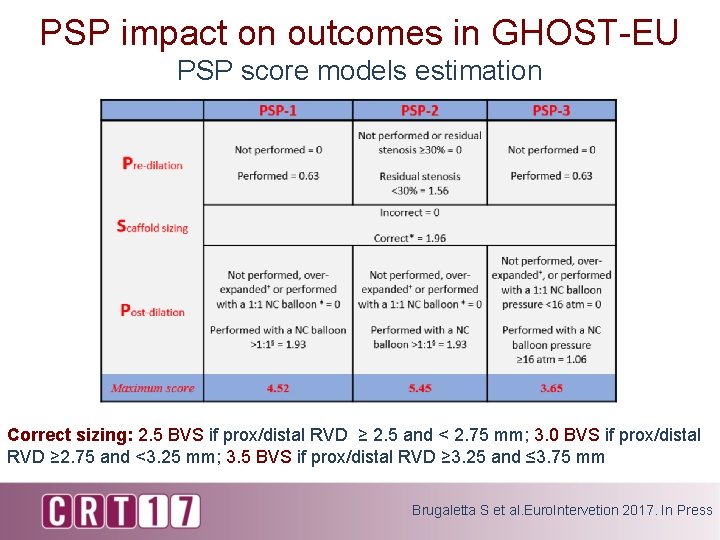
PSP impact on outcomes in GHOST-EU PSP score models estimation Correct sizing: 2. 5 BVS if prox/distal RVD ≥ 2. 5 and < 2. 75 mm; 3. 0 BVS if prox/distal RVD ≥ 2. 75 and <3. 25 mm; 3. 5 BVS if prox/distal RVD ≥ 3. 25 and ≤ 3. 75 mm Brugaletta S et al. Euro. Intervetion 2017. In Press
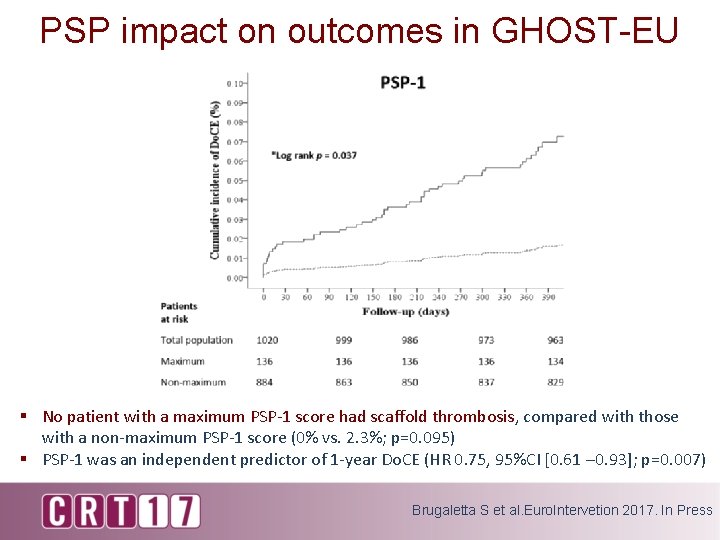
PSP impact on outcomes in GHOST-EU § No patient with a maximum PSP-1 score had scaffold thrombosis, compared with those with a non-maximum PSP-1 score (0% vs. 2. 3%; p=0. 095) § PSP-1 was an independent predictor of 1 -year Do. CE (HR 0. 75, 95%CI [0. 61 – 0. 93]; p=0. 007) Brugaletta S et al. Euro. Intervetion 2017. In Press
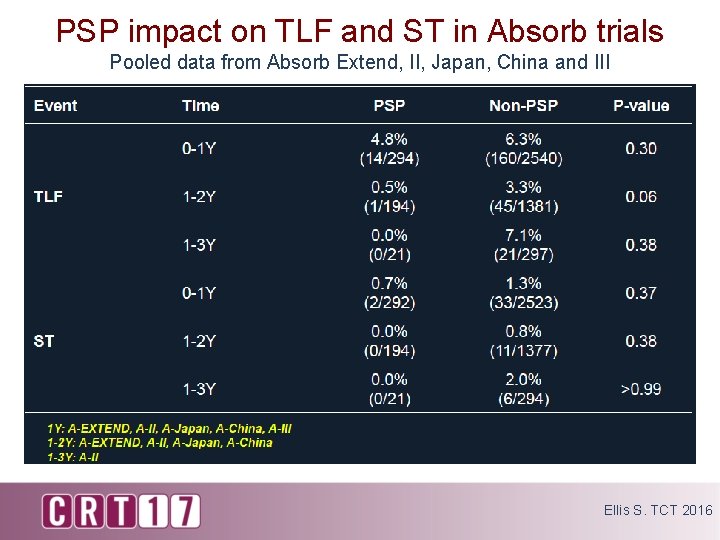
PSP impact on TLF and ST in Absorb trials Pooled data from Absorb Extend, II, Japan, China and III Ellis S. TCT 2016
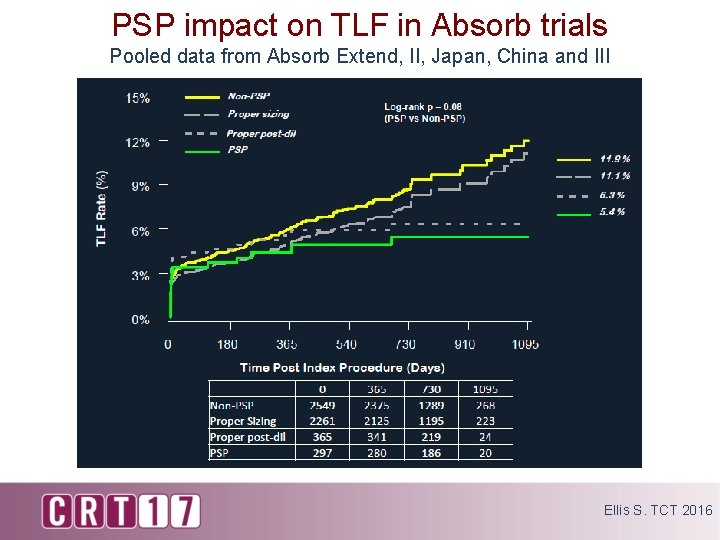
PSP impact on TLF in Absorb trials Pooled data from Absorb Extend, II, Japan, China and III Ellis S. TCT 2016
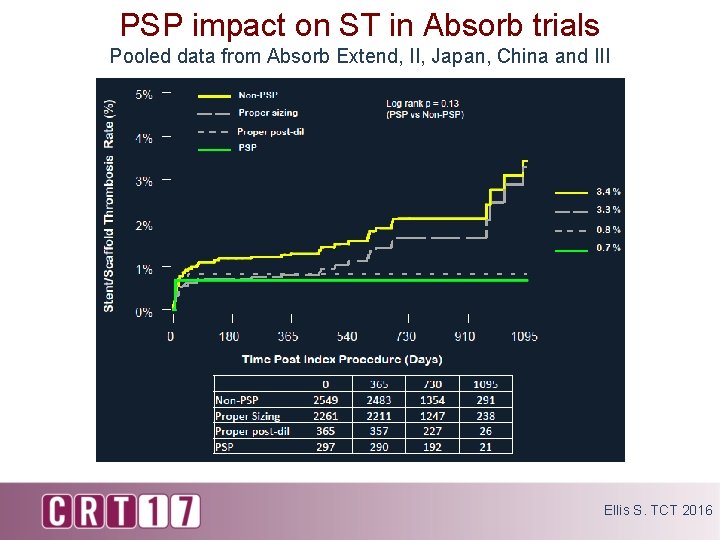
PSP impact on ST in Absorb trials Pooled data from Absorb Extend, II, Japan, China and III Ellis S. TCT 2016
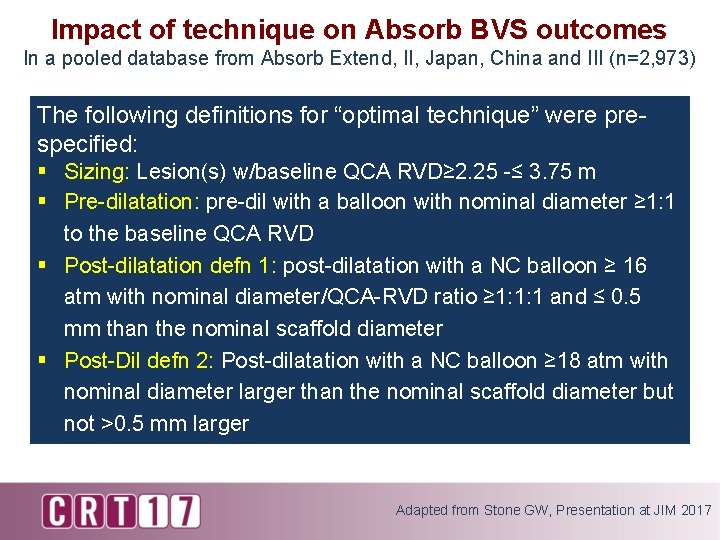
Impact of technique on Absorb BVS outcomes In a pooled database from Absorb Extend, II, Japan, China and III (n=2, 973) The following definitions for “optimal technique” were prespecified: § Sizing: Lesion(s) w/baseline QCA RVD≥ 2. 25 -≤ 3. 75 m § Pre-dilatation: pre-dil with a balloon with nominal diameter ≥ 1: 1 to the baseline QCA RVD § Post-dilatation defn 1: post-dilatation with a NC balloon ≥ 16 atm with nominal diameter/QCA-RVD ratio ≥ 1: 1: 1 and ≤ 0. 5 mm than the nominal scaffold diameter § Post-Dil defn 2: Post-dilatation with a NC balloon ≥ 18 atm with nominal diameter larger than the nominal scaffold diameter but not >0. 5 mm larger Adapted from Stone GW, Presentation at JIM 2017
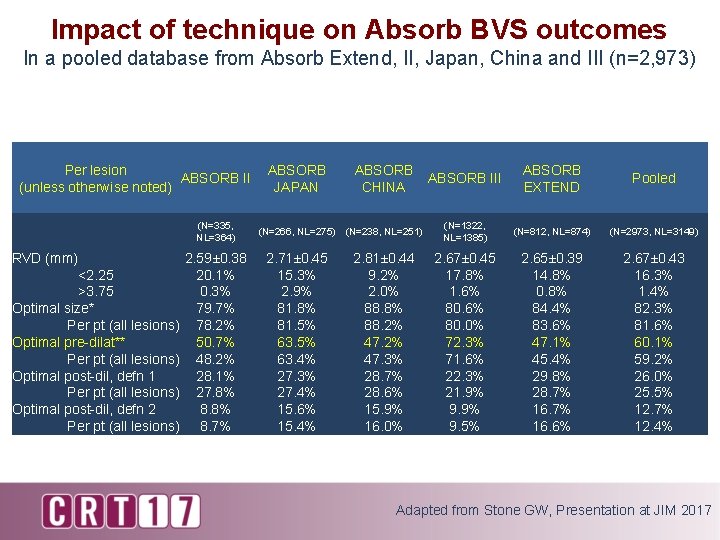
Impact of technique on Absorb BVS outcomes In a pooled database from Absorb Extend, II, Japan, China and III (n=2, 973) Per lesion ABSORB II (unless otherwise noted) (N=335, NL=364) RVD (mm) 2. 59± 0. 38 <2. 25 20. 1% >3. 75 0. 3% Optimal size* 79. 7% Per pt (all lesions) 78. 2% Optimal pre-dilat** 50. 7% Per pt (all lesions) 48. 2% Optimal post-dil, defn 1 28. 1% Per pt (all lesions) 27. 8% Optimal post-dil, defn 2 8. 8% Per pt (all lesions) 8. 7% ABSORB JAPAN ABSORB CHINA (N=266, NL=275) (N=238, NL=251) 2. 71± 0. 45 15. 3% 2. 9% 81. 8% 81. 5% 63. 4% 27. 3% 27. 4% 15. 6% 15. 4% 2. 81± 0. 44 9. 2% 2. 0% 88. 8% 88. 2% 47. 3% 28. 7% 28. 6% 15. 9% 16. 0% ABSORB III ABSORB EXTEND Pooled (N=1322, NL=1385) (N=812, NL=874) (N=2973, NL=3149) 2. 67± 0. 45 17. 8% 1. 6% 80. 0% 72. 3% 71. 6% 22. 3% 21. 9% 9. 5% 2. 65± 0. 39 14. 8% 0. 8% 84. 4% 83. 6% 47. 1% 45. 4% 29. 8% 28. 7% 16. 6% 2. 67± 0. 43 16. 3% 1. 4% 82. 3% 81. 6% 60. 1% 59. 2% 26. 0% 25. 5% 12. 7% 12. 4% Adapted from Stone GW, Presentation at JIM 2017
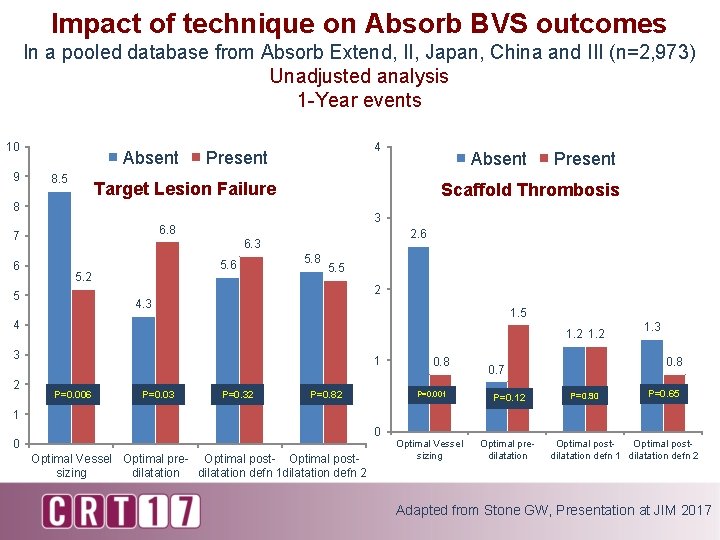
Impact of technique on Absorb BVS outcomes In a pooled database from Absorb Extend, II, Japan, China and III (n=2, 973) Unadjusted analysis 1 -Year events 10 9 Absent 8. 5 4 Present Target Lesion Failure 3 6. 8 7 2. 6 6. 3 5. 6 5. 2 5 5. 8 5. 5 2 4. 3 1. 5 4 1. 2 3 2 Present Scaffold Thrombosis 8 6 Absent 1 P=0. 006 P=0. 03 P=0. 32 P=0. 82 0. 8 0. 7 P=0. 001 P=0. 12 Optimal Vessel sizing Optimal predilatation 1. 3 P=0. 90 P=0. 65 1 0 0 Optimal Vessel Optimal pre- Optimal postsizing dilatation defn 1 dilatation defn 2 Optimal postdilatation defn 1 dilatation defn 2 Adapted from Stone GW, Presentation at JIM 2017
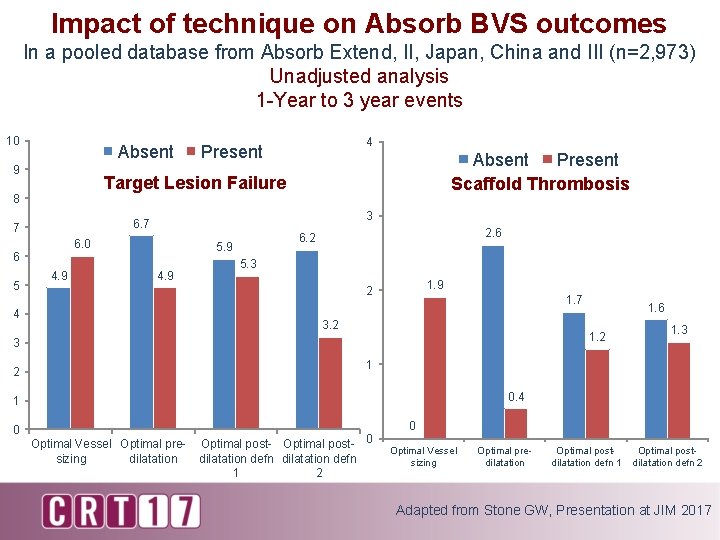
Impact of technique on Absorb BVS outcomes In a pooled database from Absorb Extend, II, Japan, China and III (n=2, 973) Unadjusted analysis 1 -Year to 3 year events 10 Absent 9 Absent Present Scaffold Thrombosis Target Lesion Failure 8 3 6. 7 7 6. 0 6 5 4 Present 4. 9 2. 6 6. 2 5. 9 5. 3 1. 9 2 4 1. 7 3. 2 1. 6 1. 2 3 1 2 0. 4 1 0 Optimal Vessel Optimal presizing dilatation Optimal post- 0 dilatation defn 1 2 0 Optimal Vessel sizing Optimal predilatation Optimal postdilatation defn 1 Optimal postdilatation defn 2 Adapted from Stone GW, Presentation at JIM 2017
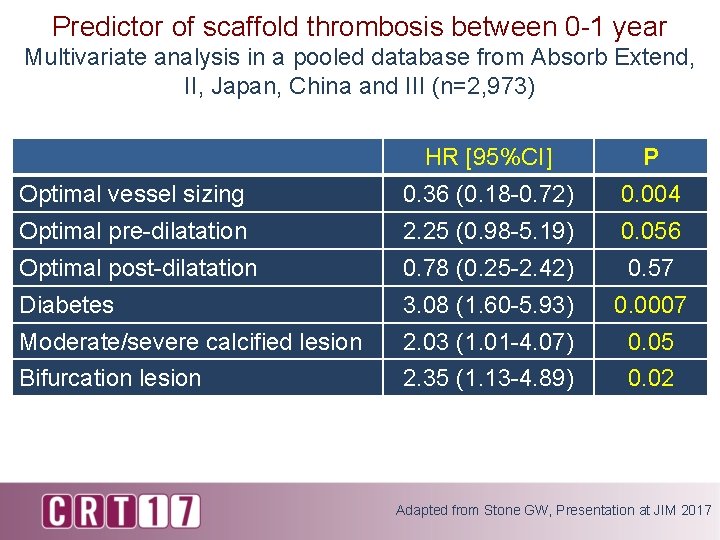
Predictor of scaffold thrombosis between 0 -1 year Multivariate analysis in a pooled database from Absorb Extend, II, Japan, China and III (n=2, 973) HR [95%CI] P Optimal vessel sizing 0. 36 (0. 18 -0. 72) 0. 004 Optimal pre-dilatation 2. 25 (0. 98 -5. 19) 0. 056 Optimal post-dilatation 0. 78 (0. 25 -2. 42) 0. 57 Diabetes 3. 08 (1. 60 -5. 93) 0. 0007 Moderate/severe calcified lesion 2. 03 (1. 01 -4. 07) 0. 05 Bifurcation lesion 2. 35 (1. 13 -4. 89) 0. 02 Adapted from Stone GW, Presentation at JIM 2017
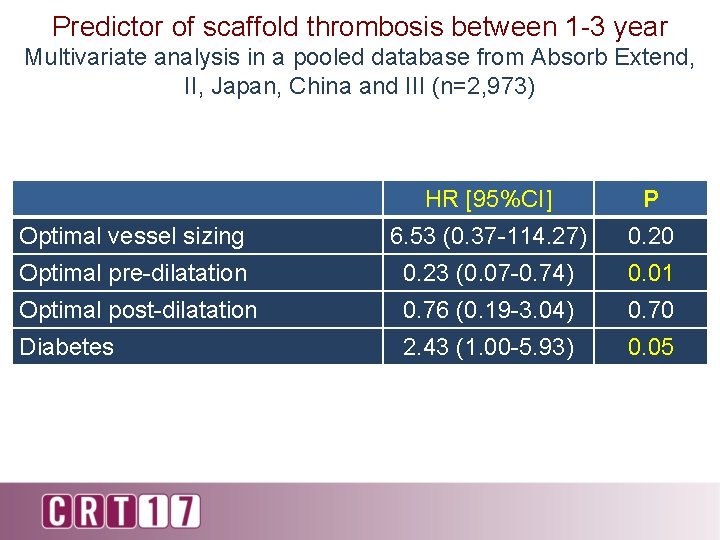
Predictor of scaffold thrombosis between 1 -3 year Multivariate analysis in a pooled database from Absorb Extend, II, Japan, China and III (n=2, 973) HR [95%CI] P Optimal vessel sizing 6. 53 (0. 37 -114. 27) 0. 20 Optimal pre-dilatation 0. 23 (0. 07 -0. 74) 0. 01 Optimal post-dilatation 0. 76 (0. 19 -3. 04) 0. 70 Diabetes 2. 43 (1. 00 -5. 93) 0. 05
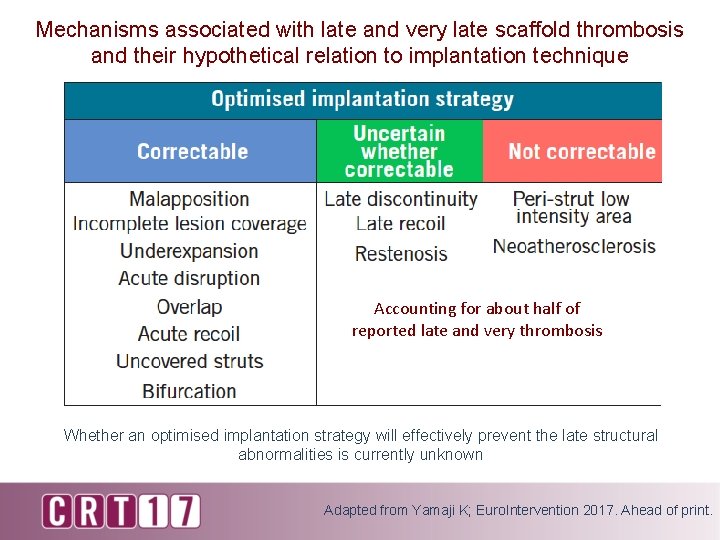
Mechanisms associated with late and very late scaffold thrombosis and their hypothetical relation to implantation technique Accounting for about half of reported late and very thrombosis Whether an optimised implantation strategy will effectively prevent the late structural abnormalities is currently unknown Adapted from Yamaji K; Euro. Intervention 2017. Ahead of print.
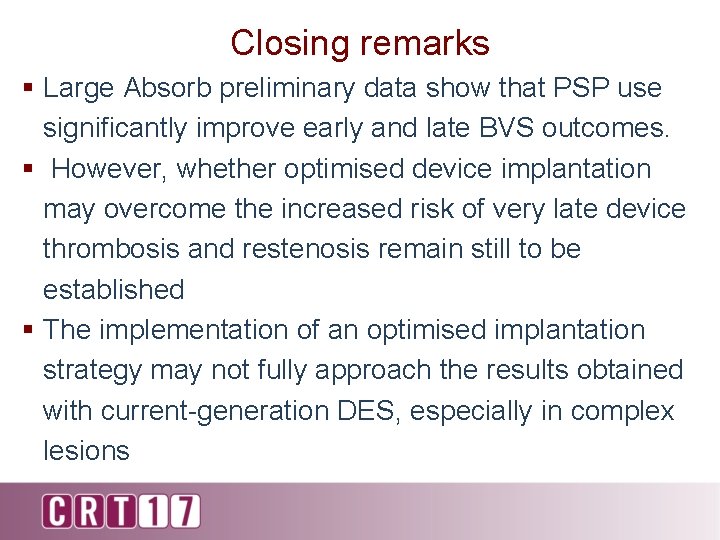
Closing remarks § Large Absorb preliminary data show that PSP use significantly improve early and late BVS outcomes. § However, whether optimised device implantation may overcome the increased risk of very late device thrombosis and restenosis remain still to be established § The implementation of an optimised implantation strategy may not fully approach the results obtained with current-generation DES, especially in complex lesions
- Slides: 28