What controls Organic C preservation Influence of Production
 on % C org) Sediment")


 Hedges and Keil, 1995 Same data,")


 Sulfate reduction and oxic respiration in marine sediments: implications for organic carbon")


 NO 3 - Mn+2 Wilson - turbidite Turbidite No turbidite")
 is readily")


 25 -50 %")

 w = sediment burial rate (cm/yr)")

 O 2 sites.")
 > RC(Mex) At 1000 m, RC(WA) ~ RC(Mex) Devol and")
 Devol")

 Hedges et al. , 1999")
 So OET increases offshore Hedges")


 on % C org) Sediment")
- Slides: 42
What controls Organic C preservation? (Influence of Production (Flux) on % C org) Sediment accumulation rate (Bottom water oxygen concentration) “not bottom water oxygen concentration” (production; grain size) Turbidite data (a clear role for O 2) Organic C sorption onto mineral surfaces Oxygen exposure time A hard problem - many of the proposed controls are interdependent, or co-vary
Focus on continental margins – that’s where the carbon is. >1% Premuzic et al. - % C org in surficial sediments
Hedges and Keil, 1995 90% of burial on deltas, shelves, & upper slope
The role of sedimentation rate. sed rate 1: 1 slope “built in”; slope > 1 suggests role Muller & Suess, 1979 Calvert, 1987
Correlation driven by sed rate? % C org. vs. sed rate not too impressive.
Burial Efficiency = burial / (burial + remineralization) Hedges and Keil, 1995 Same data, linear B. E. axis
Low O 2 Very low Weird plot; but no sign of oxygen control
But Hedges and Keil 1995 conclude – No obvious oxygen control Henrichs and Reeburgh, 1987 Higher burial efficiency in anoxic settings (not just low O 2, but no O 2)
productivity What about productivity? Rough correspondence between high % C org and primary production. A carbon flux control on carbon preservation, or is the correlation driven by other factors?
High % C org in upwelling regions – more than a coincidence. But Peru margin is low O 2 as well as high C flux. “Carbon flux (productivity) vs. bottom water oxygen” Calvert, 1987
Oxygen not the primary control; observed O 2: Corg relationships often due to particle properties (e. g. , grain size) that are correlated with O 2. Calvert, 1987
Sites with monsoonal upwelling and low-O 2 bottom water
No convincing C org: O 2 relationship But all of these sites have relatively low bottom water O 2, and many of the %C values are very high. Are these good sites to generalize from?
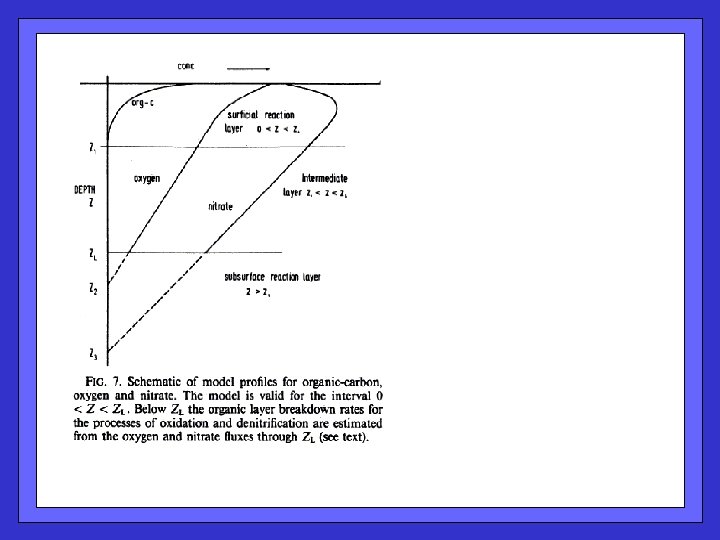
Canfield (1989) Sulfate reduction and oxic respiration in marine sediments: implications for organic carbon preservation in euxinic environments ~ 10 cm / ky Canfield Compare rates of sulfate reduction and oxic respiration, to see whether oxygen is “special”. O 2 consumption rate vs. sed rate. Sulfate reduction rate vs. sed rate. How “normal” are these “normal marine sediments? ”
Convert sulfate reduction and oxic respiration rates to organic C oxidation rates. Offset at low sed rate due to near-total C org oxidation by O 2. (the good stuff is gone) No obvious offset between SR and O 2 resp at high sed rate / oxidation rate Canfield, 1989
Canfield, 1989 Just compare integrated organic C oxidation rates between “normal marine” sediments, and euxinic and semi-euxinic sites (anoxic & near-anoxic). Again, no obvious offset – anaerobic decomposition not inherently slower
O 2 (% sat) NO 3 - Mn+2 Wilson - turbidite Turbidite No turbidite Wilson et al. 1985 – turbidite evidence for the importance of oxygen
“Burn-down” into a turbidite Organic C that had been buried (and preserved) is readily decomposed in the presence of porewater oxygen – O 2 matters.
Thomson et al. 1998
Decreases in percent C org and # pollen grains, and selective preservation of resistant amino acids. Hedges and Keil, 1995
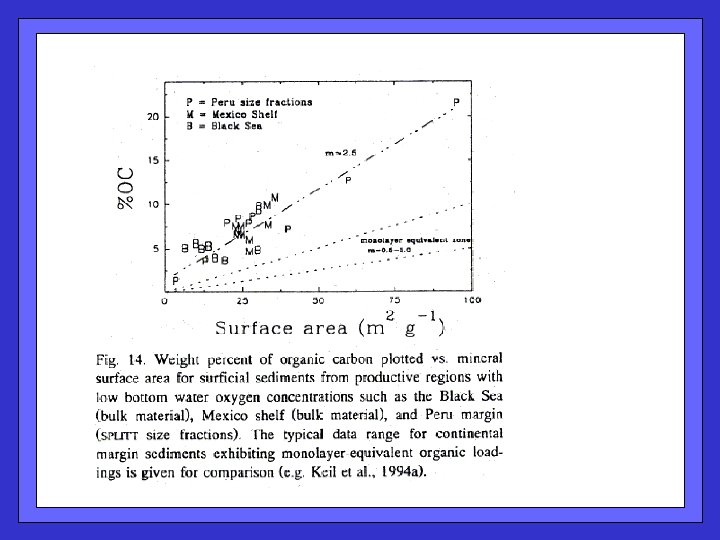
Organic C protection by adsorption onto mineral grains: Surface area control - C org concentrations consistent with a “monolayer equivalent” OM coating of mineral surfaces Mayer (1994)
C org concentrations decrease downcore, evolving toward the “monolayer equivalent” OM coating predicted based on previous figure Mayer (1994)
The shelf sediment C org / SA relationship seems global
But different environments seem to yield different slopes: Lower in deltas and abyssal sediments, higher in highproductivity / lowoxygen regions Hedges and Keil, 1995
Washington margin – OC/SA constant (so change in %C at this site doesn’t reflect evolution toward monolayer equivalent. (paleoceanography)
Desorbed organic matter is quite reactive (implying protection by mineral surfaces) 25 -50 % could be desorbed 70 – 95 % of this, decomposed
O 2 exposure time Can oxygen exposure time explain the observed range of preservation behaviors?
x. E = O 2 penetration depth (cm) w = sediment burial rate (cm/yr) O 2 exposure time (yr) = x. E / w Note – particle mixing doesn’t alter average OET
Empirical – no particular mechanism proposed. Hartnett et al. , 1998
Comparison of low O 2 and high(er) O 2 sites.
At 100 m, RC(WA) > RC(Mex) At 1000 m, RC(WA) ~ RC(Mex) Devol and Hartnett, 2001
Different attenuation of organic C sinking flux (in response to deep-water oxygen? ) Devol and Hartnett, 2001
Sediment trap data match flux predictions based on benthic remineralization and burial.
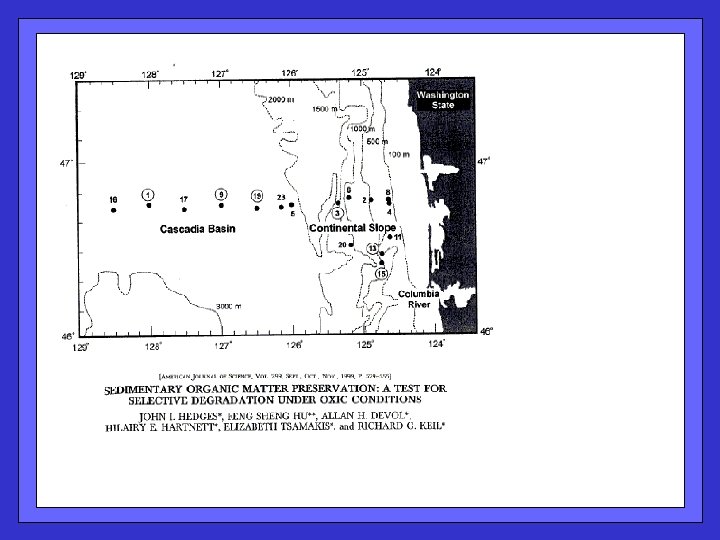
Deeper oxygen penetration farther offshore (in deeper water) Hedges et al. , 1999
And lower sedimentation rates farther offshore (in deeper water) So OET increases offshore Hedges et al. , 1999
Percent organic C and the Organic C / Surface Area ratio decrease moving offshore (OC/SA not constant) Hedges et al. , 1999
Amino-acid based “degradation indicators” increase moving offshore Hedges et al. , 1999
What controls Organic C preservation? (Influence of Production (Flux) on % C org) Sediment accumulation rate (Bottom water oxygen concentration) “not bottom water oxygen concentration” (production; grain size) Turbidite data (a clear role for O 2) Organic C sorption onto mineral surfaces Oxygen exposure time A hard problem - many of the proposed controls are interdependent, or co-vary