What are population pyramids In stage 2 of


 population pyramid Narrow top- Few elderly people so a lower life expectancy")
- Slides: 15
What are population pyramids? In stage 2 of the DTM the Birth rate is high True HIC’s are in stages 42 and 53 of the DTM False HIC’s have low Birth rates and low death rates True Natural population growth is fastest in stage 24 and 35 of the DTM False NEE’s have rapidly growing populations because death rates fall True STRETCH Change the highlighted word or phrase to make the statement correct
Direct Vocabulary Instruction Population pyramid is a graphical illustration that shows the distribution of various age groups in a population
Learning aim: To investigate population structure ‘so that you can explain the reasons for changes over time • I can identify key features of population pyramids • I can explain how population pyramids change as a country develops • I can compare and explain differences between population pyramids for HIC and LIC countries
Big picture India Japan Birth rate Life expectancy India 18/1000 68 Japan 7. 5/1000 84 Japan is a HIC. It has a few younger people (low birth rate) and many older people. (long life expectancy) India is an NEE. It has many younger people (high birth rate) and less older people (lower life expectancy)
Population structure for Mexico in 1980 1. Match the heads to the tails then add the labels to the correct parts of your diagram Wide base Narrow top Steeply sloping sides Dependent population Working population Males aged 20 -24 Females aged 55 -59 Few elderly people so a lower life expectancy Younger or older than the working population 3 million people in this age group 0. 8 million people in this age group A high number of babies so a high birth rate Work, pay tax and support the young and old Less people in the next age group so a high death rate
Narrow top- Few elderly people so a lower life expectancy Females aged 55 -59 – 0. 8 million people in this age group Steeply sloping sides - Less people in the next age group so a high death rate Working population - Work, pay tax and support the young and old Males aged 20 -24 3 million people in this age group Dependent population Younger or older than the working population Wide base - A high number of babies so a high birth rate
Population pyramids change shape as a country develops and birth rates, death rates and life expectancy change. LIC NEE HIC 1. How does the proportion of people aged under 15 changes through stage 1 to 5? 2. How does the proportion of people aged over 65 changes through stage 1 to 5? 3. Which stage is India based on its pyramid shape? 4. Which stage is Japan based on its pyramid shape? HIC
Japans birth rate is low for many reasons The average of marriage in Japan is 30 and less people are actually getting married nowadays. More and more women are following careers rather than starting families. There also less younger people to have children in the first place. Contraception is widely used. Japan – An ageing population Japans life expectancy is high for many reasons Japanese people eat a healthy diet, low in fat and salt. Most people have a good quality of life and standard of living so live comfortable lives. As a wealthy country Japan has an excellent healthcare system with many doctors. This reduces the death rate and increases life expectancy. 1. Identify 3 reason why Japan has a low birth rate 2. Identify three reasons why Japan has a high life expectancy
India’s birth rate is high for many reasons India – A young population There is a lack of family planning education or use of contraceptives. Religious beliefs mean that contraception is forbidden. In rural areas children are also needed as labour on farms. In urban areas they are needed to work in the informal sector to earn money for their families. There is also a high level of infant mortality people have more children India’s life expectancy is lower for many reasons Healthcare in India is improving but is poor in rural areas. Many people live in poverty, and can’t afford to use healthcare even if it is available. Many people lack proper services like clean water and sanitation so diseases spread, particularly for young people. Quality of life for many is low. This increases the death rate and reduces life expectancy. 1. Identify 3 reason why India has a high birth rate 2. Identify three reasons why India has a lower life expectancy
Give a score out of 10. for memory recall 1. HICs have a high _______________ 2. HIC’s have a low _______________ 3. LIC’s have a high _______________ 4. LIC’s have a low ________________ 5. The death rate is _____ in LIC’s 6. Infant mortality is ____ in HIC’s 7. Elderly and young people are known as the ______ population 8. As a country develops the _______ and ______falls 9. LIC’s have more ____ people 10. HIC’ have more ____ people
Give a score out of 10. for memory recall 1. HICs have a high life expectancy 2. HIC’s have a low birth rate 3. LIC’s have a high birth rate 4. LIC’s have a low life expectancy 5. The death rate is high in LIC’s 6. Infant mortality is low in HIC’s 7. Elderly and young people are known as the dependent population 8. As a country develops the birth rate and death rate falls 9. LIC’s have more young people 10. HIC’ have more elderly people
Use Figure 1 and your own knowledge, to explain differences in population structure between France and India Three different comparisons: Birth rate Death rate Life expectancy Point France has a lower birth rate whereas India has a higher birth rate Evidence With 7. 5 % aged 0 -5 compared to 13. 8 % aged 0 -5 Explain This is because _______
Do you remember the key facts? LIC’s have very rapid population growth True HIC’s have high death rates False LIC’s have high birth rates True HIC’s have high birth rates False LIC’s have falling death rates True
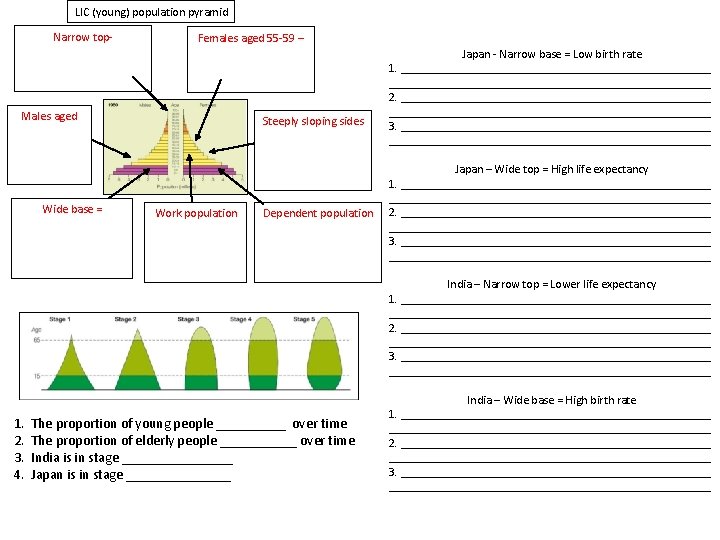
LIC (young) population pyramid Narrow top- Few elderly people so a lower life expectancy Females aged 55 -59 – 0. 8 million people in this age group Males aged 20 -24 = 3 million people in this age group Wide base = A high number of babies so a high birth rate Steeply sloping sides Less people in the next age group so a high death rate Work population Work, pay tax and support the young and old Dependent population Younger or older than the working population Japan - Narrow base = Low birth rate 1. average of marriage in Japan is 30 and less people are actually getting married nowadays 2. More and more women are following careers rather than starting families 3. Contraception is widely used Japan – Wide top = High life expectancy 1. Japanese people eat a healthy diet, low in fat and salt 2. Most people have a good quality of life and standard of living so live comfortable lives 3. Japan has an excellent healthcare system with many doctors India – Narrow top = Lower life expectancy 1. There is a lack of family planning education or use of contraceptives. Religious beliefs mean that contraception is forbidden 2. In rural areas children are also needed as labour on farms. In urban areas they are needed to work in the informal sector to earn money for their families 3. There is also a high level of infant mortality people have more children 1. 2. 3. 4. The proportion of young people decreases over time The proportion of elderly people increases over time India is in stage 3 Japan is in stage 5 India – Wide base = High birth rate Healthcare in India is improving but is poor in rural areas Many people live in poverty, and can’t afford to use healthcare even if it is available. Many people lack proper services like clean water and sanitation so diseases spread