WEST VIRGINIA DIVISION OF ENERGY West Virginia Coal


, 2035 WEST VIRGINIA DIVISION OF")


- Slides: 20
WEST VIRGINIA DIVISION OF ENERGY
West Virginia Coal Association Mining Symposium January 28, 2016 WEST VIRGINIA DIVISION OF ENERGY
Consensus Forecast for WV Coal Production (million short tons), 2035 WEST VIRGINIA DIVISION OF ENERGY
Coal to the WV Electric Power Sector January – July 2015 Source: EIA WEST VIRGINIA DIVISION OF ENERGY
ELECTRICTY SOURCE • Coal was responsible for 39% of electricity generated in the U. S. during 2014, more than any other source of electricity. • Coal is projected to provide 37. 2% of U. S. electricity in 2015 and 36. 6% in 2016. Natural gas is projected to generate 29. 1% of U. S. electricity in 2015 and 29. 5% in 2016. • Coal is projected to remain the dominant fuel for electricity generation in the U. S. through 2030. • As of January 2015, there were 1, 236 individual coal-fueled electric generating units representing approximately 300, 000 MW of electric generating capacity. WEST VIRGINIA DIVISION OF ENERGY
CLEANER COAL • Emissions per KWh of SO 2, NOx, and PM from coal-fueled power plants have been reduced by approximately 90% over the period 1970 -2014. • Approximately $118 billion has been invested through 2013 to achieve these emission controls between 2014 -2016. • Over 90% of U. S. coal-fueled electric generating capacity installed clean coal technologies and other advanced emission controls to reduce emissions of SO 2, NOx, PM, mercury, acid gases, and nonmercury metals. WEST VIRGINIA DIVISION OF ENERGY
U. S. COAL ELECTRIC GENERATION • Coal is used to generate electricity in 48 states. Only Rhode Island (mostly natural gas) and Vermont (mostly nuclear) do not generate any electricity from coal. Coal provides at least half the electricity in 18 states and at least one quarter of the electricity in 30 states. • During 2015, the ten states that generated the most electricity from coal were: Texas, Ohio, Indiana, Illinois, Kentucky, West Virginia, Missouri, Pennsylvania, Michigan, and Florida. WEST VIRGINIA DIVISION OF ENERGY
Global Electricity Demand Source: Exxon
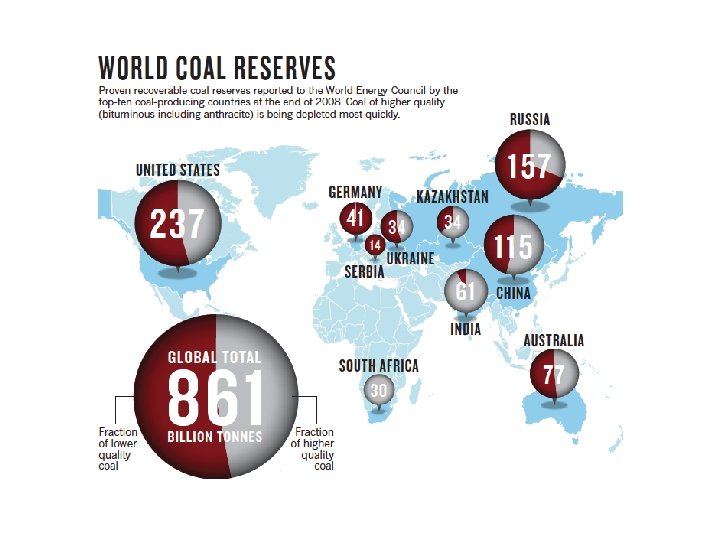
U. S. COAL • According to EIA, the U. S. has the largest recoverable coal reserves in the world. The U. S. is capable of meeting domestic demand for coal for roughly 280 years (260 billion tons total/925 million tons of coal consumed in 2013). • 93% of the coal consumed in the U. S. is used to generate electricity • Coal is mined in 25 states and is responsible for over 700, 000 U. S. jobs. Wyoming is the largest coal-producing state, followed by West Virginia, Kentucky, Pennsylvania, and Illinois. • According to EIA, domestic coal production was 917 million tons in 2014 and projected to fall slightly to 897 millions tons in 2015 and 894 million tons in 2016. WEST VIRGINIA DIVISION OF ENERGY
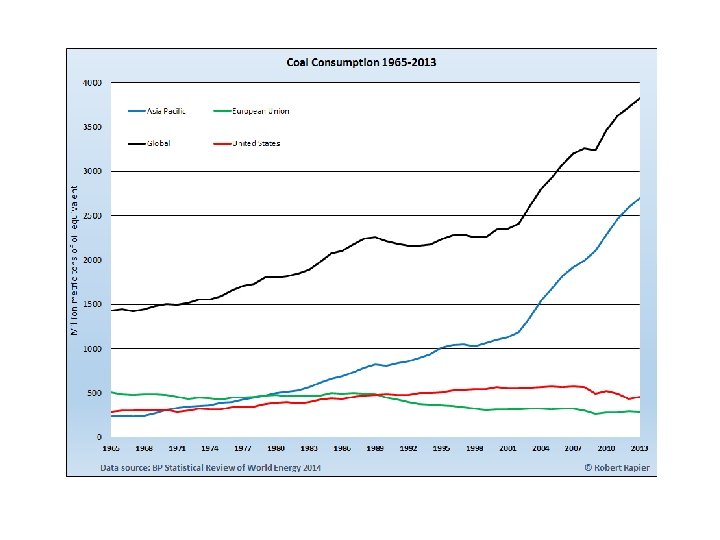
GLOBAL CONSUMPTION • For 2013, U. S. coal demand represented about 12% of total global consumption. Asia consumes over six times as much coal as the U. S. and represents 70 percent of global consumption. • By 2035, global consumption is projected to increase by about 40 percent, with non-OECD Asia’s demand growing by 58%. WEST VIRGINIA DIVISION OF ENERGY
World Energy Consumption Source: EIA International Energy Outlook WEST VIRGINIA DIVISION OF ENERGY
Source: Exxon
West Virginia Power Plant Closures Plant MW Kammer 714 Albright 278 Kanawha River 440 Rivesville 110 Phillip Sporn 1108 Willow Island 213 All closed 5/31/2015 All closed 9/1/2012 WEST VIRGINIA DIVISION OF ENERGY
West Virginia Power Plant Closures • Total West Virginia Coal Generation is 12, 225 MW • Closures are 23% of capacity • PJM Region – Closures of 24, 000 MW predicted WEST VIRGINIA DIVISION OF ENERGY
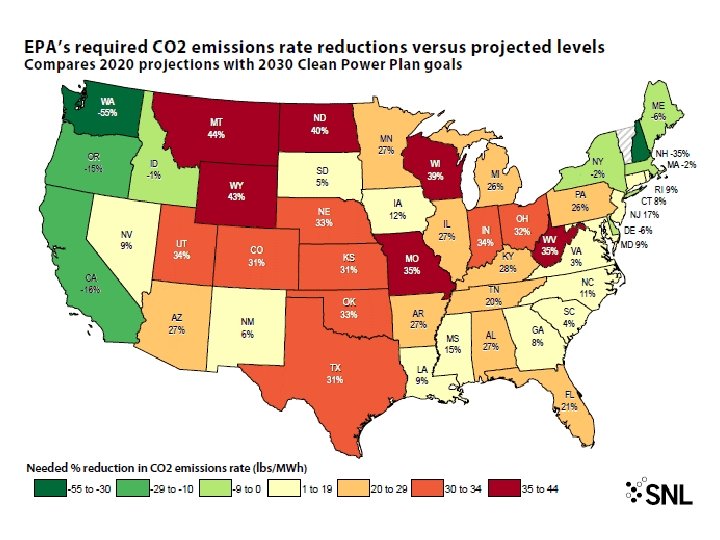
Clean Power Plan • June 2, 2014 – Clean Power Plan proposed by EPA • Goal – Reduced carbon emissions from the power sector by 32% from 2005 levels by 2030 • EPA’s approach set state goals to cut pollution per MWh of electricity generated • West Virginia’s current CO 2 emissions is a reduction of 29% on a mass based approach. • West Virginia’s current emissions rate is 2064 lbs. of CO 2 per MWh. West Virginia’s assigned goal is 1305 lbs of CO 2 per MWh by 2030, which is a 36% reduction • EPA claims states are given flexibility to meet the reduction goals WEST VIRGINIA DIVISION OF ENERGY
Building Blocks to achieve reduced CO 2 per MWh 3 RENEWABLE ENERGY 2 FUEL SWITCHING 1 IMPROVING HEAT RATE Substituting increased electricity generation from new zero-emitting renewable energy sources (like wind and solar) for reduced generation from existing coal-fired power plants Substituting increased electricity generation from lower-emitting existing natural gas plants for reduce generation from higher-emitting coal-fired power plants Reducing the carbon intensity of electricity generation by improving the heat rate of existing coal-fired power plants WEST VIRGINIA DIVISION OF ENERGY
Energy Ventures Analysis West Virginia Predictions Current Cost Future Cost Percentage Change Average Annual Electric Bill $1, 273 / year $1, 609 / year +26% Average Annual Gas Bill $687 / year $1, 101 / year +60% Industrial Electric Rates 6. 3¢ per kwh 8. 5¢ per kwh +34% WEST VIRGINIA DIVISION OF ENERGY