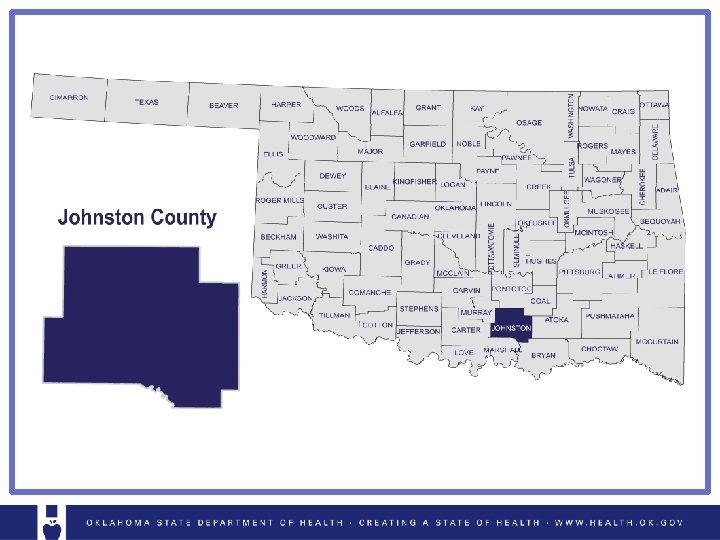
Wellness County Profile 2018 JOHNSTON OKLAHOMA MAPS JOHNSTON


 High Healthy Food Access (High Access)")


- Slides: 19
Wellness County Profile 2018 JOHNSTON
OKLAHOMA MAPS
JOHNSTON Population – 11, 087 Insurance Coverage Uninsured High School Dropouts: Class of ‘ 16 Unemployment Rate (2013 -2015) Insured Johnston 7. 2 Johnston 3. 3% 19. 1% 80. 9% Oklahoma 4. 7 Oklahoma 7. 2% Oklahoma Uninsured – 16. 1% Below Poverty Age Groups Race Poverty Above Poverty White (NH) 69. 6% 65 Years & Over African American (NH) 21. 4% American Indian & Alaska Native (NH) Asian (NH) 18. 4% 2. 2% 15. 6% Under 18 Years 24. 2% 0. 7% 78. 6% Two or more Races 8. 2% Under 5 Years Oklahoma Poverty – 16. 3% Hispanic or Latino 6. 6% 5. 2% Sources 1. United States Census Bureau, State and County Quick Facts, 2016. 2. Unemployment rate data based on U, S, Bureau of Labor Statistics, 2013 -2015. 3. High School Dropouts data provided by the Office of Accountability using data from the Oklahoma State Department of Education.
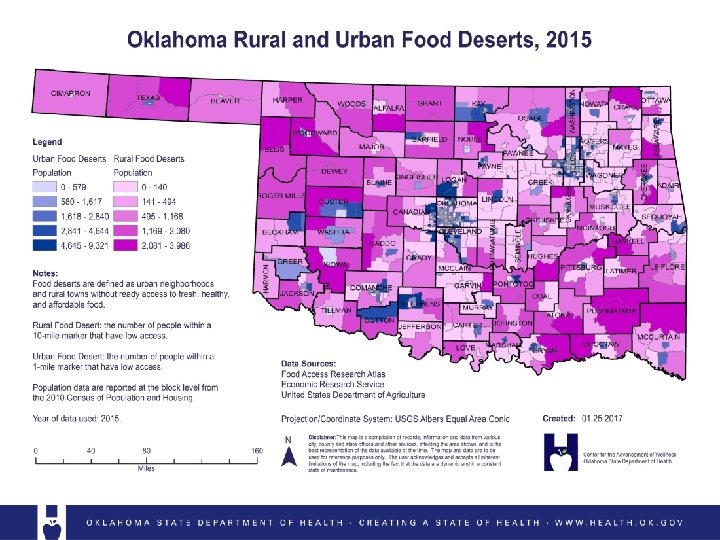
Modified Retail Food Environmental Index (percent of population) High Healthy Food Access (High Access) 0. 0% Moderate Healthy Food Access (Moderate Access) 28. 1% Low Healthy Food Access (Low Access) 47. 3% No Healthy Food Outlet (Poor Access) 24. 6% No Food Outlet (No Access) 0. 0% Sources 1. Community Commons (2012). Retrieved November, 2017, from www. communitycommons. org a. US Census Bureau, County Business Patterns. Additional data analysis by CARES. 2015. Source geography: County b. US Department of Agriculture, Food and Nutrition Service, USDA - SNAP Retailer Locator. Additional data analysis by CARES. 2016. Source geography: Tract c. US Department of Agriculture, Economic Research Service, USDA - Food Access Research Atlas. 2015. Source geography: County d. US Department of Agriculture, Economic Research Service, USDA - Food Access Research Atlas. 2015. Source geography: Tract e. Centers for Disease Control and Prevention, Division of Nutrition, Physical Activity, and Obesity. 2011. Source geography: Tract Notes *Rate per 100, 000 population ^Rate per 10, 000 population §Status compares county to Oklahoma data
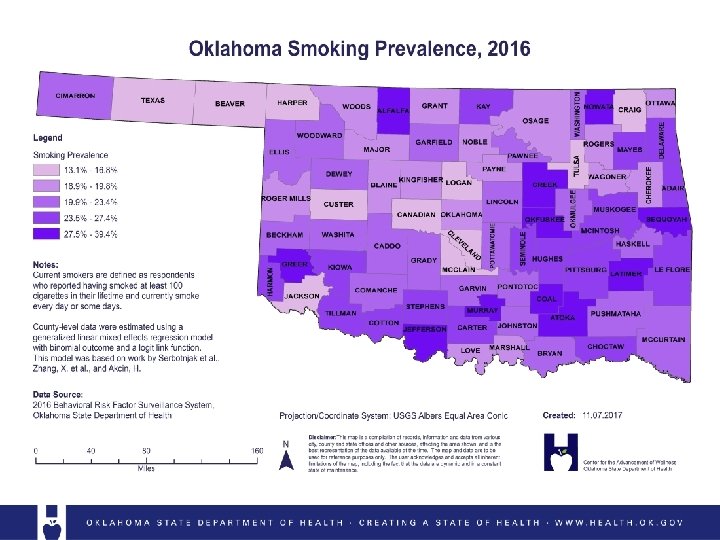
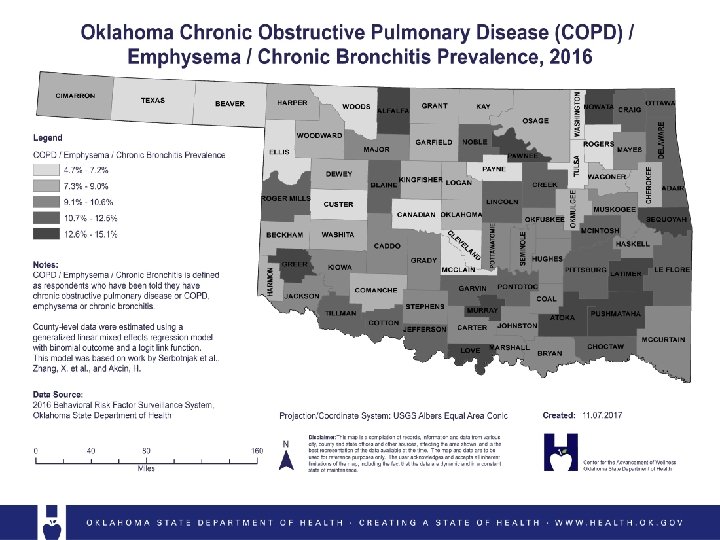
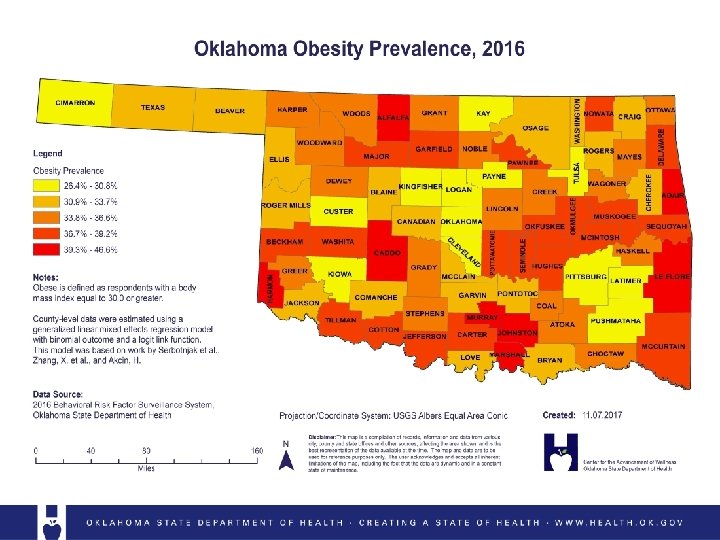
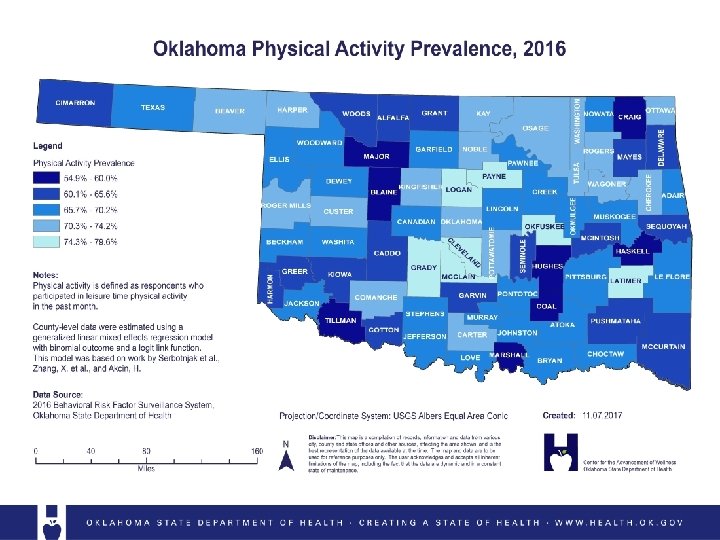
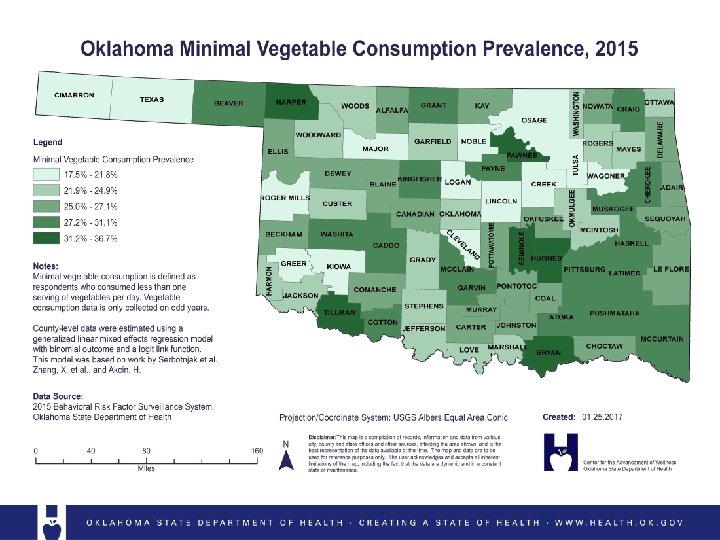
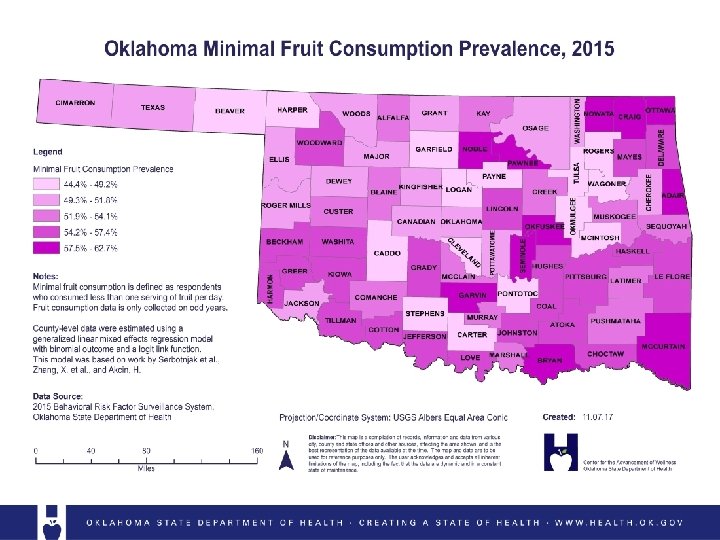
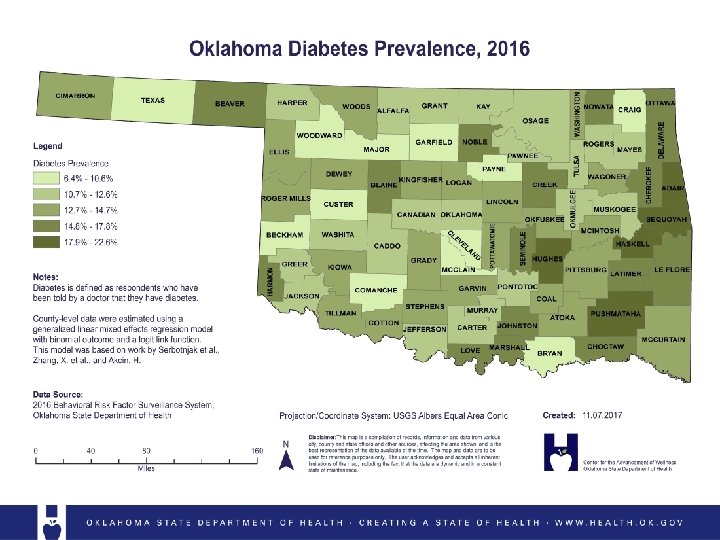
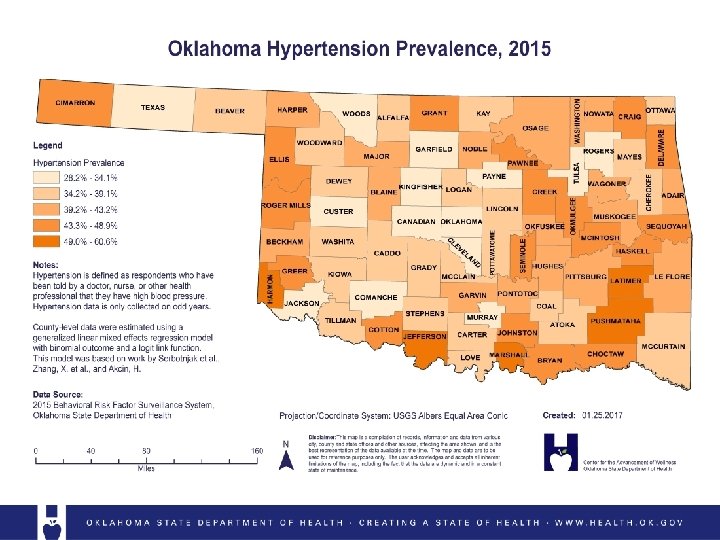
Legend Notes *Chronic Obstructive Pulmonary Disease ^Consumed < 1 serving of vegetable/fruit per day ¶Age-adjusted rates based on 2000 US population standard. All rates are deaths per 100, 000 population. §Status compares county’s 2015 -16 to Oklahoma 2015 -16. Vegetable, Fruit and Hypertension data are only available for odd years; data is carried to even years as placeholders. Sources 1. Oklahoma State Department of Health, Center for Health Statistics, Health Care Information, Behavioral Risk Factor Surveillance System, 2012 -2016. 2. Oklahoma State Department of Health (OSDH), Center for Health Statistics, Health Care Information, Vital Statistics (OK 2 SHARE), 2012 -2016. Better than state outcome ± 0. 5 from state outcome Worse than state outcome
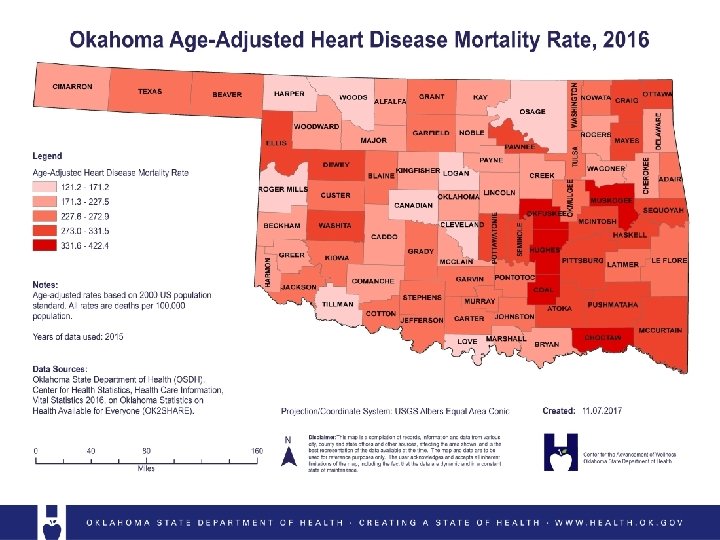
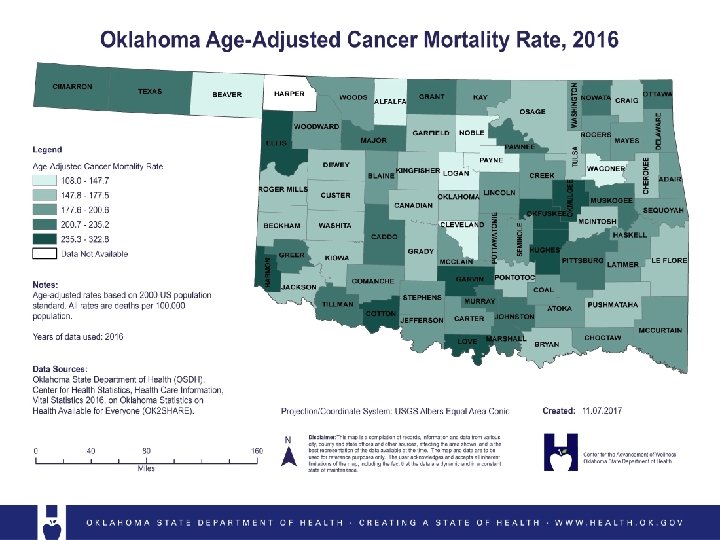
3 -4 -60 DEATH PERCENTAGES* 3 -4 -60 Johnston 65. 2% in Johnston 64. 3% 65. 8% 64. 3% 63. 2% 64. 7% 64. 0% 64. 2% 62. 4% 62. 5% 62. 9% 64. 1% 62. 1% 59. 9% 3 BEHAVIORS 58. 1% 56. 1% 2007 Tobacco Use 63. 6% Oklahoma Sedentary Lifestyle Poor Diet 2008 2009 2010 56. 8% 56. 4% 2011 2012 2013 59. 7% 2014 2015 2016 *3 -4 -60 deaths as a percentage of all causes of death. Deaths include cardiovascular disease, cancer, diabetes, and lung disease. Source: Oklahoma State Department of Health, Center for Health Statistics, Health Care Information, Vital Statistics (OK 2 SHARE), 2007 -2016. 4 CHRONIC CONDITIONS 3 -4 -60 DEATH RATES* Johnston Oklahoma 835. 7 732. 0 Cardiovascular Disease Cancer Diabetes Lung Disease 615. 9 60% OF DEATHS Three unhealthy behaviors influence four chronic diseases that account for almost 60 percent of all deaths in Johnston county and for more than 60 percent of all deaths in Oklahoma. 671. 0 614. 6 2007 611. 3 586. 2 584. 2 585. 9 578. 2 2008 2009 2010 2011 561. 8 543. 9 2012 606. 1 624. 6 567. 5 560. 7 579. 3 2014 2015 571. 6 561. 0 558. 9 2016 *Age-adjusted rates per 100, 000 population. Deaths include cardiovascular disease, cancer, diabetes, and lung disease. Source: Oklahoma State Department of Health, Center for Health Statistics, Health Care Information, Vital Statistics (OK 2 SHARE), 2007 -2016.
Center for the Advancement of Wellness 1000 N. E. 10 th St. Oklahoma City, OK 73117 405 -271 -3619 Center. TA@health. ok. gov www. ok. gov/health/Wellness