Well Logging GL 403 by Dr Ibrahim Abdel

Well Logging GL 403

by Dr. Ibrahim Abdel Fattah

Although the drill cuttings and cores recovered while a well is being drilled are the most important sources of subsurface information. Much information concerning the formation lithology and nu concerning the formation lithology and fluids content is obtained indirectly from well logging. Well logging denotes an operation wherein a continuous recording is made, versus depth, of some characteristic physical parameters of the formations penetrated by a drill hole. The record is called a log. Many types of well logs are recorded by means of appropriate down-hole instruments called sounds, lowered into the wellbore on the end of a cable as shown in figure (1). The parameters being logged are measured in situ as the sonde is moved along the borehole. The resulting signals from the sonde are transmitted, via electrical conductors in the cable, to the surface, where the continuous recording, or log, is made.

1: DRILLING TIME LOG. Drilling time or rate of penetration log consists of a graph or curve in which drilling time or penetration rate is plotted against depth. Drilling time is the time required to rotary drill a linear unit of formation. This time is a function of two things the type of the rock, and the conditions under which the rock is drilled. The strength of the rock being penetrated and its toughness are considered the principal factors influencing the drilling rate. Toughness of the rock depends on the mineral composition, kind and degree of cementation, texture, and porosity. Drilling conditions are also influenced the rate of penetration. These conditions include design, sharpness, depth, and weight of the drilling bit, drilling mud characters, pump velocity, and rotation speed. Normally the log is made automatically by devices such as the Geolograph or the Log-O-Graph. Figure (2) introduces an example of drilling time log. The drilling time log is used in: (1) indicates the contact between the rocks of different permeability. (2) the detection of porous zones in a thick carbonate section, (3) the identification of thin shale breaks or ugnt calcareous streaks interbedded in sandstone formation. (4) Establishing control points for the samples, and (5) Determining sample lag and checking to see that samples were caught properly at the rig.


2: ELECTRICAL LOGS. Electrical well logging is, essentially, the recording of the resistivities (or their reciprocals, the conductivities) of the subsurface formations and the spontaneous potentials (SP) generated in the boreholes. The measurements are performed in the uncased boreholes.

2. 1: RESISTIVITY LOGS. The electrical resistivity of a substance, at any given temperature, is the resistance measured between opposite faces of a unit cube of that substance. In electrical logging work, the meter was chosen as the unit of length; so the unit of resistivity is taken as the ohm-meter (ohm-m). Subsurface formations in general have finite measurable resistivities because of the water contained in their pores or adsorbed on their interstitial clay. Formation resistivity also depends on the shape and the interconnection of the pore space occupied by the water. These depend on the lithology of the formation and, in the case of reservoir rocks, on the presence of nonconductive oil or gas.

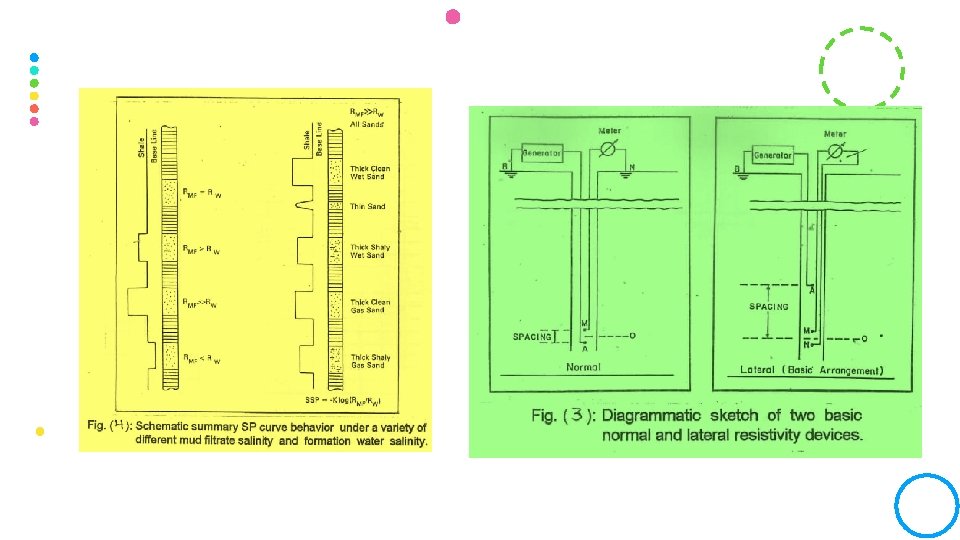
Several different kinds of resistivity curves or logs can be recorded. These correspond to the use of different resistivity measuring devices and are designated as induction logs, conventional logs (Normal and Lateral). Laterologs, Dual Laterologs. Micrologs, Microlaterologs, and Microspherical logs. In conventional resistivity logging (Normal and Lateral) currents are passed through the formation via two electrodes known as current electrodes denoted by (A and B) and voltages are measured by two other electrodes denoted by (M and N) and known as potential electrodes. Through the measured values of both current and voltages, resistivity could be simply computed. Figure ( 3 ) shows a diagrammatic sketch of the two basic macro- devices (Normal and Lateral). The Laterolog and Dual Laterolog methods of resistivity measurements (LL 3, LL 7, LLS, LLd) minimizes the influence of the borehole and surrounding formations by focusing the current to flow radially as a thin sheet of current into the formation being logged. The Laterologs and Dual Laterologs are designed to determine Re (true resistivity of the formation). The microresistivity tools (Microlog, Microlaterolog, and Microspherical log) are designed to determine Rxo (the resistivity of the fushed zone).

2. 2: SPONTANEOUS POTENTIAL LOG. The SP curve is a recording versus depth of the difference between the potential of a movable electrode in the borehole and fixed electrode at the surface. The naturally occurring potentials within the well bore are developed as a result of the difference in salinity between the borehole fluid and formation water. The SP currents are caused by two main groups of electromotive forces namely; electrochemical and electrokinetic. The magnitude and shape of the SP deflection is controlled by the resistivity contrast between the drilling mud and the formation water. If the mud and the formation water have the same salinity (the same resistivity), The SP trace will not depart from the values associated with the shale reading (shale baseline). When the formation contains water less saline than the mud the SP trace moves the right of shale base line producing positive anomaly When the formation has water more saline than the mud, the SP curve moves to the lift producing negative anomaly (figure 4).
. The lift-hand")
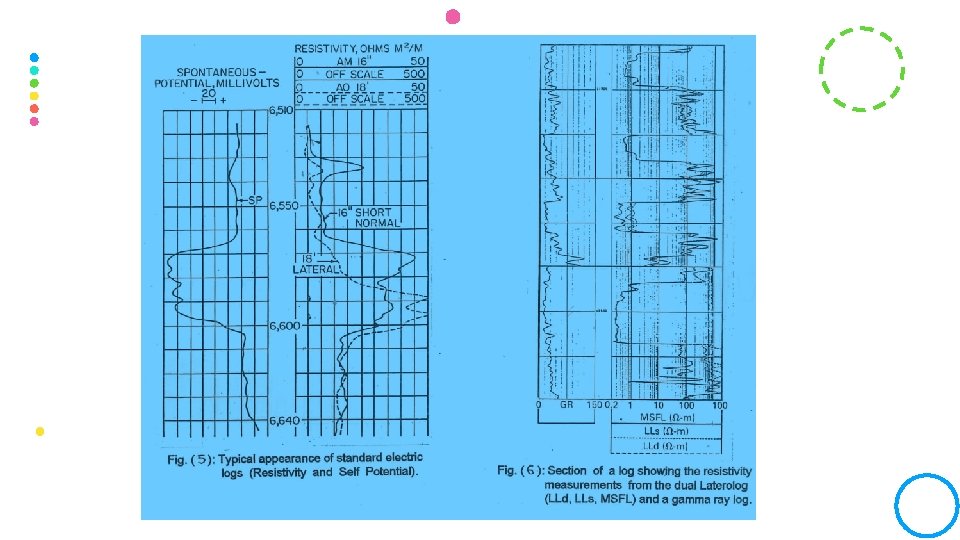
The typical appearance of standard electrical logs is illustrated in figure (5). The lift-hand track of the log contains the SP curve, which may be taken as qualitatively indicative of the existence of permeability in the formations. The middle track contains a 16 -inch short normal resistivity as solid curve, and a 61 -inch normal resistivity as dashed curve. The righthand track contains 18 feet 8 -inch lateral resistivity curve. Figure (6) shows three types of resistivity measurements (LLD, LLs, and MSFL). The general information provided by the electrical logs is essentially the following: (1) differentiation between shales, hard rocks, and permeable beds; definition of boundaries between beds; and correlation. (2) in most cases qualitative discrimination between oil or gas bearing and water bearing beds, as well as location of oil water contact. (3) quantitative evaluation of porosity and water saturation.

3: RADIOACTIVITY LOGS. Radiation well logging measures the natural radioactivity of the subsurface formations (Gamma Ray Log) and secondary effects due to the bombardment of the formations by neutrons emitted from a source contained in the sonde (Formation Density and Neutron Logging). The parameters are measured in situ and are continuously recorded at the surface. The measurements can be made in both open and cased holes filled with any fluid (including air, i. e. , empty).
 is a record versus depth")
3. 1: GAMMA RAY LOG. Gamma Ray Log (GR) is a record versus depth of the natural radioactivity of the subsurface formations. The radioactivity arises from the decay of the three elements present in the rocks; Uranium. Thorium, and Potassium, which continuously emit gamma rays, in the form of short bursts of highenergy radiation. A fraction of these emitted gamma rays around the borehole penetrate the mud and can be detected by a suitable gamma ray sensor. The detector gives a discrete electrical pulse for each gamma ray detection, GR log is scaled in API units. This unit is defined as 1/200 of the response generated by a calibrated standard, which is an artificial formation containing precisely known quantities of Uranium, Thorium, and Potassium, maintained by American Petroleum Institute (API).

The Gamma Ray Log normally reflects the shale content of the formation. This is because the radioactive elements tend to accumulate in clays and shales. Clean formations usually have a very low level of radioactivity. The GR values in sedimentary rocks range from a few API units in anhydrite or salt, to 150 API or more in shales. In permeable formations, radioactivity is low. The GR log therefore can be considered a good permeability log, since it separates quite well shales from the permeable beds. Figure (7) shows comparison of Gamma Ray log with the SP and Caliper logs over clean and shale zones.

3. 2: NEUTRON LOGS. Neutron logs reflect the amount of liquid-filled porosity. They response primarily to the amount of hydrogen present in the formation. In Neutron tools, high energy neutrons are continually emitted from a radioactive source which is mounted in the sonde. These neutrons collide with nuclei of the formation materials. With each collision a neutron loss some of its energy. The amount of energy lost per collision depends on the relative mass of the nucleus with the neutron colloids. The greatest loss occurs when the neutron strikes a nucleus of partically equal mass (as a hydrogen nucleus). Thus, the slowing down of neutrons depending largely on the amount of hydrogen in he formation. By successive collisions, neutrons have been slowed down to thermal velocities (corresponding to energies of around 0. 025 electron volts). They then diffuse randomly, without losing any more energy, until they are captured by the nuclei of atoms such as chlorine, hydrogen, silicon, etc.
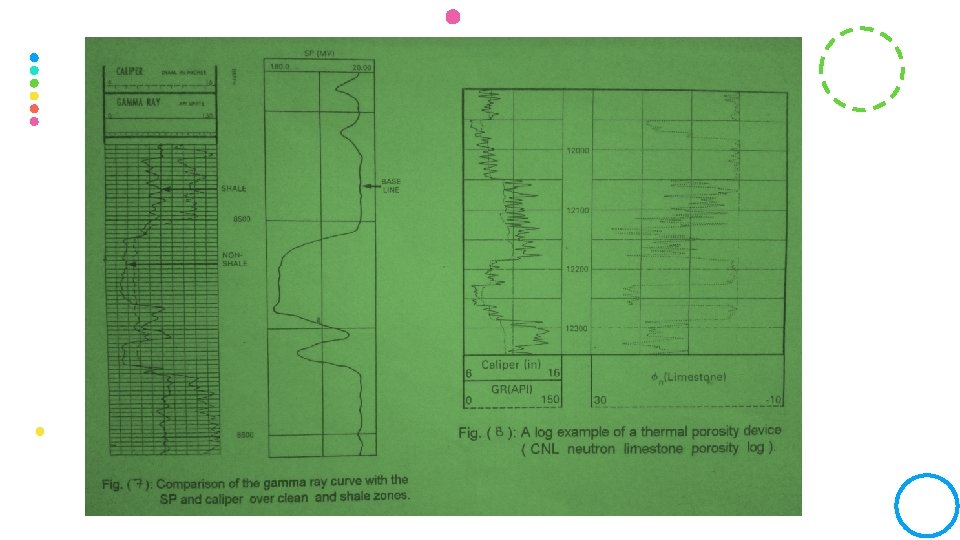

The capturing nucleus becomes intensity excited and emits a highenergy gamma ray of capture. Depending on the type of neutron logging tool, either these capture gamma rays or neutrons themselves are counted by a detector in the sonde. Neutron logging tools include three types namely; GNT (Gamma Ray Neutron Tool), SNP (Sidewall Neutron Porosity), and CNL (Compensated Neutron Log). A detector, at a fixed distance from the radioactive source, counts either epithermal neutrons (SNP) or thermal neutrons (CNL, with two detectors, near and far) or both thermal neutrons and gamma rays of capture (GNT). Figure (8) shows an example of CNL presentation.
 shows, in the form of a log, the typical types of")
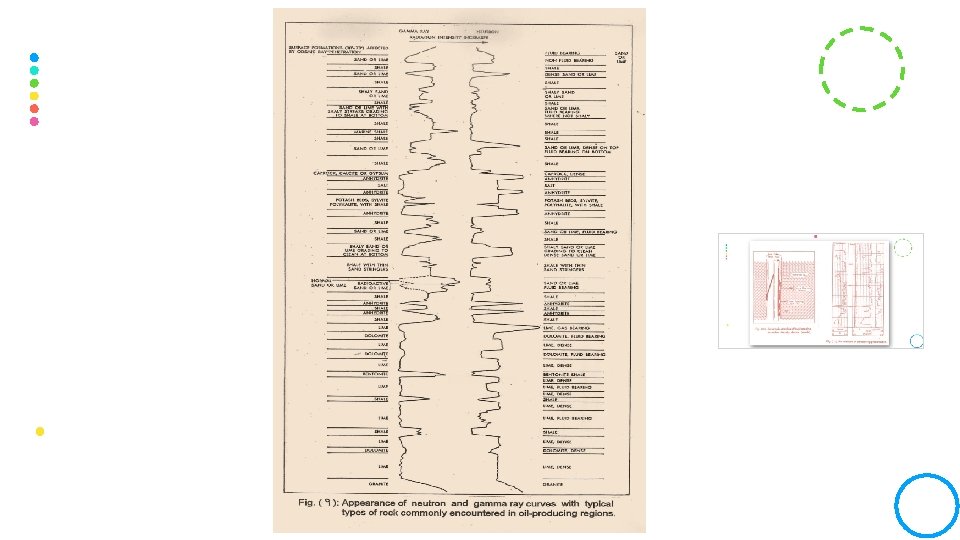
Figure (9. ) shows, in the form of a log, the typical types of rock commonly encountered in oil-producing regions. Alternate responses are shown for the neutron curve in some of these rocks, illustrating that it responds differently depending upon the fluid content or the shale content of these formations. Determination of porosity (n) is one of the most important uses of Neutron Logs. In SNP and CNL logs, porosity values read directly assuming a limestone matrix. Porosity values are then corrected for the actual lithologies by using appropriate Schlumberger charts. The GNT readings are converted from API units to porosity index assuming limestone matrix by using appropriate Schlumberger charts.

3. 3: FORMATION DENSITY LOG. Density Log is a recording of bulk density of the formations versus depth. Bulk density (pb) is recorded by sonde contain gamma ray source and two detectors (figure 10). The radioactive source emits medium energy gamma ray into the formation. These gamma ray may be act as high velocity particles which collide with the electrons in the formation. At each collision a gamma ray loses some of its energy to the electron and then continues with diminished energy This type of interaction is known as compton scattering the scattered gamma rays reaching the detector are counted as an indication of the formation density.
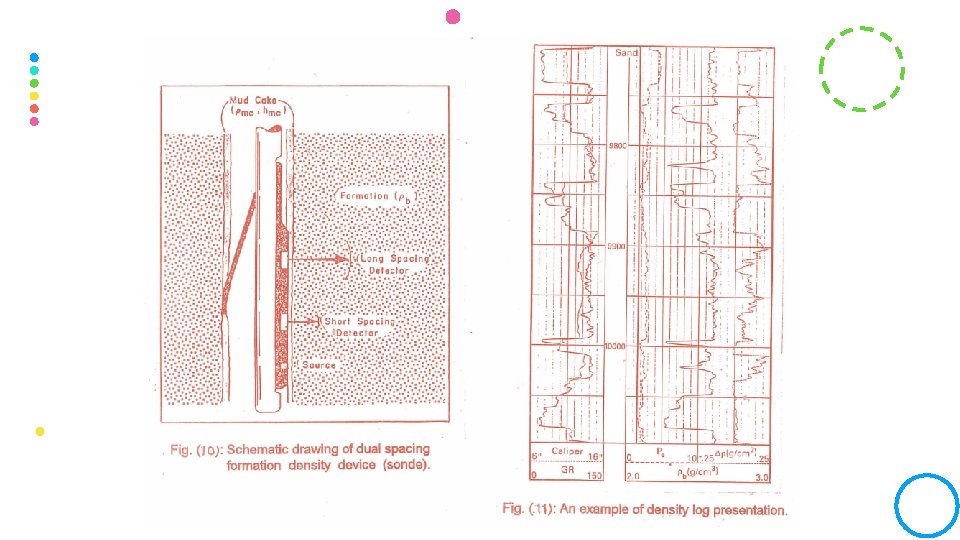

The number of compton-scattering collisions is related directly to the number of electrons in the formation (electron density) Electron density is related to true bulk density (pb) in grams per cubic centimeter, which in turn depends upon the density of the rock matrix material, the formation porosity, and the density of the fluids filling the pores. The Density Log is one of the most effective and useful logging tools in the industry. It is used to determine porosity (40) for the formations and to measure bulk densities for gravity interpretation. In combination with other logs, it can give information on lithology, shale content, and fluid saturations. Figure (11) shows an example of density log presentation
 versus")
4: SONIC LOG Sonic Log is a recording of interval transit time (At) versus depth. Interval transit time is the time in microseconds (u sec) for sound wave to travel through one feet of formation along the part parallel to the borehole. At is the reciprocal of the velocity of the compressional sound wave and depends upon formation lithology and porosity. Sonic Log is recorded by sonde contain two transmitters (one upper and one lower) and four receivers (figure 12). Transmitter pluses sound wave which enter the formation and the receiver record the transit time. The sonic sonde must be near the borehole wall because the drilling mud decrease the speed of sound. So that, four receivers are present on alternate pair system. The recorded interval transit time values from the two sets of receivers are averaged automatically at the Surface.
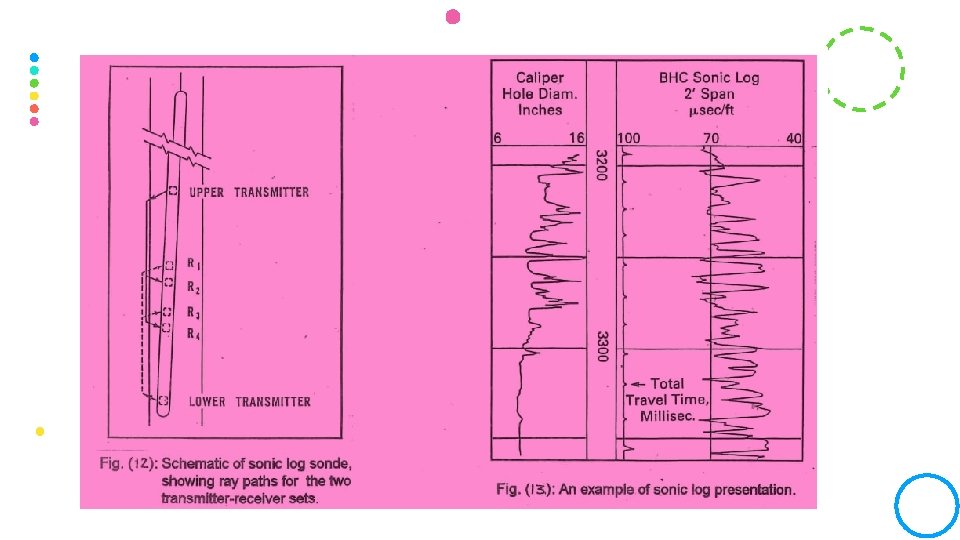

Sonic Log is useful for correlation in many cases and some lithologies are identified by the magnitude of At readings. The main use of Sonic Log is the determination of porosity (5). The integrated travel time (ITT) is useful in seismic interpretation Figure (13) shows an example of sonic log presentation
.")
5: CALIPER LOG The Caliper Log measures the diameter of the borehole (figure 13). The borehole diameter is recorded by instrument uses three flexible springs which contact the wall of the borehole. Hole diameter is determined as the springs expand or contract. The Caliper Log is recorded as histogram with selected horizontal scale (usually 1 inch: 4 inch) to show the detail picture of the hole diameter (as shown in figures 7. 8 and 11). Caliper Log is used to determine the amount of cement needed to fill up to a certain depth. It can be used to locate the permeable zones evidenced by the presence of a filter cake. A study of numerous caliper logs of a well leads to the conclusion that caving pattern exist

6: TEMPERATURE LOG. The Temperature Log measures borehole temperature as a function of depth. The equipment for making temperature survey is a thermometer of electrical-resistance type, i. e. , the resistance of the element is sensitive to change in temperature. Unlike most other logs, the temperature survey is usually recorded going down the hole. Temperature Log may be used to locate: (1) the gas zone because the gas produced from the formation causes a pressure drops radially and accordingly a decrease in temperature, (2) the top cement in the casing-wellbore annulus because cement generates considerable heat when it sets. Figure (14) shows both the normal temperature survey and a differential temperature survey for a problem well.

7: HYDROCARBON-MUD LOG. The Hydrocarbon-mud Log detects the presence of minute quantities of gas and oil both in the mud stream and in the rock cuttings. The small quantities of oil and gas can be detected by using sensitive instruments Limits of detection for the Hydrocarbon-mud Log are usually estimated to be 0. 01 cubic feet of gas per hour or 1 -part oil in 100 000 parts mud.

The method of sampling the mud stream is a very important part of Hydrocarbon-mud logging. Often a portion of the mud stream is diverted to a separator or gas trap. In the trap air is drawn countercurrent to the flow of mud with a slight vacuum. This vacuum combined with agitation of the mud stream separates the gas from the mud and mixes it with air. After passing through a filter, the gas and air mixture goes to the detector. Several kinds of detectors were used. They include hot-wire detector (figure 15), gas chromatography, or infrared detector. To detect the presence of oil in the drilling mud, a sample of mud is first treated to reduce surface tension and gel strength. The sample is then examined under ultraviolet light. Almost every crude oil fluoresces under ultraviolet light

8: DIPMETER LOG. The dipmeter is a survey device run in the borehole to determine amount and direction of dip of formations penetrated by the well. The formation dip is the angle between a horizontal plane and the formation bedding plane. The instrument for measuring dip uses three electrodes spaced 120° apart in a plane perpendicular to the wellbore. Each of these three electrodes records a sepårate curve. From inspection of these curves, it is possible to correlate the curve, i. e. , locate points common to all three curves Various methods have been used to record the three dip curves for the dipmeter log (three self-potential curves, three lateral resistivity curves, or three caliper curves) After the basic readings are made, the amount of dip may be calculated in several ways. The amount and direction of dip may be calculated by mechanical model (Normograms). "and may also be solved graphically using descriptive geometry and stereographic net.

The dipmeter is used to gain an idea of structure from an exploratory well. If the first well in an area is productive, the amount and direction of dip can be used to select the best location for the next well. If the exploratory well is dry, the dip data may show that another well can be drilled at a more advantageous structural position. The dipmeter data is also used to aid in solving the problem of complicated correlation due to the high dips of the formations and the presence of angular unconformity.

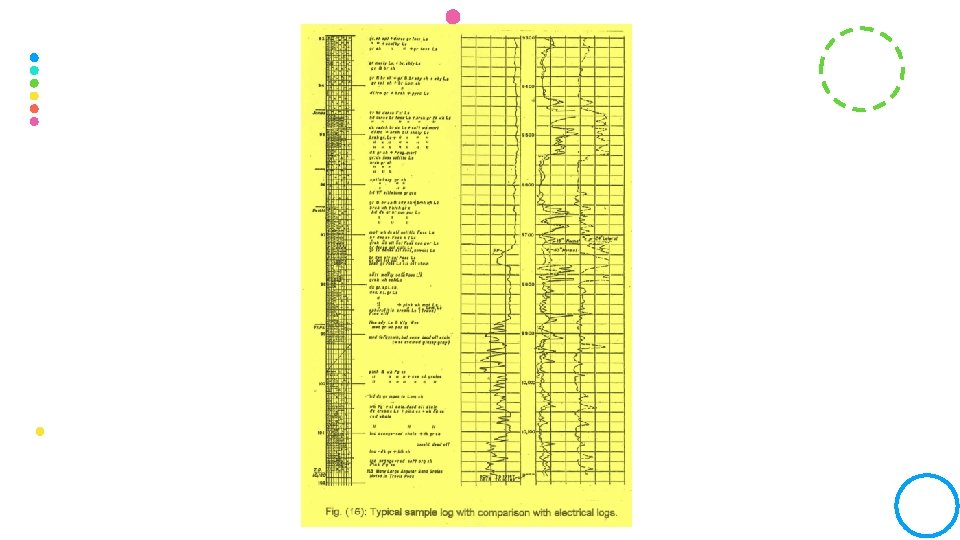
9: THE GEOLOGIC SAMPLE LOG. The geologic sample log is a record of the rocks penetrated in drilling a well. It is prepared by describing the rock types as determined from the examination of the rock cuttings or samples recovered at the surface. The geologist examines the samples to describe the materials and show graphically the amounts of each on this sample log. The sample log consists of the plotting log and accompanying written description. List of symbols or color codes are used for plotting the sample log. One very important portion of the description concerns the shows of oil or gas noted in the samples.

The location of oil and gas reservoirs is probably the most important use of the geologic sample log. Another use of the sample log is correlation, both regional and local. The electrical logs provide more accurate correlation for most formations, but the geologic sample log provides it while the well is being drilled. If there is lateral variation in formations, complicated faulting, etc. , it is often impossible to correlate electrical logs without referring to the sample log. Perhaps the most fundamental use of the geologic sample log is in basic study of determining the geology of an area and finding the stratigraphic traps. Figure (16) shows a typical sample log in comparison with electrical logs.

- Slides: 36