
Welcome to Workforce 3 One MAPPING AND BRAIDING
Welcome to Workforce 3 One MAPPING AND BRAIDING OF FUNDS PART 2 U. S. Department of Labor Employment and Training Administration Webinar Date: MARCH 21, 2016 Presented by: ETA REGION 2 U. S. Department of Labor Employment and Training Administration
MODERATOR Stephen Duval Division Chief DOL/ETA – Philadelphia Regional Office of State Systems Division of Workforce Investment Have a question or comment about WIOA? E-mail DOL. WIOA@dol. gov 2
Webinar Objectives ETA Region 2 Support and Resources for State, Regional and Local Planning – October 2014: Creating Innovation in the Public Sector-- explored the barriers to innovating in the public sector and developed strategies to overcome them. – March 2015: Strategic Doing™— introduced an innovative approach to initiating and accomplishing regional transformation. – April 2015: Asset/Resource Mapping — Part I of a webinar series designed to introduce asset mapping processes to support WIOA implementation – May 2015: Innovative Approaches to Braiding Funding and Services — Part II of a webinar series designed to explore innovative approaches to aligning diverse funding resources to support state and local workforce development efforts. – November 2015: Federal Partnerships: State-by-State overview of Federal investments in workforce development.
Webinar Objectives Asset Mapping Techniques and Strategies Asset mapping is an important strategy for supporting regional collaboration, aligning organizations to maximize use of resources and understanding regional assets. Webinar access: https: //www. workforce 3 one. org/view/5001508 447842098974/info
Webinar Objectives Innovative Approaches to Braiding Funding and Services Explores innovative approaches to aligning diverse funding resources and assets to support state and local workforce development efforts. Webinar access: https: //www. workforce 3 one. org/view/50015085488 16246859/info
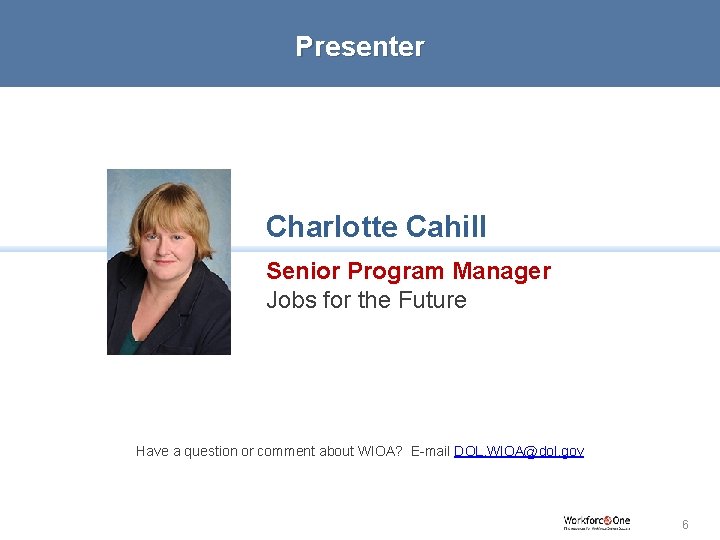
Presenter Charlotte Cahill Senior Program Manager Jobs for the Future Have a question or comment about WIOA? E-mail DOL. WIOA@dol. gov 6
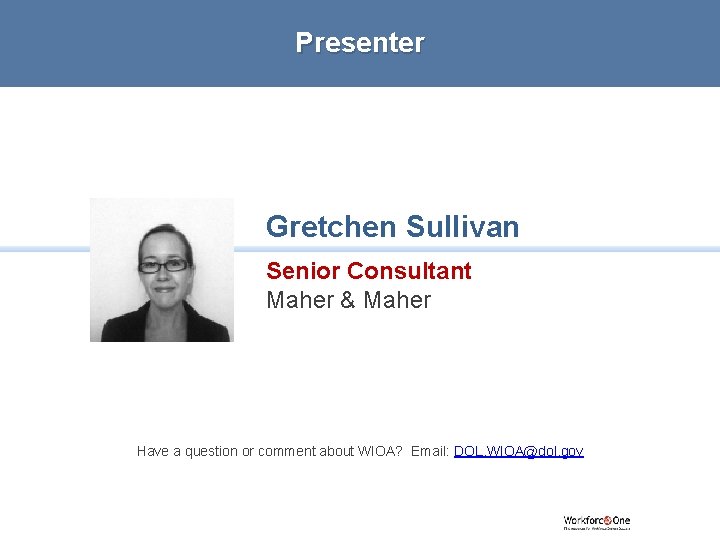
Presenter Gretchen Sullivan Senior Consultant Maher & Maher Have a question or comment about WIOA? Email: DOL. WIOA@dol. gov
Presenter Charlotte Cahill Senior Program Manager Jobs for the Future Have a question or comment about WIOA? E-mail DOL. WIOA@dol. gov 9
What is asset mapping? • Asset mapping is the general process of identifying and providing information about a region’s assets. It generally includes: – Tapping the expertise of key stakeholders – Research on relevant policies and programs – Analysis of labor market data – Synthesizing data and information gathered through the process – Sharing results with stakeholders
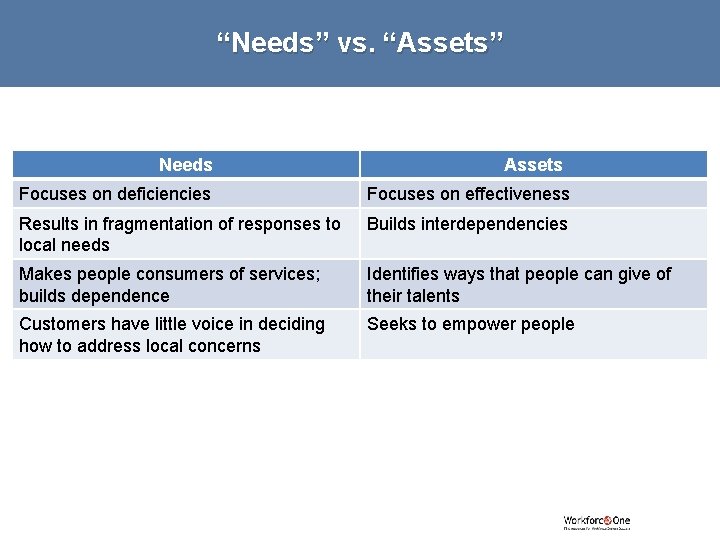
“Needs” vs. “Assets” Needs Assets Focuses on deficiencies Focuses on effectiveness Results in fragmentation of responses to local needs Builds interdependencies Makes people consumers of services; builds dependence Identifies ways that people can give of their talents Customers have little voice in deciding how to address local concerns Seeks to empower people
Why do asset mapping? • To understand leverage existing work and programs • To reduce or eliminate duplication of efforts • To build engagement and buy-in • To assess gaps, strengths, challenges, and opportunities that may affect program implementation/operation
Defining your local area • Geographic boundaries – Census designations • Governance/service areas – Workforce areas – State, local, and county governments – School (K-12 or community college) districts • Areas based on regional labor market – Labor shed – Commuter shed
Doing the initial research • Desk-based research – Workforce and economic development reports and studies – Relevant federal, state, and local policies and programs – Education/training and community-based organizations and programs – Trade associations – Major employers – Labor market information • Identify gaps in information • Brainstorm list of key stakeholders
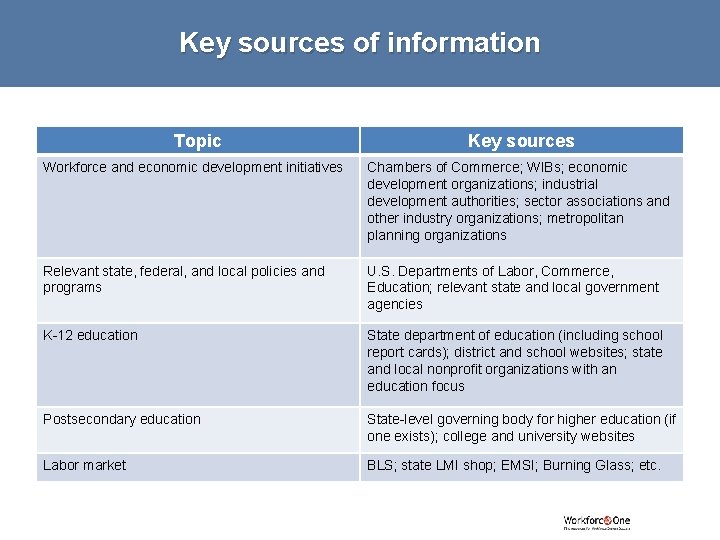
Key sources of information Topic Key sources Workforce and economic development initiatives Chambers of Commerce; WIBs; economic development organizations; industrial development authorities; sector associations and other industry organizations; metropolitan planning organizations Relevant state, federal, and local policies and programs U. S. Departments of Labor, Commerce, Education; relevant state and local government agencies K-12 education State department of education (including school report cards); district and school websites; state and local nonprofit organizations with an education focus Postsecondary education State-level governing body for higher education (if one exists); college and university websites Labor market BLS; state LMI shop; EMSI; Burning Glass; etc.
Engaging key stakeholders • Schedule in-person meetings if possible – Create focused interview groups • Address gaps in available information • Test understanding developed based on desk -based research
Questions for employers • Demand: In your industry, what sectors are creating the most demand for workers, or are experiencing shortages of qualified workers? • Current employer engagement: How are you and other employers engaged in workforce initiatives? • Education partners: How are the K-12 and community college systems doing as partners or suppliers of skilled workers?
Questions for educators • Employer engagement: How are employers engaged in educational programs and how are those relationships managed? • Career information and advising: What career information and advising do students get? • Program growth and alignment with area initiatives: How are you identifying opportunities for program growth? What are the college/district’s processes for adapting existing or creating new programs?
Questions for intermediary organizations • Intermediary roles: What organizations are assisting and supporting educators and employers in working together? • Education partners: What are the K-12 and community college systems doing to prepare people for career opportunities in your local area? • Employer groups and champions: What employers have played, or could play, important roles in career education and workforce development? • Environmental and policy factors: What other factors affect the region’s capacity to build career-oriented education and workforce development programs?
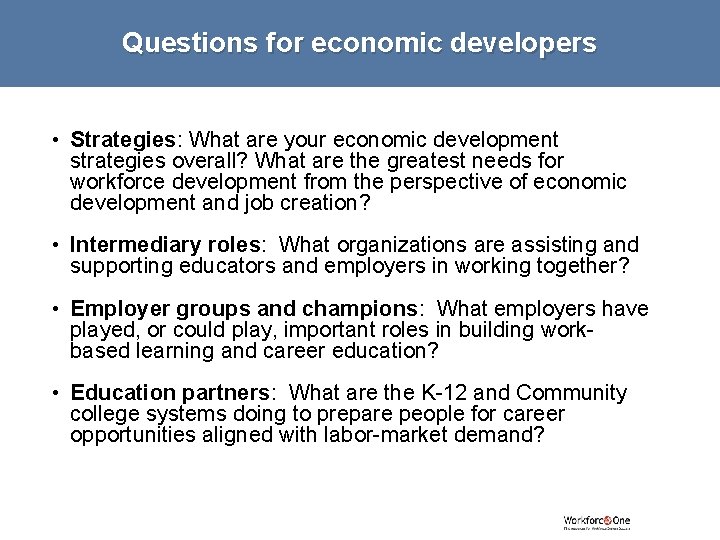
Questions for economic developers • Strategies: What are your economic development strategies overall? What are the greatest needs for workforce development from the perspective of economic development and job creation? • Intermediary roles: What organizations are assisting and supporting educators and employers in working together? • Employer groups and champions: What employers have played, or could play, important roles in building workbased learning and career education? • Education partners: What are the K-12 and Community college systems doing to prepare people for career opportunities aligned with labor-market demand?
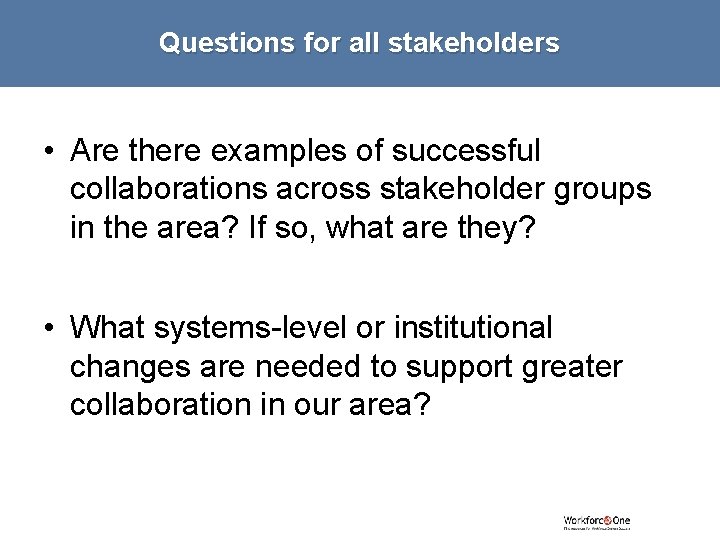
Questions for all stakeholders • Are there examples of successful collaborations across stakeholder groups in the area? If so, what are they? • What systems-level or institutional changes are needed to support greater collaboration in our area?
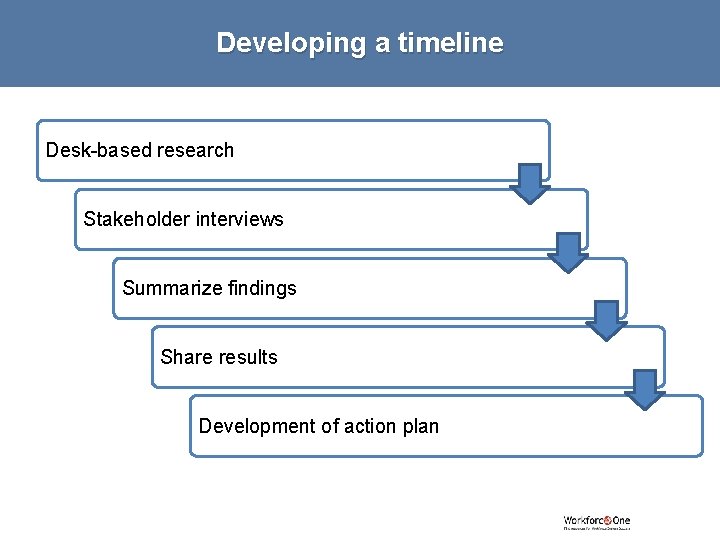
Developing a timeline Desk-based research Stakeholder interviews Summarize findings Share results Development of action plan
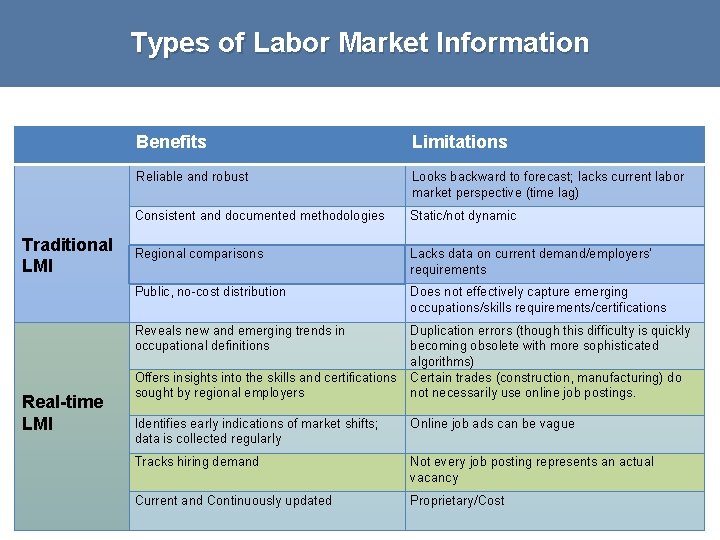
Types of Labor Market Information Traditional LMI Benefits Limitations Reliable and robust Looks backward to forecast; lacks current labor market perspective (time lag) Consistent and documented methodologies Static/not dynamic Regional comparisons Lacks data on current demand/employers’ requirements Public, no-cost distribution Does not effectively capture emerging occupations/skills requirements/certifications Reveals new and emerging trends in occupational definitions Real-time LMI Duplication errors (though this difficulty is quickly becoming obsolete with more sophisticated algorithms) Offers insights into the skills and certifications Certain trades (construction, manufacturing) do sought by regional employers not necessarily use online job postings. Identifies early indications of market shifts; data is collected regularly Online job ads can be vague Tracks hiring demand Not every job posting represents an actual vacancy Current and Continuously updated Proprietary/Cost
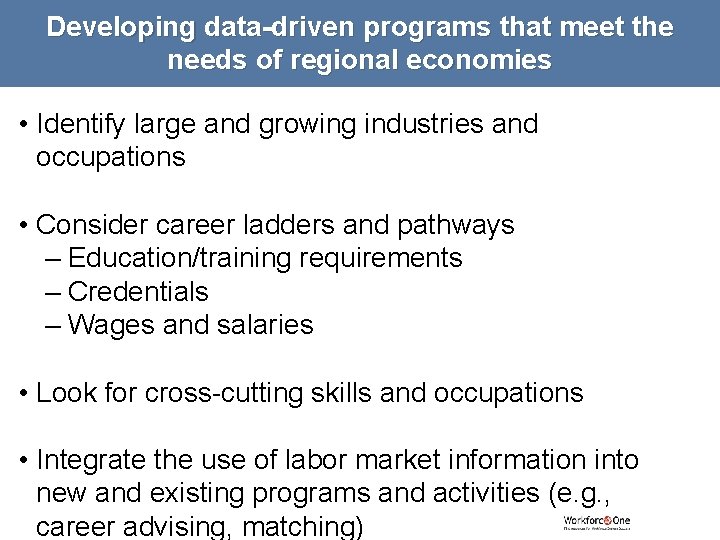
Developing data-driven programs that meet the needs of regional economies • Identify large and growing industries and occupations • Consider career ladders and pathways – Education/training requirements – Credentials – Wages and salaries • Look for cross-cutting skills and occupations • Integrate the use of labor market information into new and existing programs and activities (e. g. , career advising, matching)
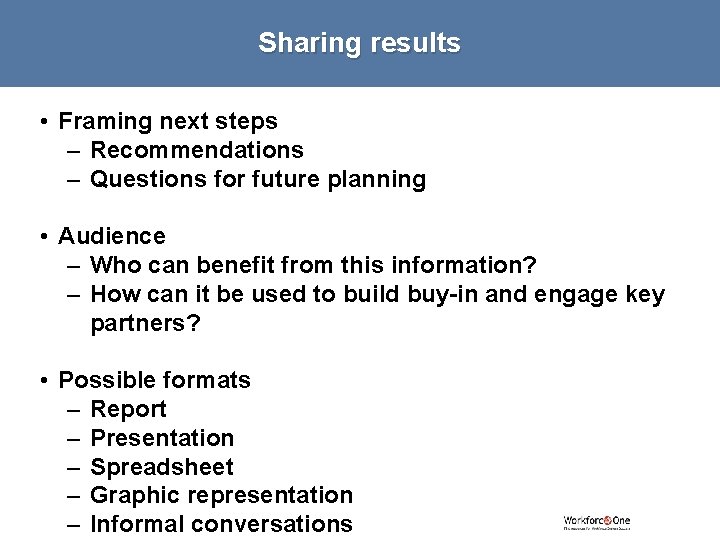
Sharing results • Framing next steps – Recommendations – Questions for future planning • Audience – Who can benefit from this information? – How can it be used to build buy-in and engage key partners? • Possible formats – Report – Presentation – Spreadsheet – Graphic representation – Informal conversations
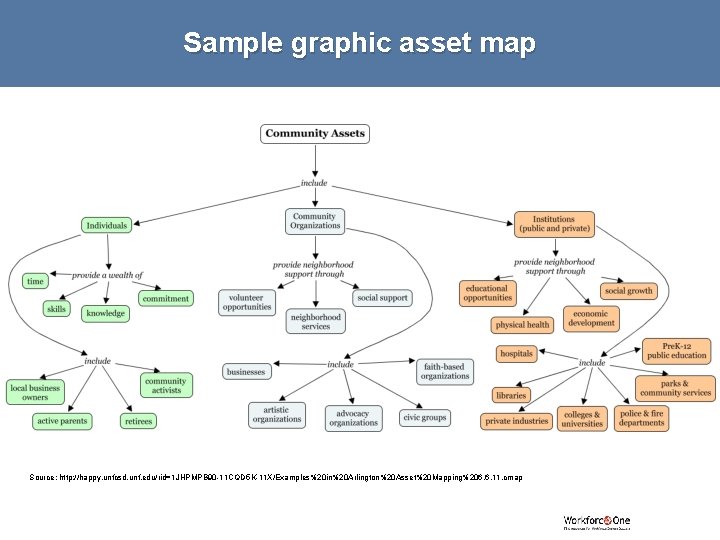
Sample graphic asset map Source: http: //happy. unfcsd. unf. edu/rid=1 JHPMPB 90 -11 CQD 5 K-11 X/Examples%20 in%20 Arlington%20 Asset%20 Mapping%206. 6. 11. cmap
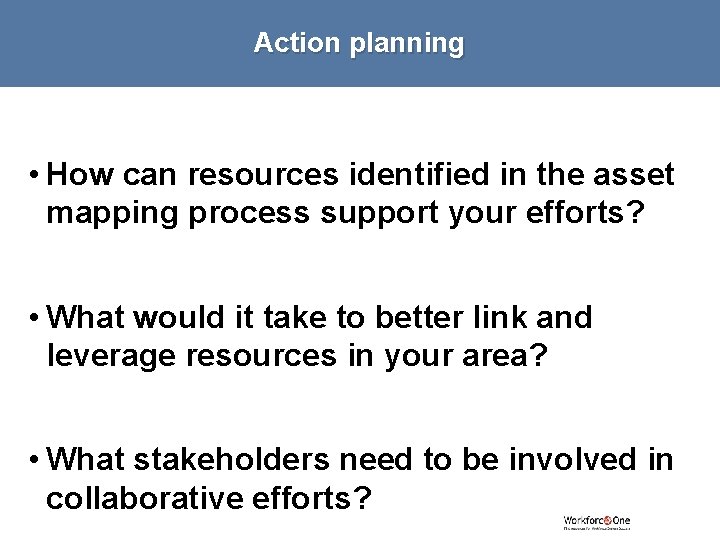
Action planning • How can resources identified in the asset mapping process support your efforts? • What would it take to better link and leverage resources in your area? • What stakeholders need to be involved in collaborative efforts?
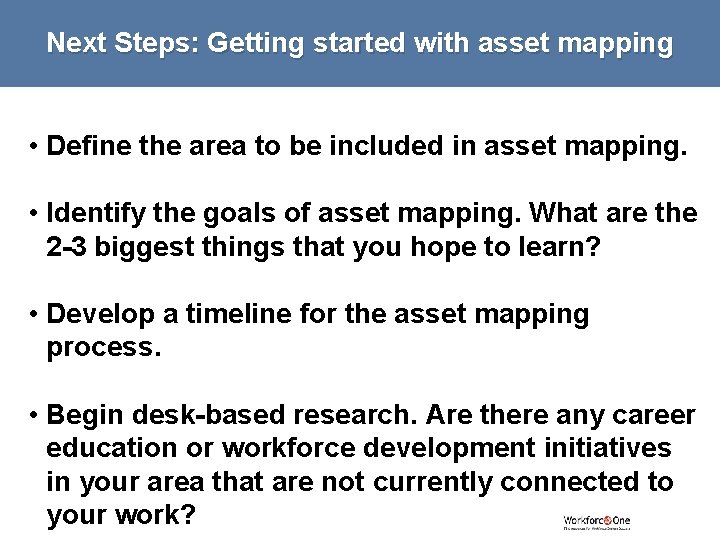
Next Steps: Getting started with asset mapping • Define the area to be included in asset mapping. • Identify the goals of asset mapping. What are the 2 -3 biggest things that you hope to learn? • Develop a timeline for the asset mapping process. • Begin desk-based research. Are there any career education or workforce development initiatives in your area that are not currently connected to your work?
Presenter Gretchen Sullivan Senior Consultant Maher & Maher Have a question or comment about WIOA? Email: DOL. WIOA@dol. gov
Defining Our Terms • Align: Identify and coordinate different, complementary funding sources and other resources to support shared goals and strategies • Braid: Weave together different federal, state, and other funding streams to support comprehensive and integrated service delivery that is seamless for the customer o Vs. “Blend”: Pooling resources from multiple sources into one “pot” • Significant flexibility, but may be more challenging
Thinking in Resource Networks • Making the shift: o Resource-constraint model: Customers are “owned” and served by an individual agency or program o Resource-opportunity model: Customers are “owned” and served by a networked system of resources and services o Partnering and resource-braiding: Not just the “right thing to do, ” but an opportunity to increase program and customer outcomes • Creating more success stories
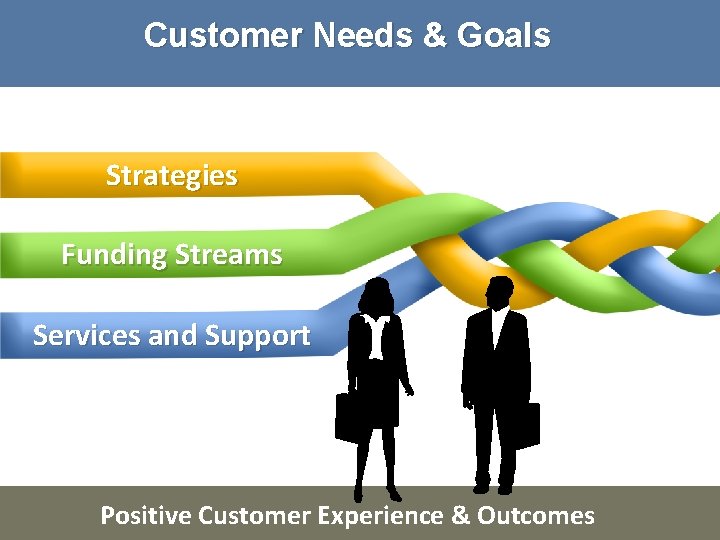
Customer Needs & Goals Strategies Funding Streams Services and Support Positive Customer Experience & Outcomes
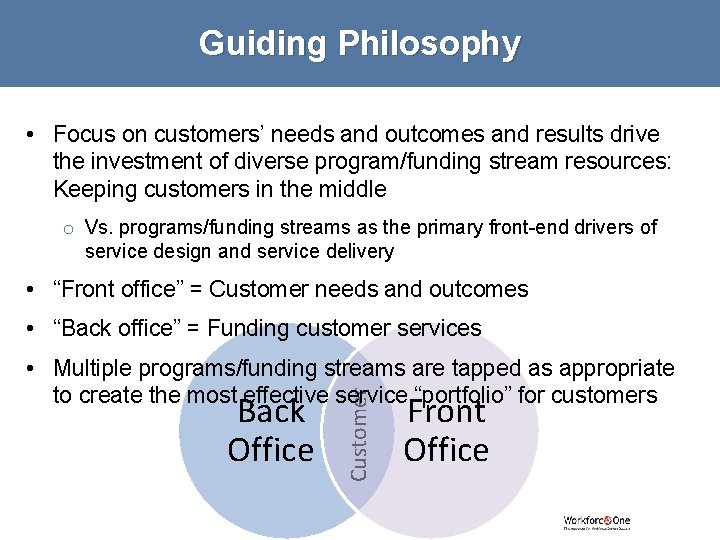
Guiding Philosophy • Focus on customers’ needs and outcomes and results drive the investment of diverse program/funding stream resources: Keeping customers in the middle o Vs. programs/funding streams as the primary front-end drivers of service design and service delivery • “Front office” = Customer needs and outcomes • “Back office” = Funding customer services Back Office Customer • Multiple programs/funding streams are tapped as appropriate to create the most effective service “portfolio” for customers Front Office
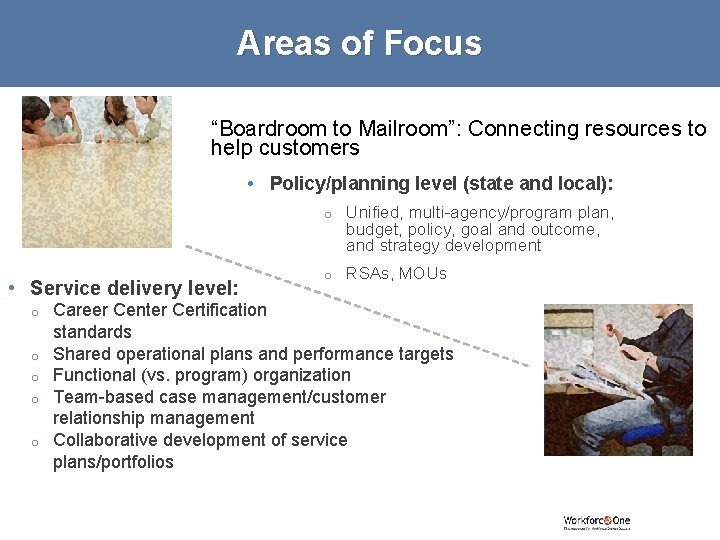
Areas of Focus “Boardroom to Mailroom”: Connecting resources to help customers • Policy/planning level (state and local): • Service delivery level: o o o Unified, multi-agency/program plan, budget, policy, goal and outcome, and strategy development o RSAs, MOUs Career Center Certification standards Shared operational plans and performance targets Functional (vs. program) organization Team-based case management/customer relationship management Collaborative development of service plans/portfolios
Why? Key Benefits • To organization: o Improves coordination and alignment among partners o Reduces duplication and realizes efficiencies o Expands capacity in resource-short environments o Brings additional staff strengths and expertise to customers o Increases flexibility in service planning o Improves program impacts and outcomes o Supports scalability, sustainability, and new investment • To customer: o Improves system accessibility, transparency, and ease of use o Offers more creative/diverse service delivery options o Brings additional staff expertise and assistance to customer needs o Improves customer experience and value o Improves customer outcomes/results
WIOA: Opportunities for Resource Alignment and Braiding • Multi-program, unified state strategic planning • Increased emphasis on Board role in aligning and coordinating workforce programs • Collaborative planning and service strategies on a regional level • Enhanced flexibility in funding and service design • Integrated intake, assessment, and service delivery • Elimination of “sequence of service” • Partner co-location and dedicated funding from Career Center partners for shared costs • Support for “pay for performance” • Aligned performance indicators across expanded “core” programs
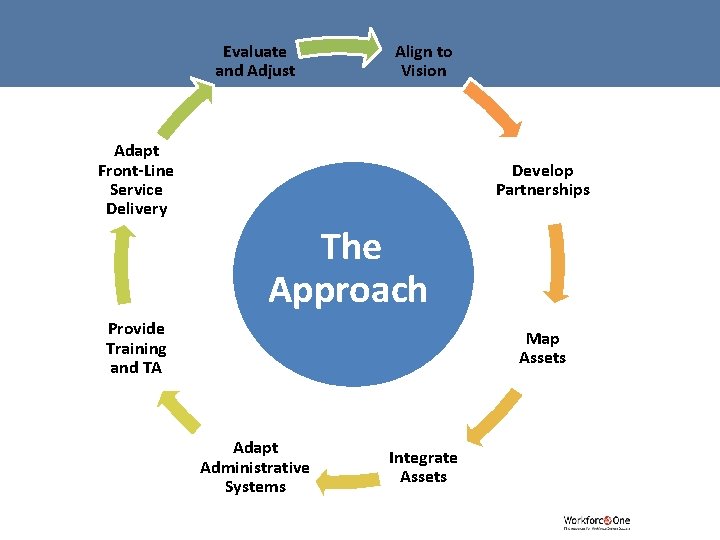
Evaluate and Adjust Align to Vision Adapt Front-Line Service Delivery Develop Partnerships The Approach Provide Training and TA Map Assets Adapt Administrative Systems Integrate Assets
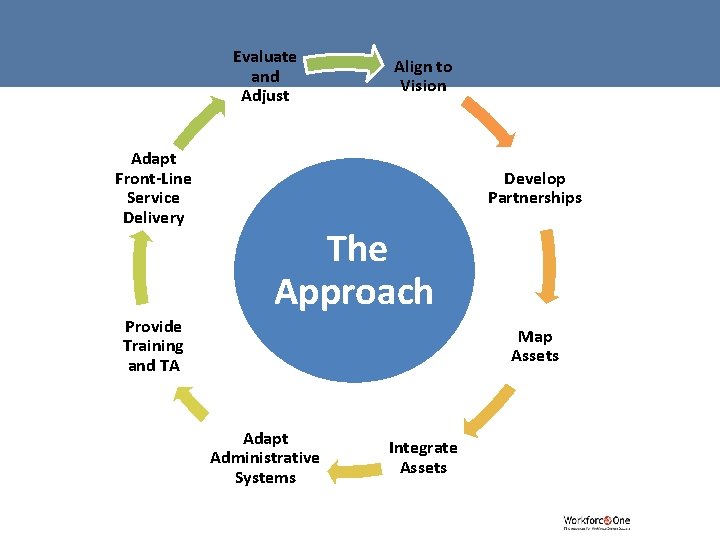
Evaluate and Adjust Adapt Front-Line Service Delivery Align to Vision Develop Partnerships The Approach Provide Training and TA Map Assets Adapt Administrative Systems Integrate Assets
Align to the Vision • Policy level: o At the agency/organizational level, craft or refine a clear vision for collaboration and service improvement that reflects agreement among partners on shared goals and strategies for individual and employer customers • Service delivery level: o At the front-line level (e. g. , Career Center), craft or refine an operational vision that sets expectations for shared service planning and delivery and integrated resource use
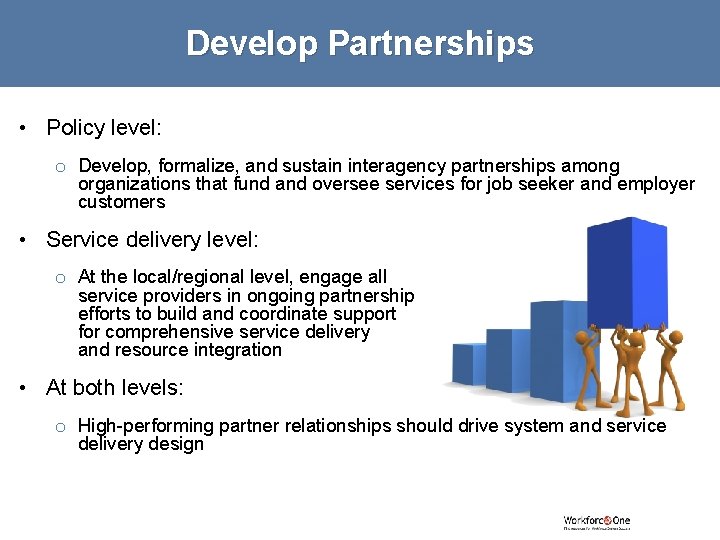
Develop Partnerships • Policy level: o Develop, formalize, and sustain interagency partnerships among organizations that fund and oversee services for job seeker and employer customers • Service delivery level: o At the local/regional level, engage all service providers in ongoing partnership efforts to build and coordinate support for comprehensive service delivery and resource integration • At both levels: o High-performing partner relationships should drive system and service delivery design
Map Assets • Policy level: o Identify the range of federal, state, and local program resources available for braiding o Identify gaps/need areas o Share guidance on the strategies, activities, and services for which various resource streams may be utilized • Service delivery level: o Map the full range of assets (funding and other resources) that can be aligned and braided for local/regional strategies and services • By customer group and service/activity type o Identify gaps/need areas
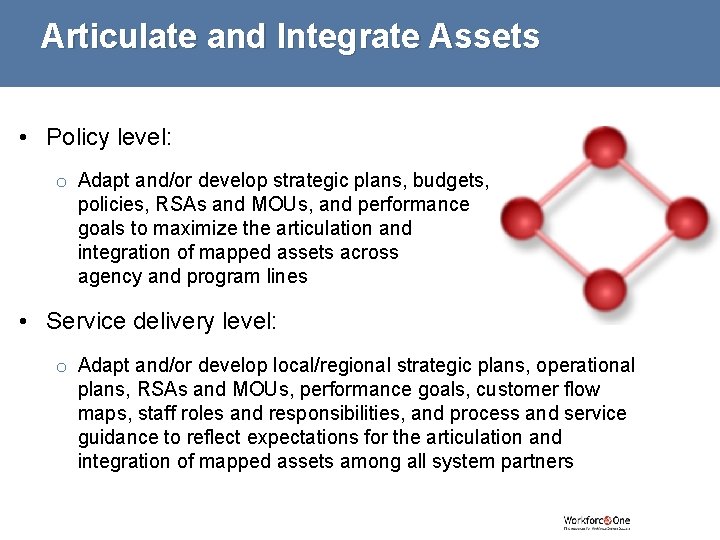
Articulate and Integrate Assets • Policy level: o Adapt and/or develop strategic plans, budgets, policies, RSAs and MOUs, and performance goals to maximize the articulation and integration of mapped assets across agency and program lines • Service delivery level: o Adapt and/or develop local/regional strategic plans, operational plans, RSAs and MOUs, performance goals, customer flow maps, staff roles and responsibilities, and process and service guidance to reflect expectations for the articulation and integration of mapped assets among all system partners
Adapt Administrative Structures • Policy level: o Adapt state-level administrative processes and systems as necessary to support resource coordination and use, information sharing, and tracking of outcomes and cost savings • Service delivery level: o Adapt local-level administrative processes and systems as necessary to support resource coordination and use, information sharing, and tracking of outcomes and cost savings • Keep in mind: o Partnerships – not administrative structures – come first o Administrative adaptations should not delay system and service delivery improvements
Provide Training and TA • Policy level: o Identify management training and development needs and develop and provide ongoing statesponsored technical assistance and cross-training o Identify opportunities for peer mentoring and exchange among workforce areas throughout the state • Service delivery level: o Identify front-line staff training and development needs and develop and provide ongoing local/regional technical assistance and crosstraining o Identify opportunities for peer mentoring and exchange among various program staff in the workforce area
Adapt Front-Line Service Delivery • Policy level: o Provide staff with service delivery and funding empowerment, guidance, and support to enable integrated and braided front-line service delivery • Service delivery level: o Adopt common intake, assessment, and team-based/functional service planning and case management/customer relationship management models o Provide simultaneous, vs. sequential, program services, coordinated among multiple partners o Integrate orientations, workshops, classes, etc. to bring together customers served by different/multiple programs
Evaluate and Adjust • Policy level: o Review relevant performance, cost, customer feedback data, and management/staff input to evaluate impacts and effectiveness and adjust/refine strategies and activities as necessary • Service delivery level: o Review relevant performance, cost, customer feedback data, and staff input to evaluate impacts and effectiveness and adjust/refine strategies and activities as necessary
Additional Resources • Jobs for the Future’s Braided Funding Toolkit: http: //application. jff. org/ • Center for Law and Social Policy’s Federal Funding for Integrated Service Delivery Toolkit: http: //www. clasp. org/resources-and-publications/files/CWF_ALL. pdf • National Collaborative on Workforce and Disability’s brief, “Blending and Braiding Funds and Resources: The Intermediary as Facilitator”: http: //www. ncwd-youth. info/informationbrief-18 • January 2016 WIOA National Convening Braiding and Leveraging Resources materials: https: //wioa. workforce 3 one. org/page/resource/1001602548371806285 • National Technical Assistance and Research Center to Promote Leadership for Increasing the Employment and Economic Independence for Adults with Disabilities’ paper, “Using Braided Funding Strategies to Advance Employer Hiring Initiatives that Include People with Disabilities”: http: //www. dol. gov/odep/pdf/Braided. FSReport. pdf
Thank You! Find resources for workforce system success at: www. workforce 3 one. org
www. workforce 3 one. org
- Slides: 55