
Welcome to the Greater Yellowstone Ecosystem GYE It


- Slides: 60
Welcome to the Greater Yellowstone Ecosystem (GYE)
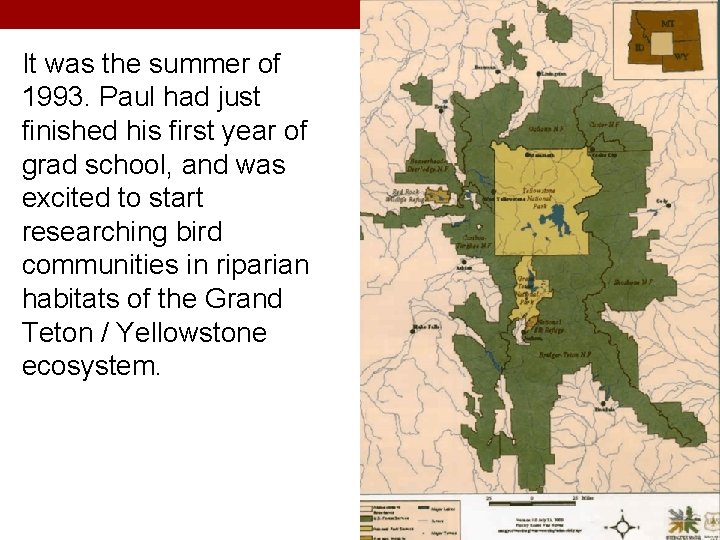
It was the summer of 1993. Paul had just finished his first year of grad school, and was excited to start researching bird communities in riparian habitats of the Grand Teton / Yellowstone ecosystem.
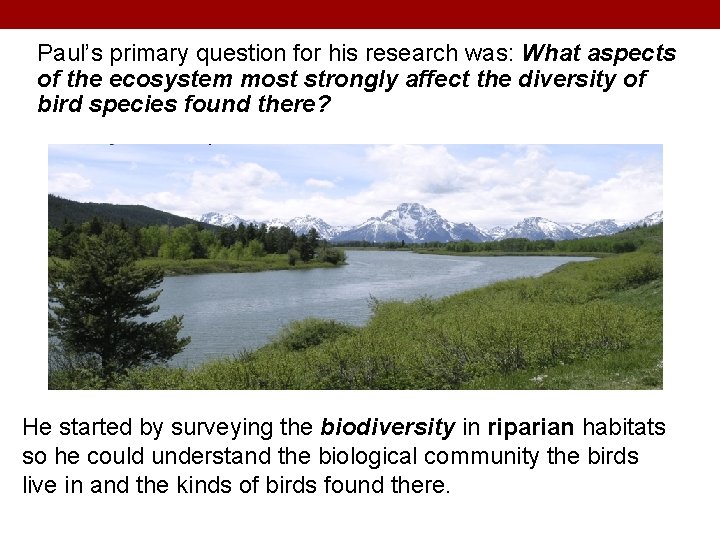
Paul’s primary question for his research was: What aspects of the ecosystem most strongly affect the diversity of bird species found there? He started by surveying the biodiversity in riparian habitats so he could understand the biological community the birds live in and the kinds of birds found there.
Q 1: Riparian habitats are: A. B. C. D. E. High altitude mountain habitats. Terrestrial habitats adjacent to rivers and streams. Lake habitats. A forest-type habitat found in western North America. A type of grassland habitat.
Q 2: What do you think Paul will find are the aspects of the ecosystem that most strongly affect the diversity of bird species found there? Available food for the birds. B. Number of predators of birds. C. Number of trees that provide nest sites for the birds. D. Something else. A.
Ecosystem Survey The first part of Paul’s research included a survey of all of the organisms that live in the bird’s ecosystem. Ecosystem – all of the organisms in an ecological community as well as the physical and chemical factors that influence those organisms. Ecosystems include both biotic and abiotic components Community - all of the populations of species that co-exist and interact within a defined area Population – all of the individuals of a species that interact with one another within a given area at a particular time
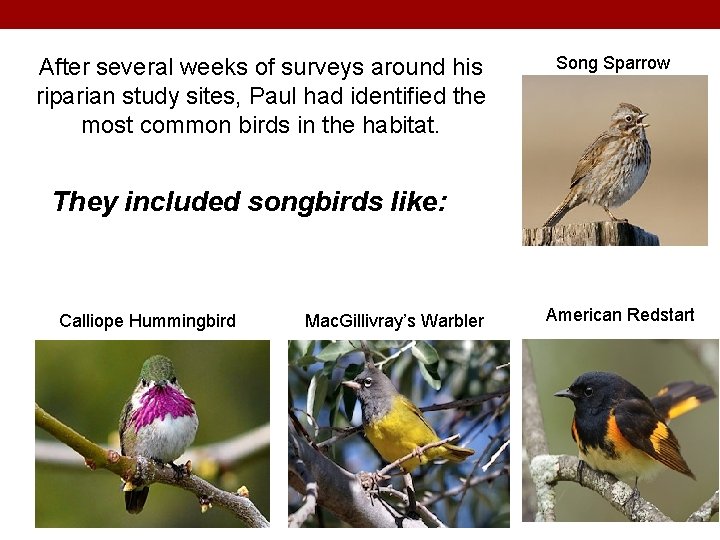
After several weeks of surveys around his riparian study sites, Paul had identified the most common birds in the habitat. Song Sparrow They included songbirds like: Calliope Hummingbird Mac. Gillivray’s Warbler American Redstart
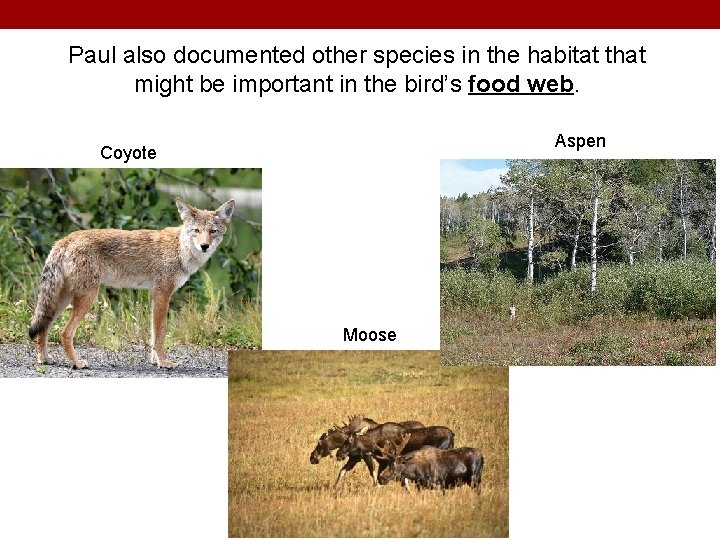
Paul also documented other species in the habitat that might be important in the bird’s food web. Aspen Coyote Moose
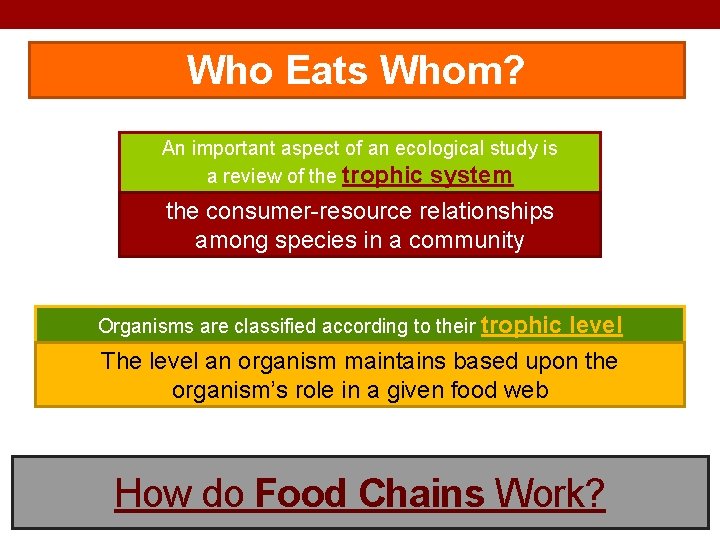
Who Eats Whom? An important aspect of an ecological study is a review of the trophic system the consumer-resource relationships among species in a community Organisms are classified according to their trophic level The level an organism maintains based upon the organism’s role in a given food web How do Food Chains Work?
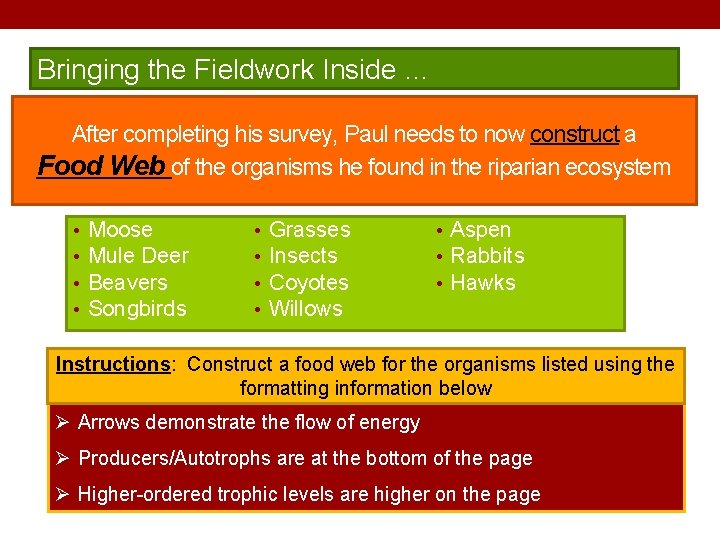
Bringing the Fieldwork Inside … After completing his survey, Paul needs to now construct a Food Web of the organisms he found in the riparian ecosystem • • Moose Mule Deer Beavers Songbirds • • Grasses Insects Coyotes Willows • Aspen • Rabbits • Hawks Instructions: Construct a food web for the organisms listed using the formatting information below Ø Arrows demonstrate the flow of energy Ø Producers/Autotrophs are at the bottom of the page Ø Higher-ordered trophic levels are higher on the page
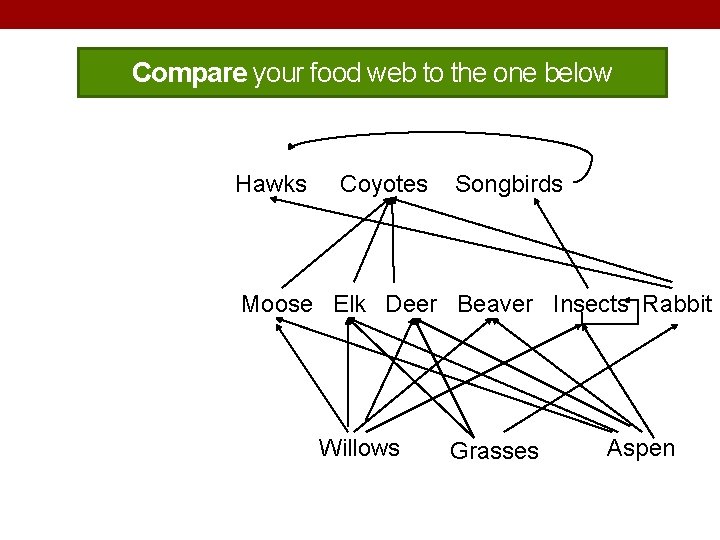
Compare your food web to the one below SECONDARY CONSUMERS Hawks PRIMARY CONSUMERS Moose Elk Deer Beaver Insects Rabbit PRIMARY PRODUCERS Coyotes Willows Songbirds Grasses Aspen
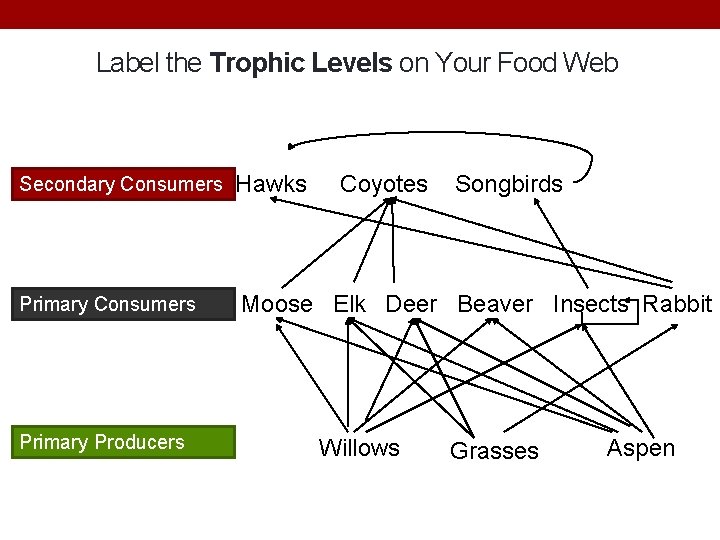
Label the Trophic Levels on Your Food Web Secondary Consumers SECONDARY Hawks Coyotes Songbirds CONSUMERS Primary Consumers PRIMARY Moose Elk Deer Beaver Insects Rabbit CONSUMERS Primary Producers PRIMARY PRODUCERS Willows Grasses Aspen
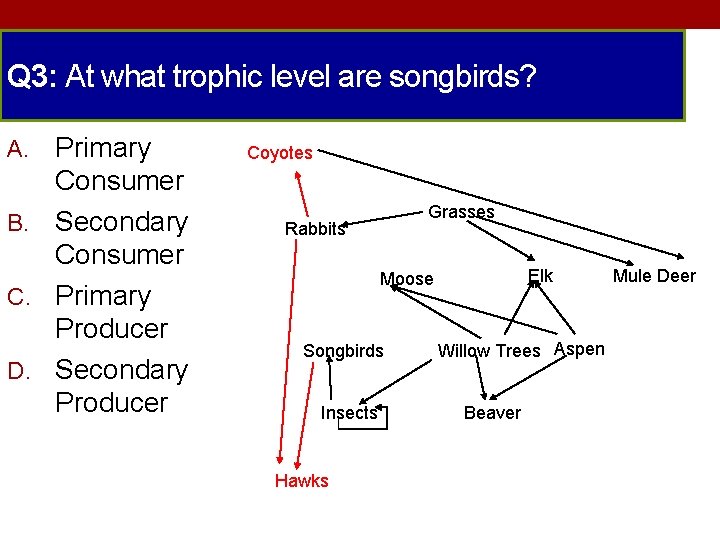
Q 3: At what trophic level are songbirds? Primary Consumer B. Secondary Consumer C. Primary Producer D. Secondary Producer A. Coyotes Grasses Rabbits Elk Moose Songbirds Insects Hawks Willow Trees Aspen Beaver Mule Deer
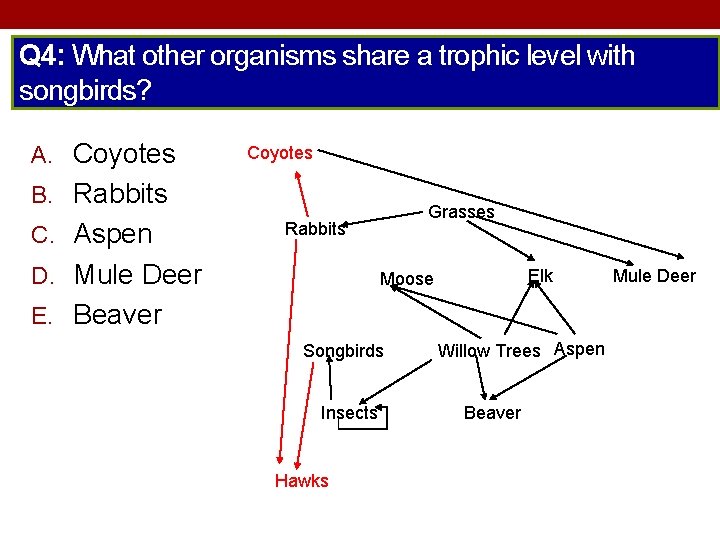
Q 4: What other organisms share a trophic level with songbirds? A. Coyotes B. Rabbits C. Aspen Grasses Rabbits D. Mule Deer Elk Moose E. Beaver Songbirds Insects Hawks Willow Trees Aspen Beaver Mule Deer
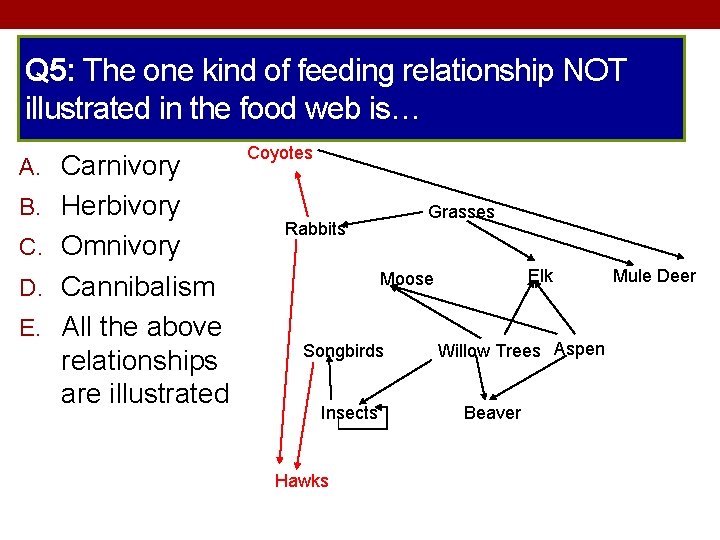
Q 5: The one kind of feeding relationship NOT illustrated in the food web is… A. Carnivory B. Herbivory C. Omnivory Coyotes Rabbits relationships are illustrated Elk Moose D. Cannibalism E. All the above Grasses Songbirds Insects Hawks Willow Trees Aspen Beaver Mule Deer
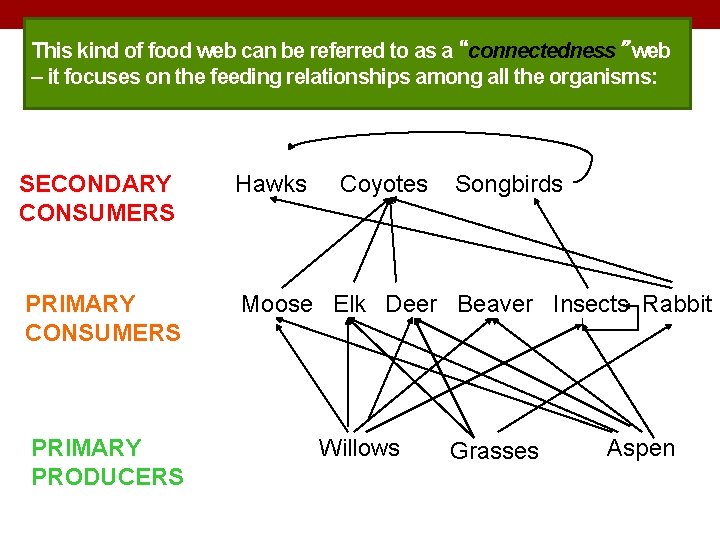
This kind of food web can be referred to as a “connectedness” web – it focuses on the feeding relationships among all the organisms: SECONDARY CONSUMERS Hawks PRIMARY CONSUMERS Moose Elk Deer Beaver Insects Rabbit PRIMARY PRODUCERS Coyotes Willows Songbirds Grasses Aspen
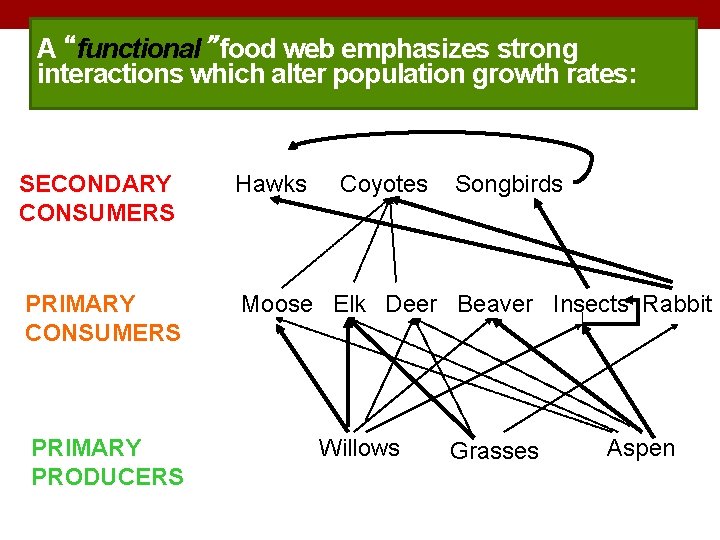
A “functional” food web emphasizes strong interactions which alter population growth rates: SECONDARY CONSUMERS Hawks PRIMARY CONSUMERS Moose Elk Deer Beaver Insects Rabbit PRIMARY PRODUCERS Coyotes Willows Songbirds Grasses Aspen
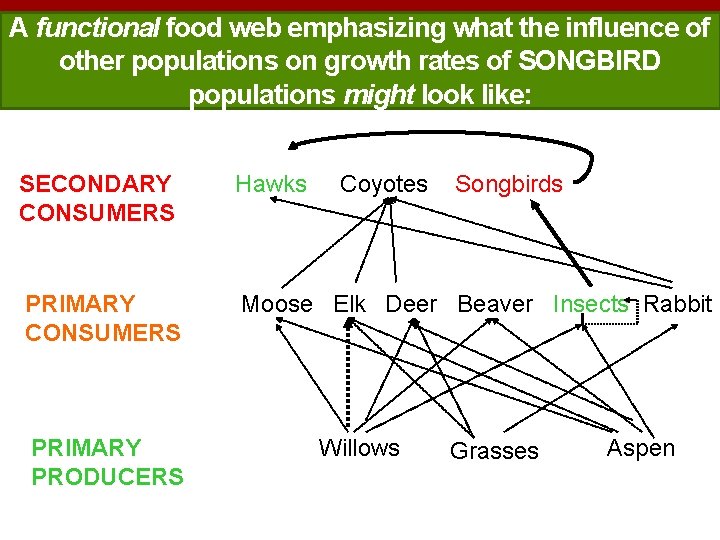
A functional food web emphasizing what the influence of other populations on growth rates of SONGBIRD populations might look like: SECONDARY CONSUMERS Hawks PRIMARY CONSUMERS Moose Elk Deer Beaver Insects Rabbit PRIMARY PRODUCERS Coyotes Willows Songbirds Grasses Aspen
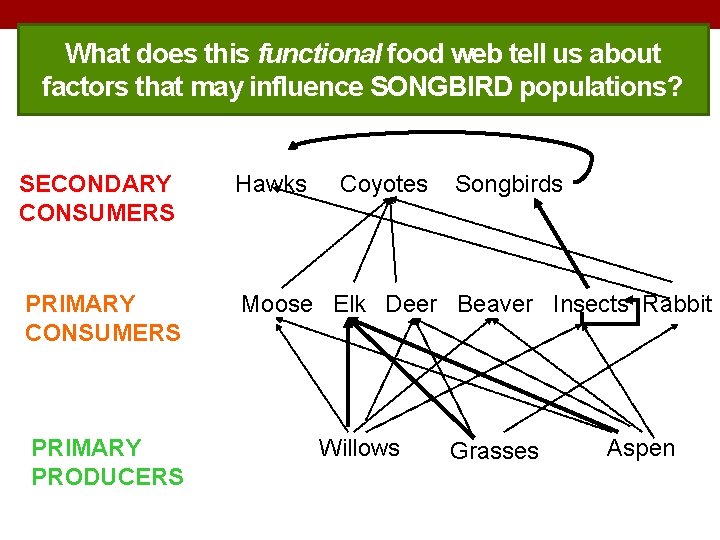
What does this functional food web tell us about factors that may influence SONGBIRD populations? SECONDARY CONSUMERS Hawks PRIMARY CONSUMERS Moose Elk Deer Beaver Insects Rabbit PRIMARY PRODUCERS Coyotes Willows Songbirds Grasses Aspen
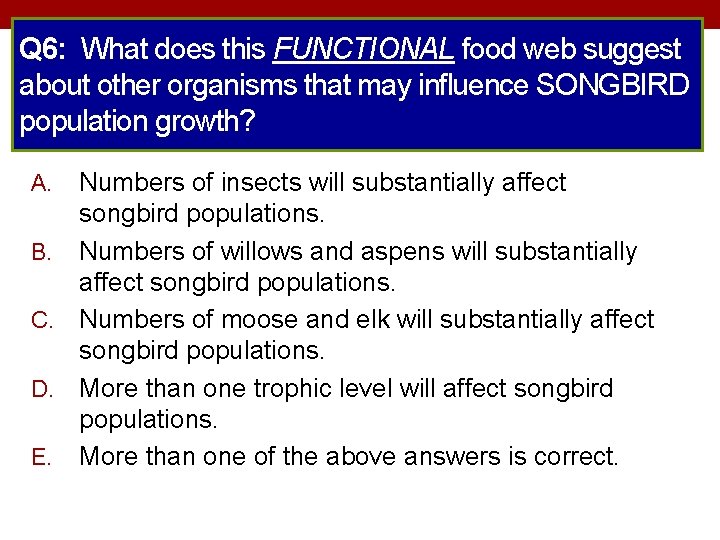
Q 6: What does this FUNCTIONAL food web suggest about other organisms that may influence SONGBIRD population growth? Numbers of insects will substantially affect songbird populations. B. Numbers of willows and aspens will substantially affect songbird populations. C. Numbers of moose and elk will substantially affect songbird populations. D. More than one trophic level will affect songbird populations. E. More than one of the above answers is correct. A.
Review the concepts behind the Major Trophic Levels
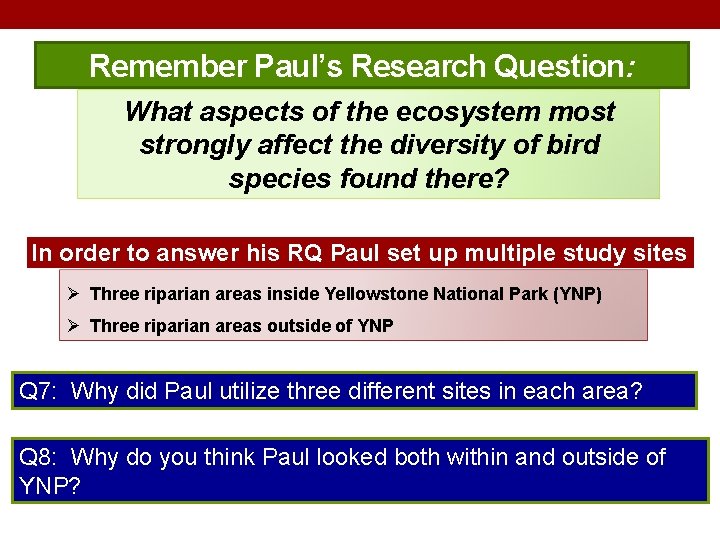
Remember Paul’s Research Question: What aspects of the ecosystem most strongly affect the diversity of bird species found there? In order to answer his RQ Paul set up multiple study sites Ø Three riparian areas inside Yellowstone National Park (YNP) Ø Three riparian areas outside of YNP Q 7: Why did Paul utilize three different sites in each area? Q 8: Why do you think Paul looked both within and outside of YNP?
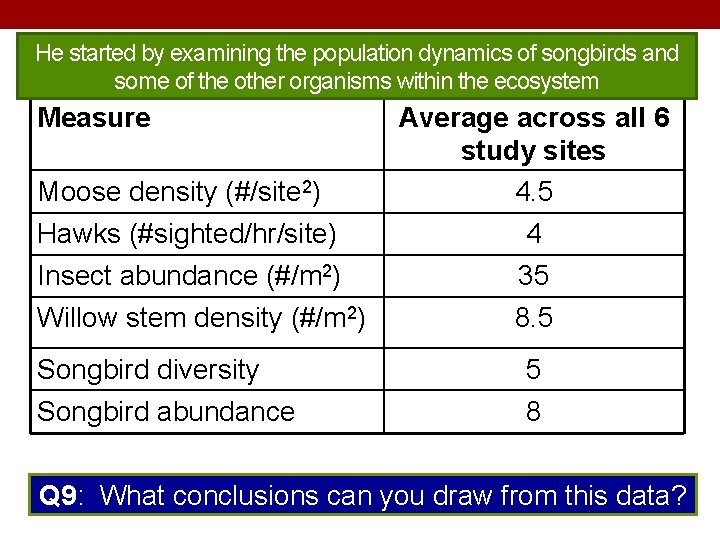
He started by examining the population dynamics of songbirds and some of the other organisms within the ecosystem Measure Moose density (#/site 2) Average across all 6 study sites 4. 5 Hawks (#sighted/hr/site) 4 Insect abundance (#/m 2) Willow stem density (#/m 2) 35 8. 5 Songbird diversity 5 Songbird abundance 8 Q 9: What conclusions can you draw from this data?
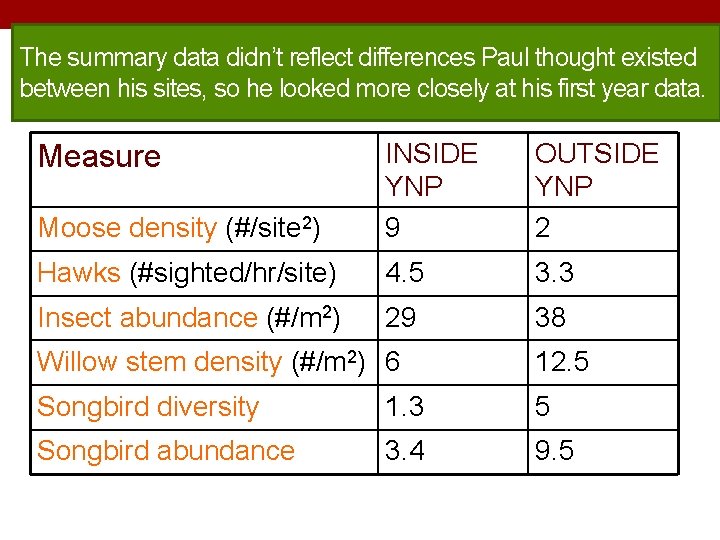
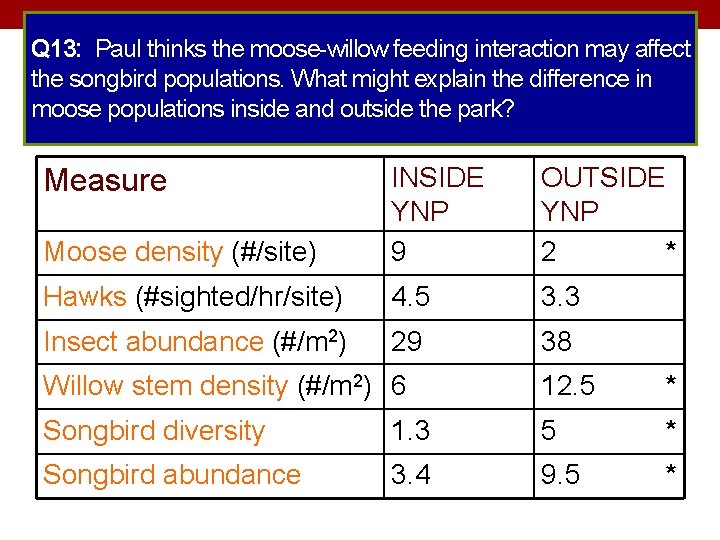
The summary data didn’t reflect differences Paul thought existed between his sites, so he looked more closely at his first year data. Moose density (#/site 2) INSIDE YNP 9 OUTSIDE YNP 2 Hawks (#sighted/hr/site) 4. 5 3. 3 Insect abundance (#/m 2) 29 38 Measure Willow stem density (#/m 2) 6 12. 5 Songbird diversity 1. 3 5 Songbird abundance 3. 4 9. 5
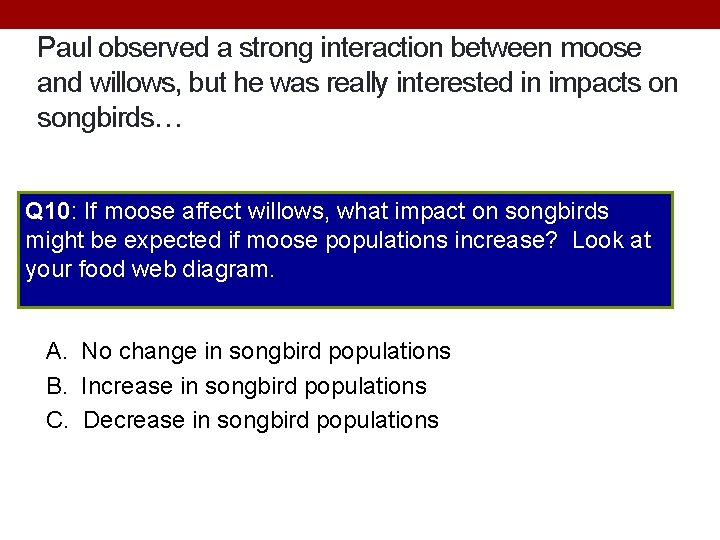
Paul observed a strong interaction between moose and willows, but he was really interested in impacts on songbirds… Q 10: If moose affect willows, what impact on songbirds might be expected if moose populations increase? Look at your food web diagram. A. No change in songbird populations B. Increase in songbird populations C. Decrease in songbird populations
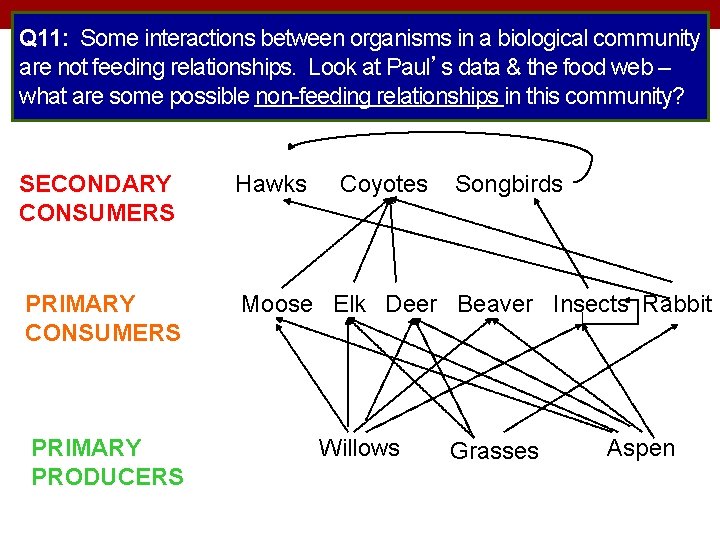
Q 11: Some interactions between organisms in a biological community are not feeding relationships. Look at Paul’s data & the food web – what are some possible non-feeding relationships in this community? SECONDARY CONSUMERS Hawks PRIMARY CONSUMERS Moose Elk Deer Beaver Insects Rabbit PRIMARY PRODUCERS Coyotes Willows Songbirds Grasses Aspen
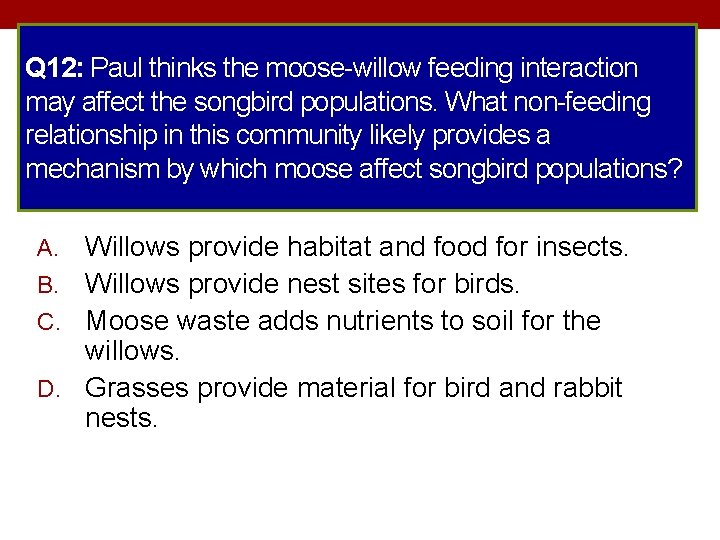
Q 12: Paul thinks the moose-willow feeding interaction may affect the songbird populations. What non-feeding relationship in this community likely provides a mechanism by which moose affect songbird populations? Willows provide habitat and food for insects. B. Willows provide nest sites for birds. C. Moose waste adds nutrients to soil for the willows. D. Grasses provide material for bird and rabbit nests. A.
Q 13: Paul thinks the moose-willow feeding interaction may affect the songbird populations. What might explain the difference in moose populations inside and outside the park? Moose density (#/site) INSIDE YNP 9 OUTSIDE YNP 2 * Hawks (#sighted/hr/site) 4. 5 3. 3 Insect abundance (#/m 2) 29 38 Measure Willow stem density (#/m 2) 6 12. 5 * Songbird diversity 1. 3 5 * Songbird abundance 3. 4 9. 5 *
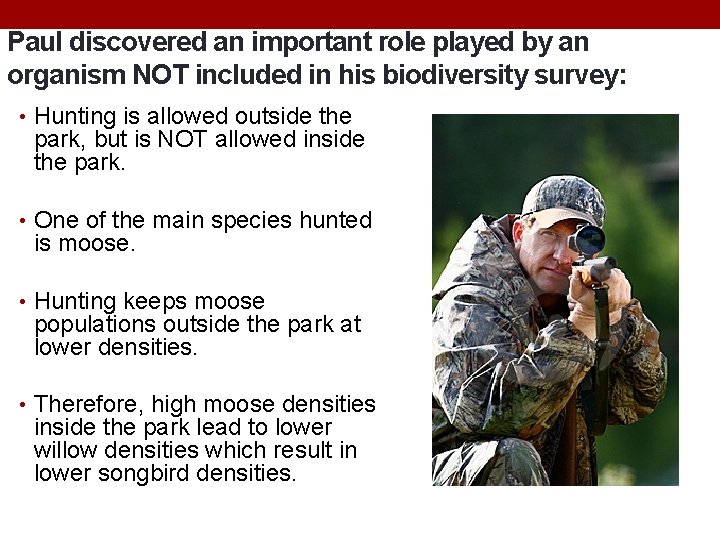
Paul discovered an important role played by an organism NOT included in his biodiversity survey: • Hunting is allowed outside the park, but is NOT allowed inside the park. • One of the main species hunted is moose. • Hunting keeps moose populations outside the park at lower densities. • Therefore, high moose densities inside the park lead to lower willow densities which result in lower songbird densities.
Research builds …. Ø While Paul’s research suggested that moose impacted willow in the GYE he was also aware that the moose population was only in the hundreds in the larger park and he wondered if there might be other factors also affecting the ecosystem. Ø Paul knew that other research was being conducted by some GYE scientists. Ø One major observation was that another tree species, Quaking aspen (Populus tremeuloides), seemed to be in decline in Yellowstone National Park (YNP).
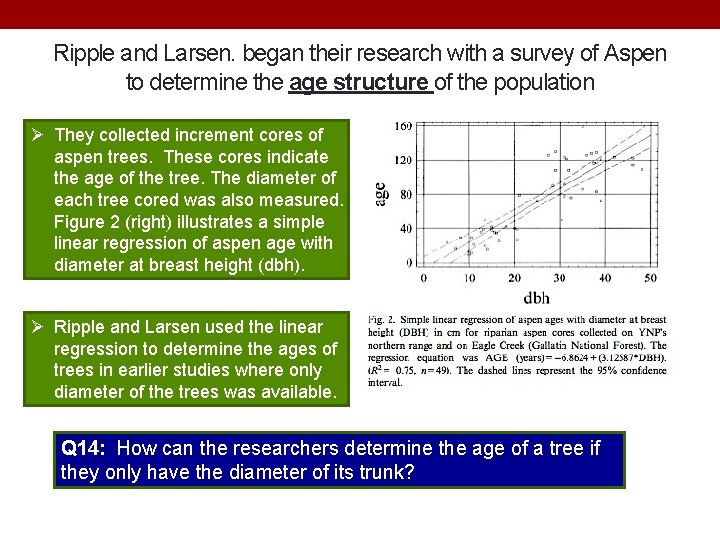
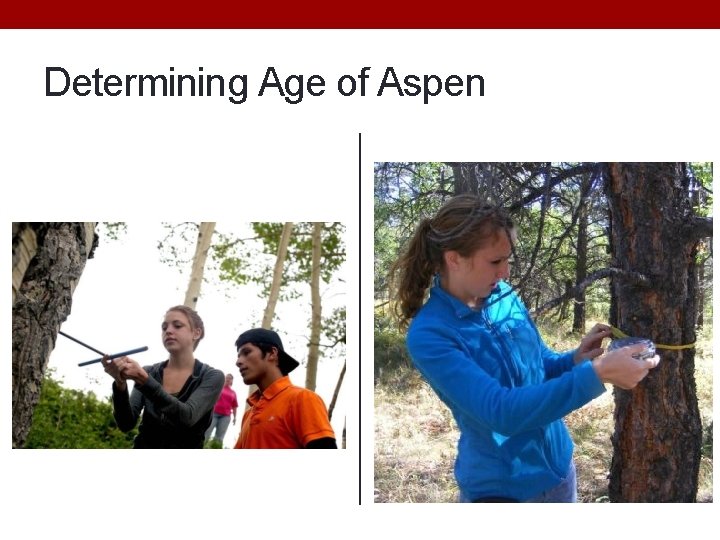
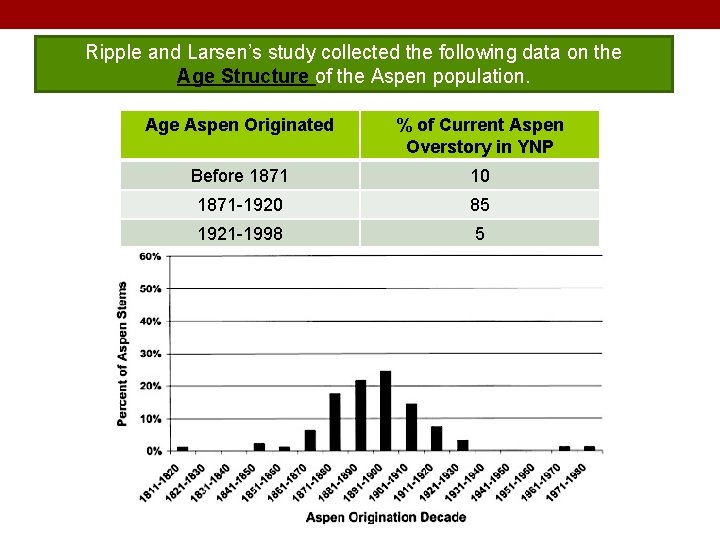
Ripple and Larsen. began their research with a survey of Aspen to determine the age structure of the population Ø They collected increment cores of aspen trees. These cores indicate the age of the tree. The diameter of each tree cored was also measured. Figure 2 (right) illustrates a simple linear regression of aspen age with diameter at breast height (dbh). Ø Ripple and Larsen used the linear regression to determine the ages of trees in earlier studies where only diameter of the trees was available. Q 14: How can the researchers determine the age of a tree if they only have the diameter of its trunk?
Determining Age of Aspen
Ripple and Larsen’s study collected the following data on the Age Structure of the Aspen population. Age Aspen Originated % of Current Aspen Overstory in YNP Before 1871 10 1871 -1920 85 1921 -1998 5
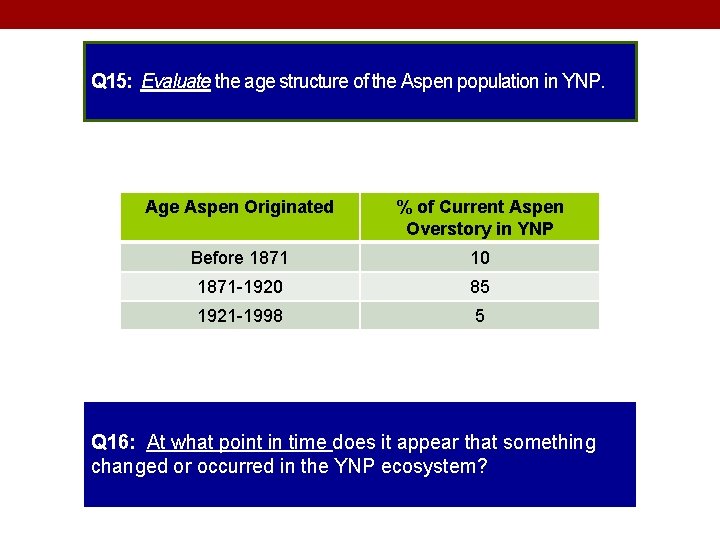
Q 15: Evaluate the age structure of the Aspen population in YNP. Age Aspen Originated % of Current Aspen Overstory in YNP Before 1871 10 1871 -1920 85 1921 -1998 5 Q 16: At what point in time does it appear that something changed or occurred in the YNP ecosystem?
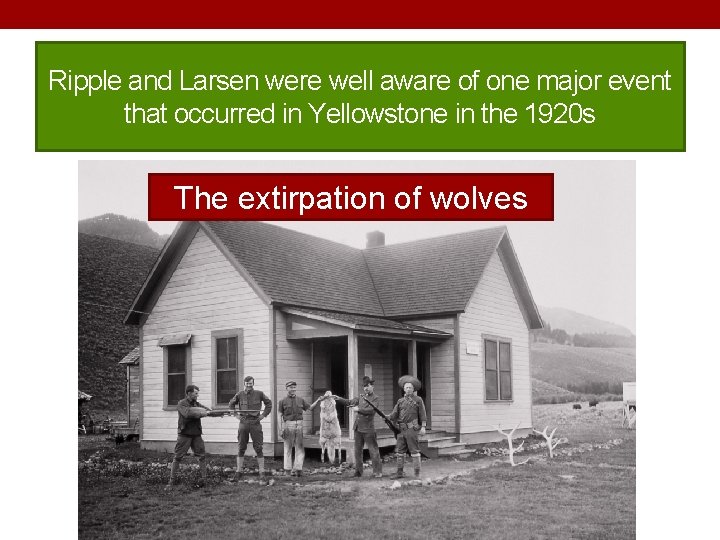
Ripple and Larsen were well aware of one major event that occurred in Yellowstone in the 1920 s The extirpation of wolves
Q 17: We now have seen that 2 species of vegetation seem to be in decline in YNP. Return to your Food Web. Predict which species in the food web would be affected by a decrease in willow AND aspen and predict how each population would be affected.
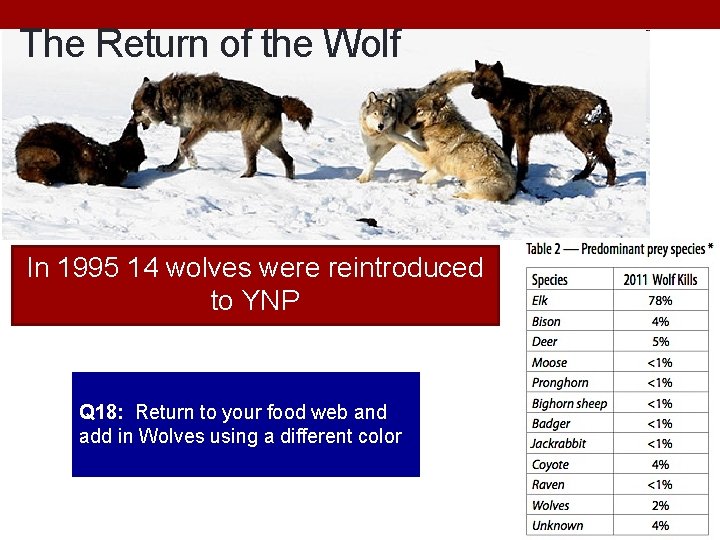
The Return of the Wolf In 1995 14 wolves were reintroduced to YNP Q 18: Return to your food web and add in Wolves using a different color
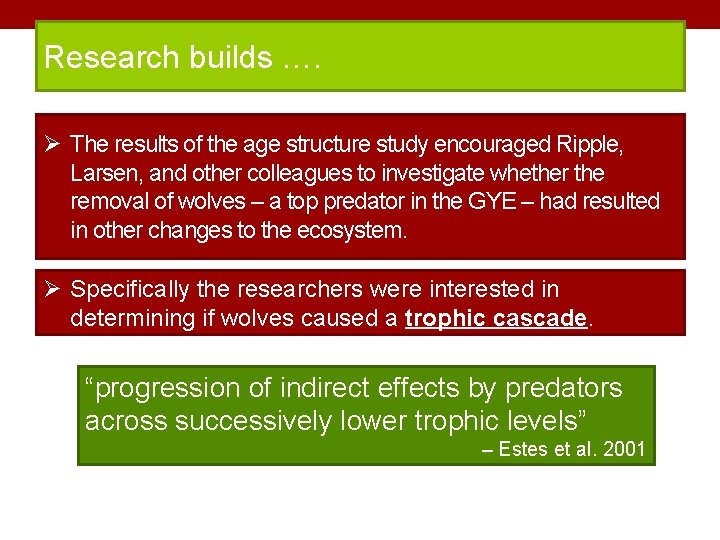
Research builds …. Ø The results of the age structure study encouraged Ripple, Larsen, and other colleagues to investigate whether the removal of wolves – a top predator in the GYE – had resulted in other changes to the ecosystem. Ø Specifically the researchers were interested in determining if wolves caused a trophic cascade. “progression of indirect effects by predators across successively lower trophic levels” – Estes et al. 2001
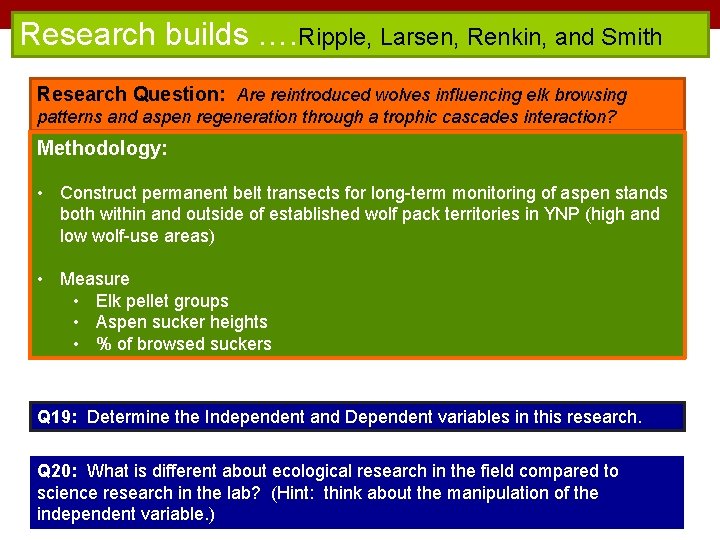
Research builds …. Ripple, Larsen, Renkin, and Smith Research Question: Are reintroduced wolves influencing elk browsing patterns and aspen regeneration through a trophic cascades interaction? Methodology: • Construct permanent belt transects for long-term monitoring of aspen stands both within and outside of established wolf pack territories in YNP (high and low wolf-use areas) • Measure • Elk pellet groups • Aspen sucker heights • % of browsed suckers Q 19: Determine the Independent and Dependent variables in this research. Q 20: What is different about ecological research in the field compared to science research in the lab? (Hint: think about the manipulation of the independent variable. )
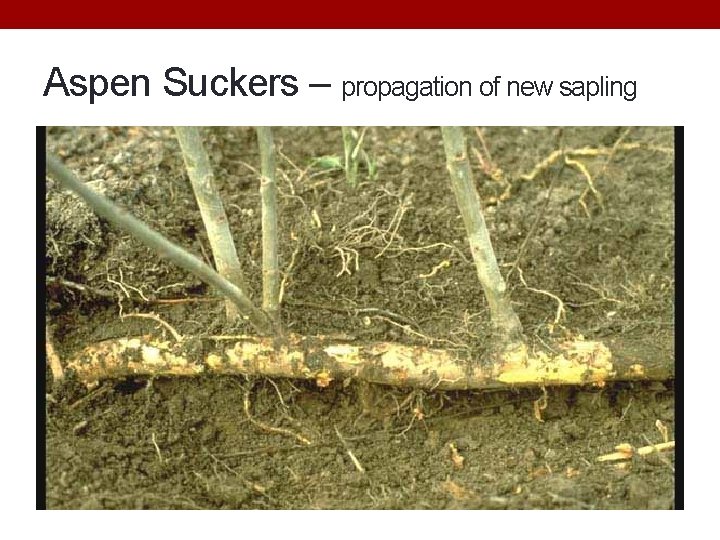
Aspen Suckers – propagation of new sapling
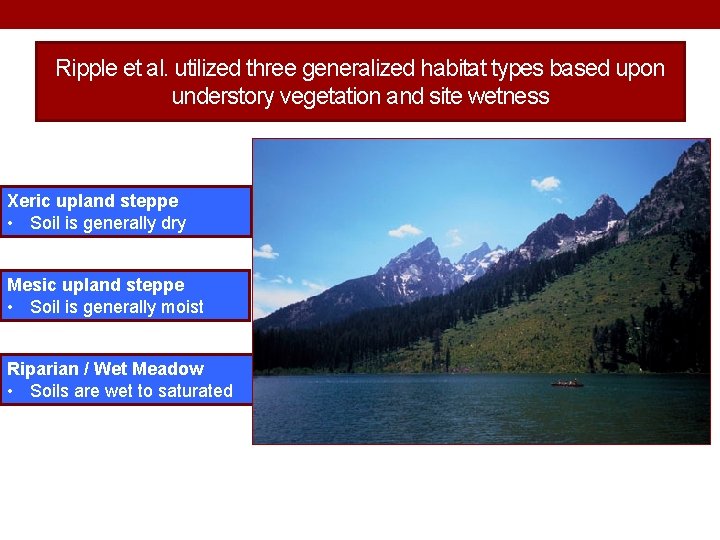
Ripple et al. utilized three generalized habitat types based upon understory vegetation and site wetness Xeric upland steppe • Soil is generally dry Mesic upland steppe • Soil is generally moist Riparian / Wet Meadow • Soils are wet to saturated
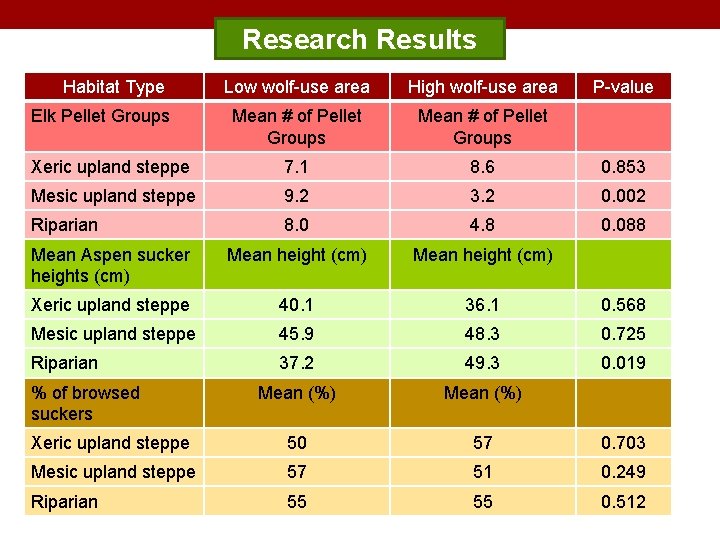
Research Results Habitat Type Low wolf-use area High wolf-use area Mean # of Pellet Groups Xeric upland steppe 7. 1 8. 6 0. 853 Mesic upland steppe 9. 2 3. 2 0. 002 Riparian 8. 0 4. 8 0. 088 Mean Aspen sucker heights (cm) Mean height (cm) Xeric upland steppe 40. 1 36. 1 0. 568 Mesic upland steppe 45. 9 48. 3 0. 725 Riparian 37. 2 49. 3 0. 019 Mean (%) Xeric upland steppe 50 57 0. 703 Mesic upland steppe 57 51 0. 249 Riparian 55 55 0. 512 Elk Pellet Groups % of browsed suckers P-value
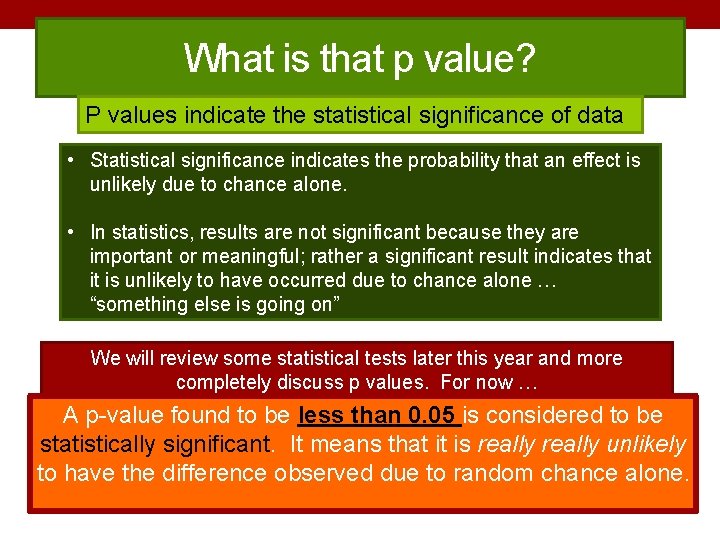
What is that p value? P values indicate the statistical significance of data • Statistical significance indicates the probability that an effect is unlikely due to chance alone. • In statistics, results are not significant because they are important or meaningful; rather a significant result indicates that it is unlikely to have occurred due to chance alone … “something else is going on” We will review some statistical tests later this year and more completely discuss p values. For now … A p-value found to be less than 0. 05 is considered to be statistically significant. It means that it is really unlikely to have the difference observed due to random chance alone.
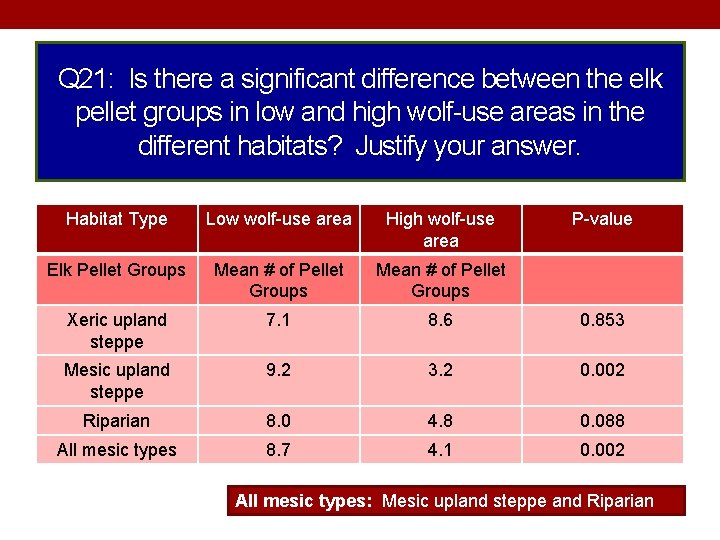
Q 21: Is there a significant difference between the elk pellet groups in low and high wolf-use areas in the different habitats? Justify your answer. Habitat Type Low wolf-use area High wolf-use area P-value Elk Pellet Groups Mean # of Pellet Groups Xeric upland steppe 7. 1 8. 6 0. 853 Mesic upland steppe 9. 2 3. 2 0. 002 Riparian 8. 0 4. 8 0. 088 All mesic types 8. 7 4. 1 0. 002 All mesic types: Mesic upland steppe and Riparian
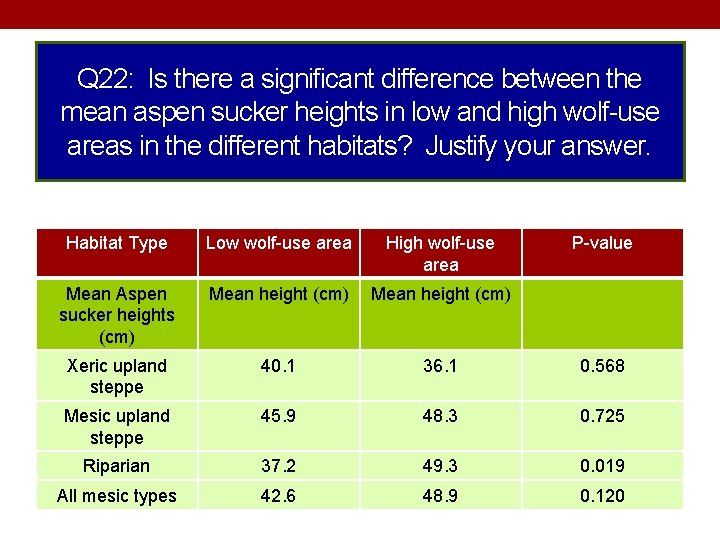
Q 22: Is there a significant difference between the mean aspen sucker heights in low and high wolf-use areas in the different habitats? Justify your answer. Habitat Type Low wolf-use area High wolf-use area P-value Mean Aspen sucker heights (cm) Mean height (cm) Xeric upland steppe 40. 1 36. 1 0. 568 Mesic upland steppe 45. 9 48. 3 0. 725 Riparian 37. 2 49. 3 0. 019 All mesic types 42. 6 48. 9 0. 120
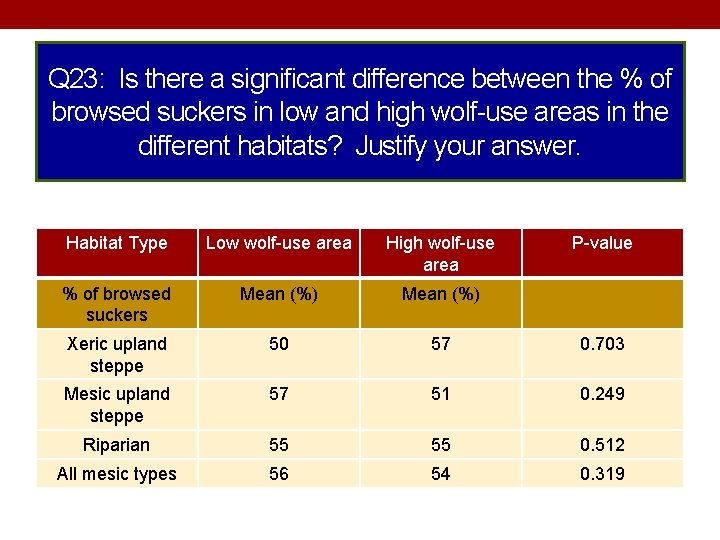
Q 23: Is there a significant difference between the % of browsed suckers in low and high wolf-use areas in the different habitats? Justify your answer. Habitat Type Low wolf-use area High wolf-use area P-value % of browsed suckers Mean (%) Xeric upland steppe 50 57 0. 703 Mesic upland steppe 57 51 0. 249 Riparian 55 55 0. 512 All mesic types 56 54 0. 319
Q 24: What overall conclusions can you draw from the research of Ripple et al. ?
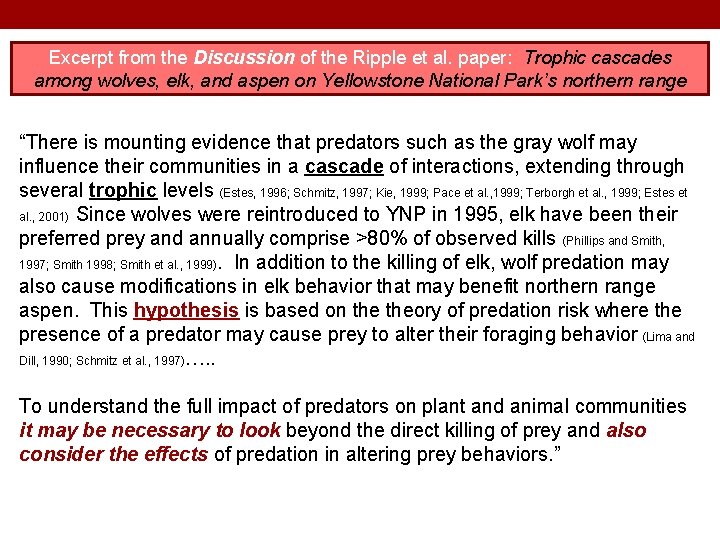
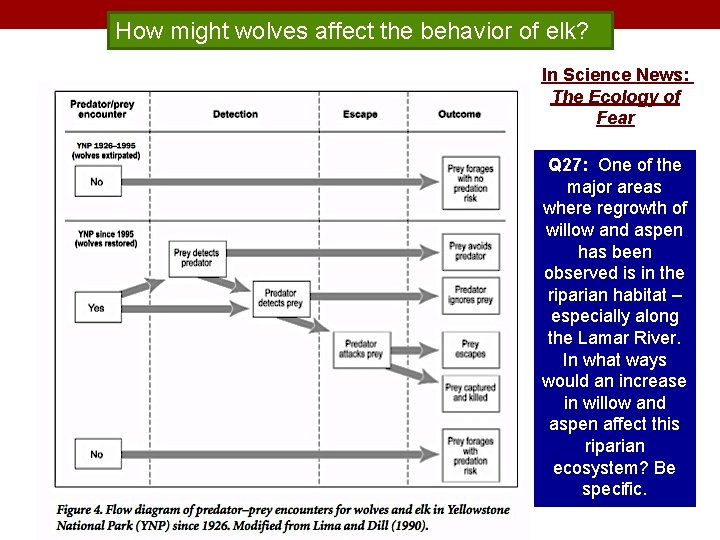
Excerpt from the Discussion of the Ripple et al. paper: Trophic cascades among wolves, elk, and aspen on Yellowstone National Park’s northern range “There is mounting evidence that predators such as the gray wolf may influence their communities in a cascade of interactions, extending through several trophic levels (Estes, 1996; Schmitz, 1997; Kie, 1999; Pace et al. , 1999; Terborgh et al. , 1999; Estes et al. , 2001) Since wolves were reintroduced to YNP in 1995, elk have been their preferred prey and annually comprise >80% of observed kills (Phillips and Smith, 1997; Smith 1998; Smith et al. , 1999). In addition to the killing of elk, wolf predation may also cause modifications in elk behavior that may benefit northern range aspen. This hypothesis is based on theory of predation risk where the presence of a predator may cause prey to alter their foraging behavior (Lima and Dill, 1990; Schmitz et al. , 1997)…. . To understand the full impact of predators on plant and animal communities it may be necessary to look beyond the direct killing of prey and also consider the effects of predation in altering prey behaviors. ”
So the Data Collection and Research Continues …
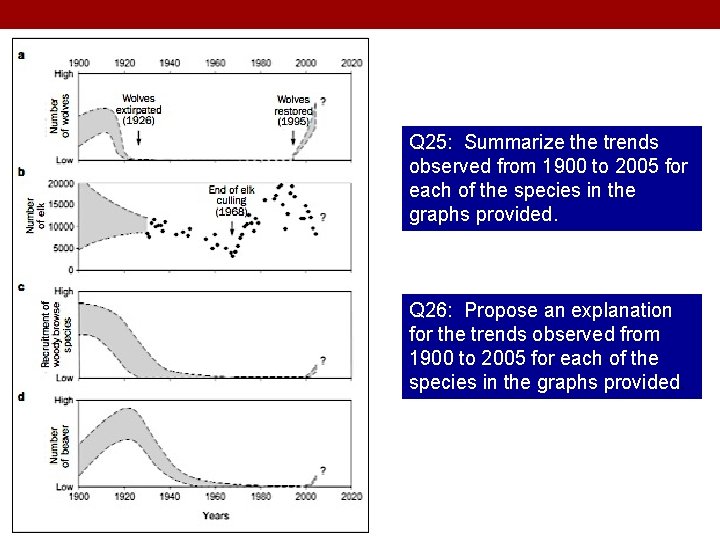
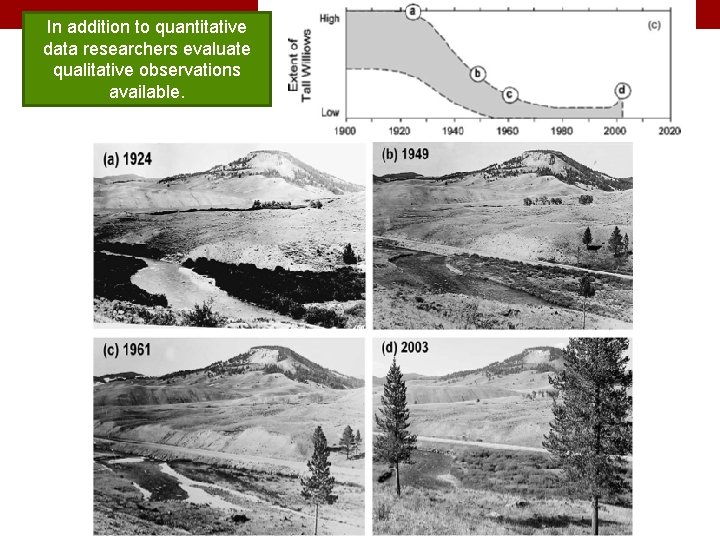
Q 25: Summarize the trends observed from 1900 to 2005 for each of the species in the graphs provided. Q 26: Propose an explanation for the trends observed from 1900 to 2005 for each of the species in the graphs provided.
In addition to quantitative data researchers evaluate qualitative observations available.
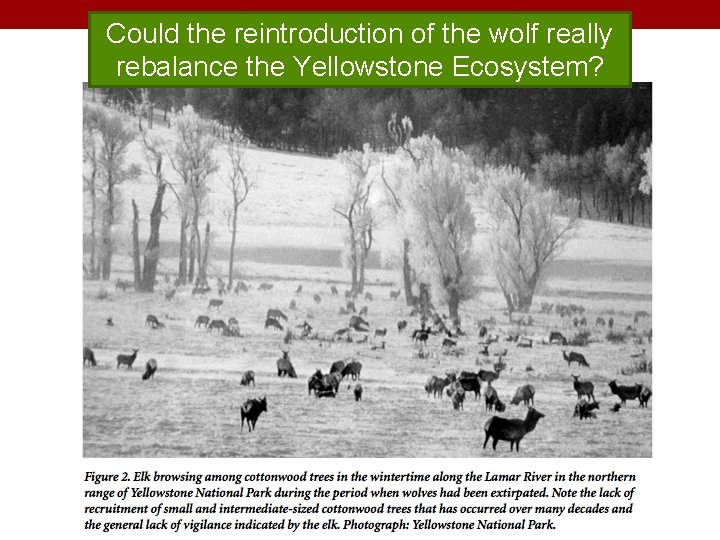
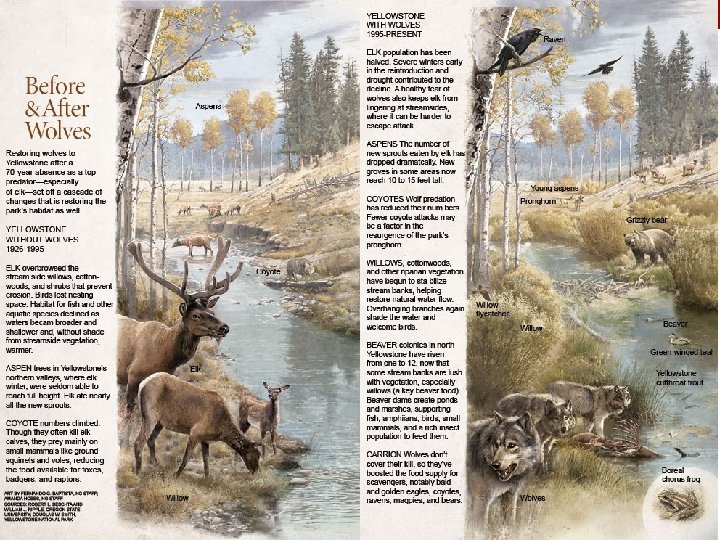
Could the reintroduction of the wolf really rebalance the Yellowstone Ecosystem?
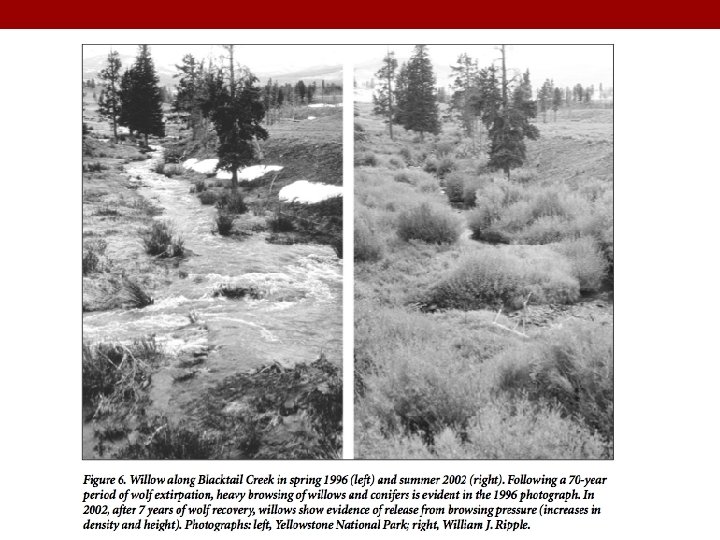
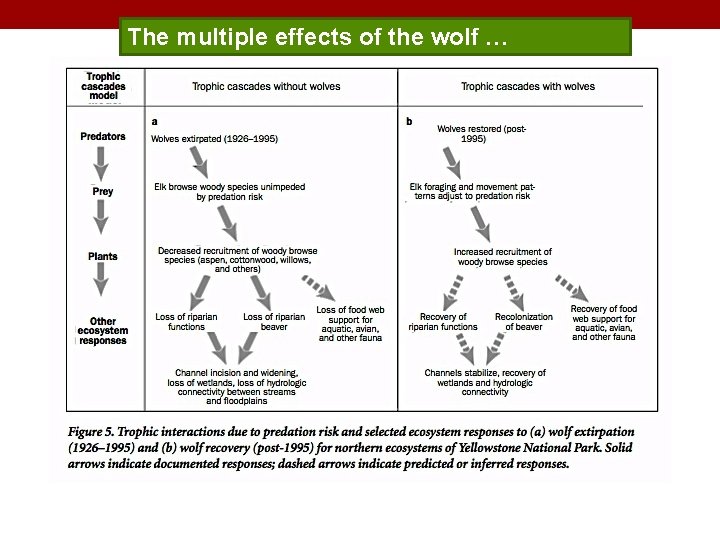
How might wolves affect the behavior of elk? In Science News: The Ecology of Fear Q 27: One of the major areas where regrowth of willow and aspen has been observed is in the riparian habitat – especially along the Lamar River. In what ways would an increase in willow and aspen affect this riparian ecosystem? Be specific.
The multiple effects of the wolf …
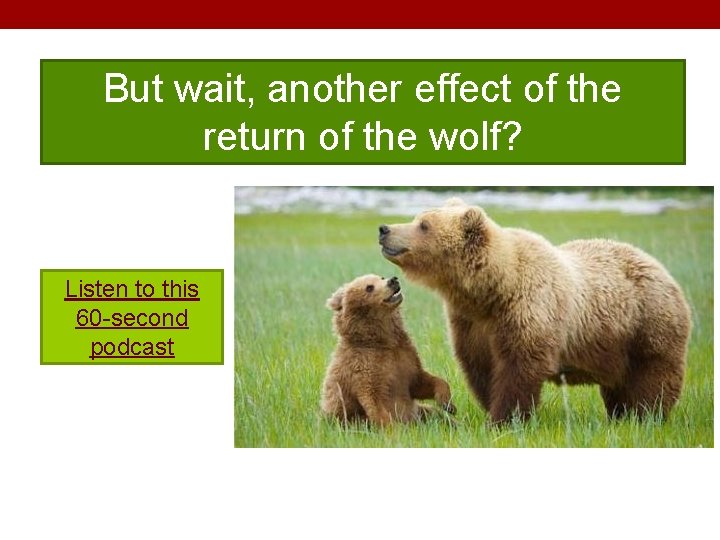
But wait, another effect of the return of the wolf? Listen to this 60 -second podcast
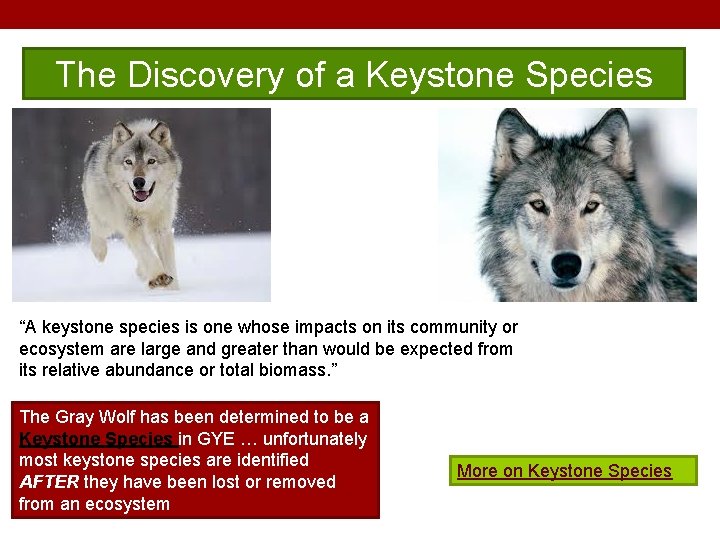
The Discovery of a Keystone Species “A keystone species is one whose impacts on its community or ecosystem are large and greater than would be expected from its relative abundance or total biomass. ” The Gray Wolf has been determined to be a Keystone Species in GYE … unfortunately most keystone species are identified AFTER they have been lost or removed from an ecosystem More on Keystone Species
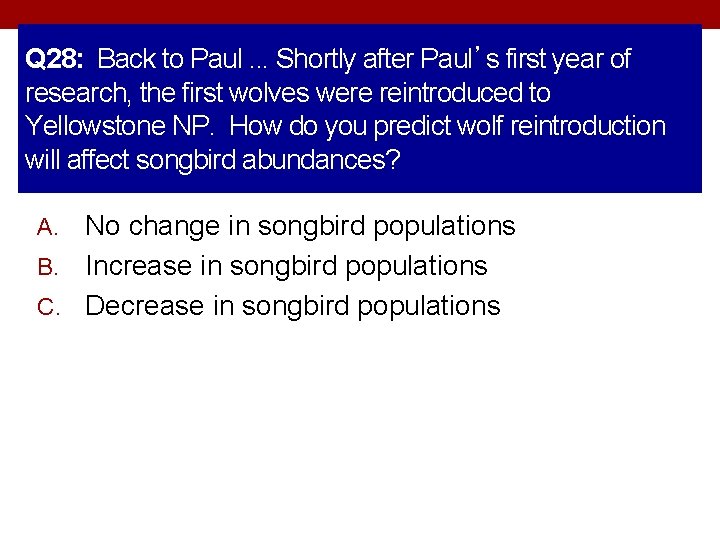
Q 28: Back to Paul. . . Shortly after Paul’s first year of research, the first wolves were reintroduced to Yellowstone NP. How do you predict wolf reintroduction will affect songbird abundances? No change in songbird populations B. Increase in songbird populations C. Decrease in songbird populations A.
Strange Days on Planet Earth: Predators