Welcome to MPGD simulation 2014925 Simulation Garfield Garfield


 Ø Gaseous TPC : Tracker track and energy of recoil")
 0.")
 Drift cage µPIC proton triton 3 He In Template")
 神岡, 31. 6日, exposure=0. 327 kg・days エネルギースペクトル • threshold: 100 ke. V⇒")


![Current [n. A] 0 55 Feの信号の再現 -3 400 ns -6 55 Fe irradiation Ar](https://slidetodoc.com/presentation_image_h/764604b19f1fd1cd054cdced52053d13/image-23.jpg "Current [n. A] 0 55 Feの信号の再現 -3 400 ns -6 55 Fe irradiation Ar")

 100 3000 2000 1000 0 0")
- Slides: 26
Welcome to MPGD simulation ! 2014/9/25 京大理 髙田淳史
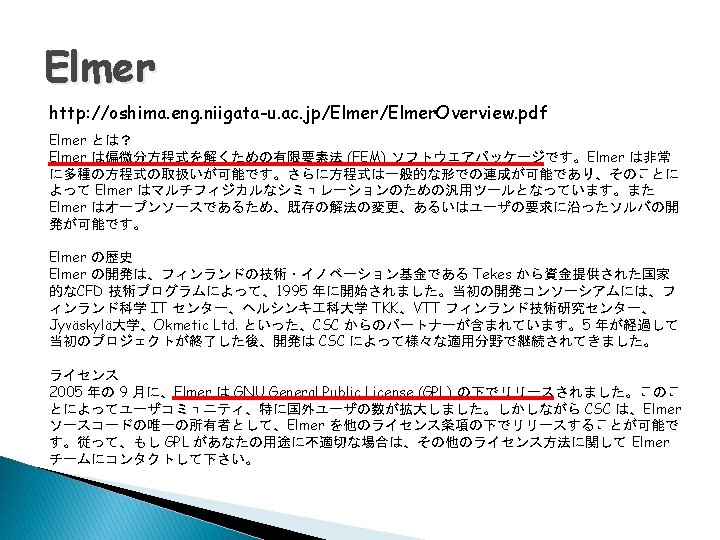
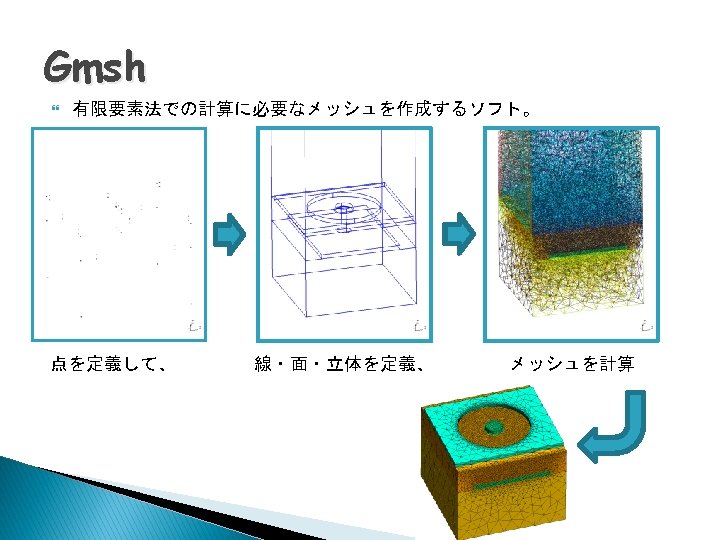
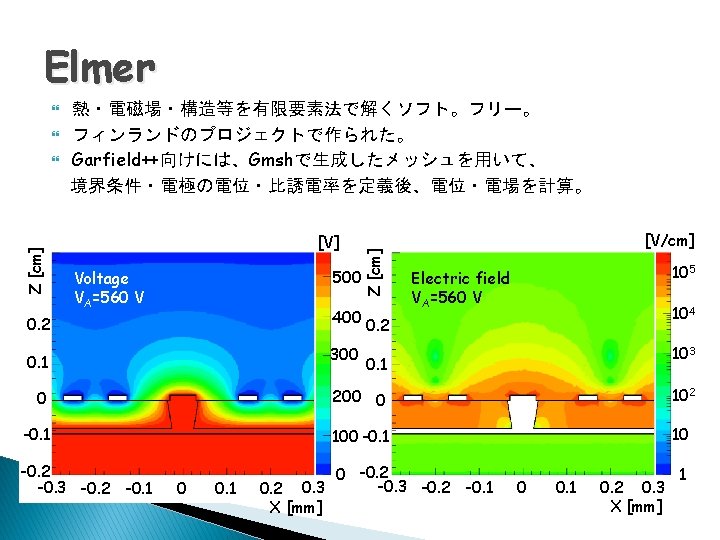
ガス検出器Simulation Garfield Ø Ø Garfield++ http: //garfieldpp. web. cern. ch/garfieldpp http: //garfield. web. cern. ch/garfield Fortran 比例計数管・MWPCを想定 基本的に2次元のみの計算 巨視的な計算 Ø Ø update 104 1000 100 断面積 [Mbarn] Townsend係数 [1/cm] C++ 微細な電極を持つ検出器も想定 3次元で計算 微視的な計算 103 102 10 1 Ar 104 E [V/cm] 105 10 1 0. 01 0. 1 1 10 Energy [e. V] ガス飛跡検出器の応答 ⇒ GarfieldではETCCのガス飛跡検出器を再現できなかった Garfield++では???
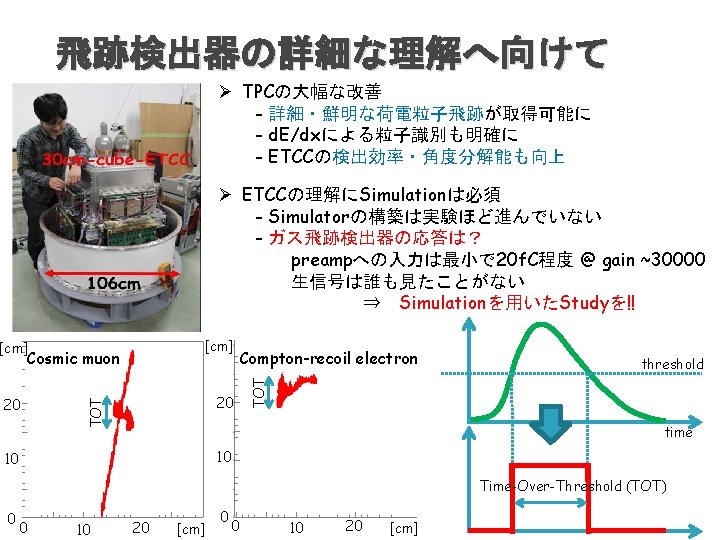
Electron-Tracking Compton Camera (ETCC) Ø Gaseous TPC : Tracker track and energy of recoil electron Ø Scintillator : Absorber position and energy of scattered gamma ray Reconstruct Compton scattering event by event 1 photon direction + energy Large FOV (~3 str) Simple structure Compton Kinematical test with angle a Particle identify with d. E/dx No VETO & shield around ETCC
Performance of 30 -cube ETCC u Large Field of View (662 ke. V) 0. 7 MBq @ 2 m @ 662 ke. V Efficienc y 137 Cs 90 deg. ⇒ ~ 6 sr u Energy resolution u Angular resolution 5. 3 o (FWHM) @ 662 ke. V Ex calc ulat per ime ed b nt y En ergy 18 %@ 166 ke. V & Po sitio n re s. 11 %@ 662 ke. V
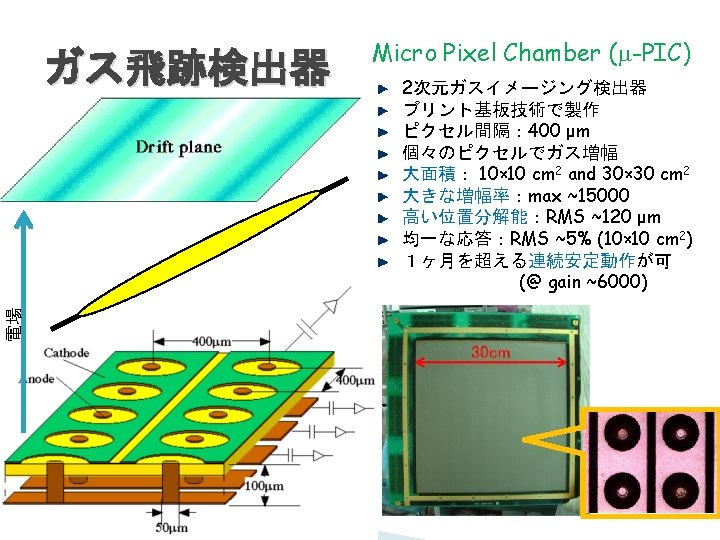
µPIC-based Neutron Imaging Detector (µNID) Drift cage µPIC proton triton 3 He In Template for fit Ag Cu W In Cu φ6 Proton Triton Neutron detection neutron Measured TOT for proton-triton tracks compared with simulation Mo 32. 8 cm TPC with 10 cm µPIC (2. 5 cm gas depth) Mo Ag 5 cm 9. 0 cm Aluminum vessel Resonance CT sample Reconstructed CT images Cu (+764 ke. V) Spatial resolution Position from track length Position by fitting TOF 19. 5~24. 5µs 42. 5~45. 0µs TOF 0~1. 2 ms Mo W +Fit TOF 155. 5~159. 0µs Ag TOF 225~250µs In Bin size: 80 µm × 80 µm. This year: successfully visualized inside of Li-ion battery during charge/discharge at J-PARC. TOF 400~485µs TOF 760~1200µs
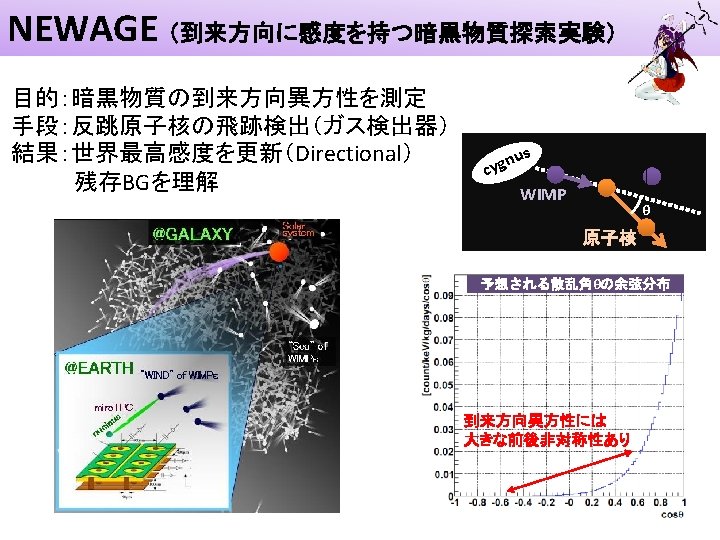
NEWAGE (到来方向に感度を持つ暗黒物質探索実験) 神岡, 31. 6日, exposure=0. 327 kg・days エネルギースペクトル • threshold: 100 ke. V⇒ 50 ke. V • BG:~ 1/10 @100 ke. V 方向分布:およそ等方的 制限:一桁更新 energy spectrum RUN 14 (今回) RUN 5 (PLB 2010) 赤:directional 青:conventional cosθcygnus分布 sky map
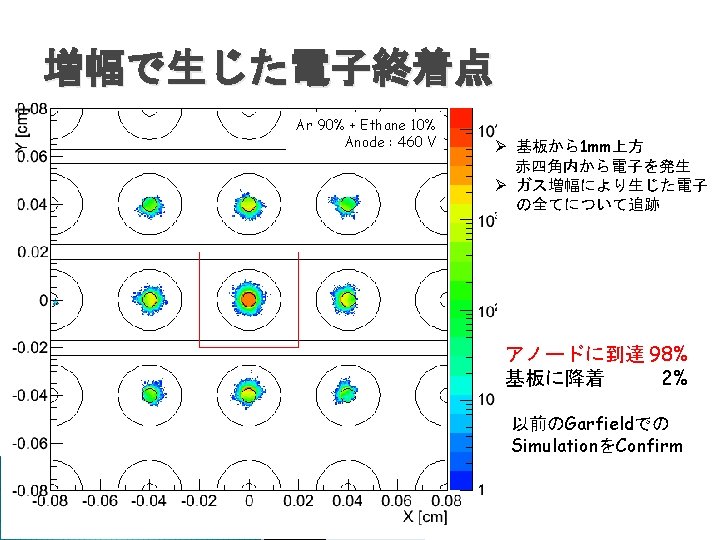
Single electron spectrum 電子1個をμ-PICに入射 ⇒ イオン-電子対の数からガス増幅率 比例計数管の場合… 増幅率のゆらぎはPolya分布に従う 160 Ar 90% + Ethane 10% 120 80 40 μ-PICのガス増幅率もPolya分布 θはアノード電圧によらず ~0. 65 ⇒ 13. 7% @ 5. 89 ke. V(FWHM) 00 1000 60 Seed electron 2000 3000 # ion-e pairs Ar 90% + Ethane 10% 40 Ions Secondary electrons 20 Cathode Anode 0 0 10000 20000 # ion-e pairs
Ion End Points Cathode面 Drift plane Ø Cathode行:Drift plane行 = 1: 1. 67
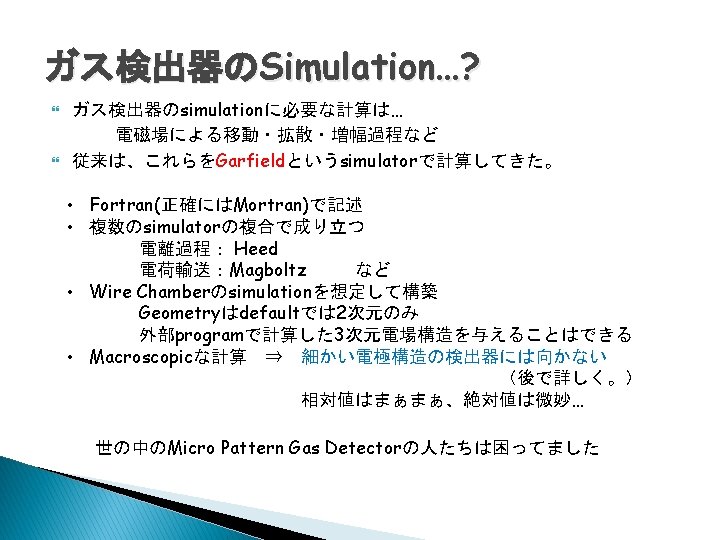
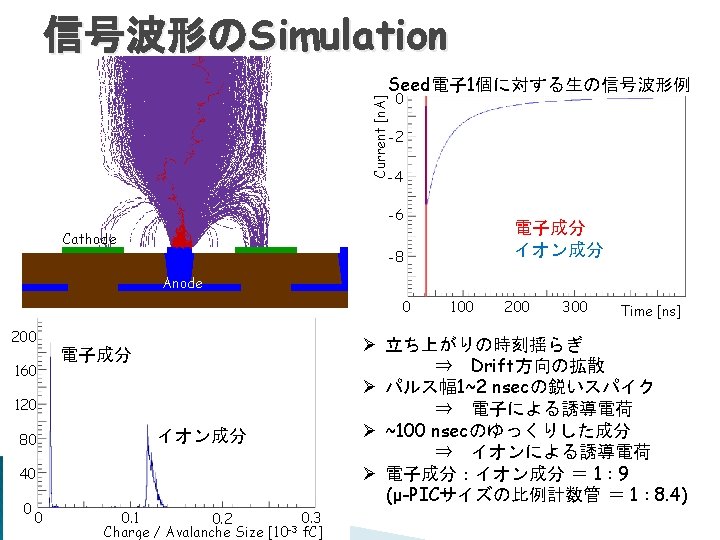
Current [n. A] 0 55 Feの信号の再現 -3 400 ns -6 55 Fe irradiation Ar 80% + C 2 H 6 20% 1 atm, Gain ~3000 40 80 120 Time [ns] 0 -10 -20 -30 0 時定数 16 ns のpreamp出力 200 400 600 800 Time [ns] Emulated preamplifier output [m. V] 0 80 nsec ASD 20 m. V u-PICからの生信号 -9 Emulated preamplifier output [m. V] 16 nsec ASD 10 m. V 0 -10 -20 -30 0 時定数 80 ns のpreamp出力 200 400 600 実験で得られたパルス高がSimulationで説明できた 800 Time [ns]
800 Electron Tracks 800 Anode 600 400 200 0 0 800 50 100 150 200 250 0 0 800 Anode 600 400 200 0 0 50 100 150 200 250 0 0 Cathode 50 100 実験で得た飛跡 Ar + C 2 H 6 (10%), 1 atm Gain ~48000 Gain uniformity σ = 15% Threshold -18/+32 m. V ASD 80 ns Drift 3. 6 cm/us 133 Ba irradiation 150 200 250 計算から得た飛跡 Cathode 50 100 Ar + C 2 H 6 (10%), 1 atm w = 26 e. V, f = 0. 17 Gain ~48000 Gain uniformity σ = 5% Threshold 24 m. V ASD 80 ns Drift 4. 2 cm/us Electron energy <200 ke. V 150 200 250
4000 Energy vs TOT hit 4000 Raw (実験) 100 3000 2000 1000 0 0 4000 3000 2000 10 ed ain e ap c t es y con ll Fu 00 1000 ont c y l 4000 All events (Garfield++) 100 3000 a 1 80 Energy [ke. V] 40 Fully contained events (Garfield++) e o c lly u F 40 ed in nta 1000 1 0 80 Energy [ke. V] 0 d ll Fu n o yc ine ta 40 d. E/d. Xで 止まった電子のみ 選択可 100 Simulationから得た 飛跡画像の面積は 実験結果を大よそ再現 10 10 pe Ø Fully contained 有感領域内で 止まった電子 10 d ine 2000 a sc 100 l Fu 1 0 80 Energy [ke. V] 0 40 2000 1000 d. E/d. Xカット後 (実験) Ø Escape event 有感領域から 外へ出ていく電子 このSimulatorを使用して 飛跡解析やガンマ線再構成の 検証が可能に 1 80 Energy [ke. V]