Welcome to mapping boot camp 2013 Mapping for

Welcome to mapping boot camp 2013

Mapping for stories Mapping Bootcamp 2013 Jennifer La. Fleur, Pro. Publica

Some of these examples were provided by Jo Craven-Mc. Ginty of the New York Times. Thanks Jo!

Using maps in the newsroom • • • Navigation for Web data Show summary data Show locations Help you check assumptions Provide the basis for reporting

Associated Press: Bridge inspections v. stimulus spending

Source: Food stamp sales Findings: Areas where people using food stamps have little or no access to full-service grocery stores…Liquor stores, gas stations and dollar stores make up 30 percent of food-stamp

Test assumptions Source: City of Arlington crime data Findings: The site for the new stadium not as crime-ridden as officials say

Test assumptions

Every map for analysis has a database

And geography

Connected to geography

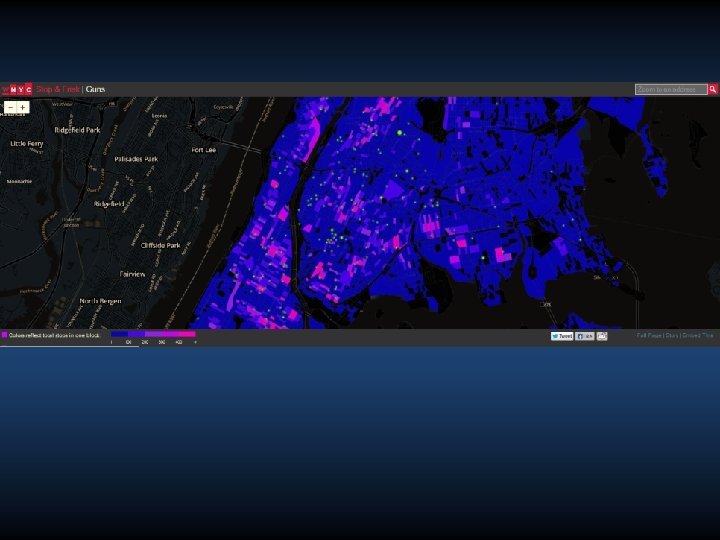
Source: Center for Responsive Politics, National Rifle Association, FEC filings. Navigation and trends

Source: Census Data Findings: African. Americans are leaving black enclaves in the Northeast to move South to places that generations before them had fled.

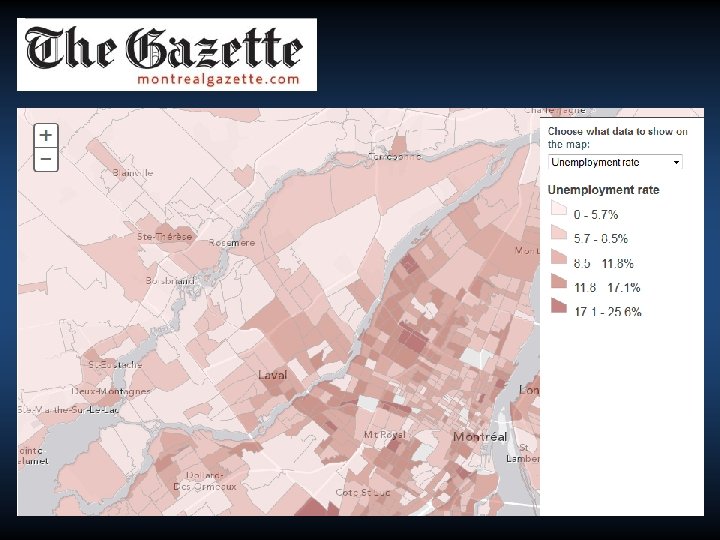
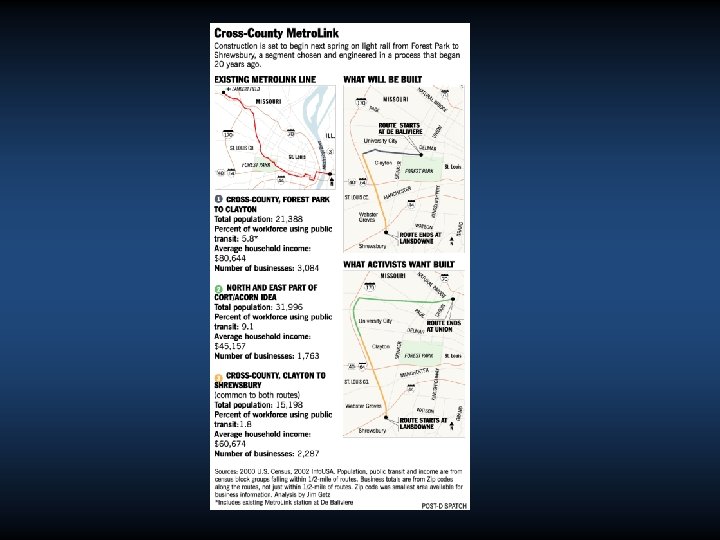
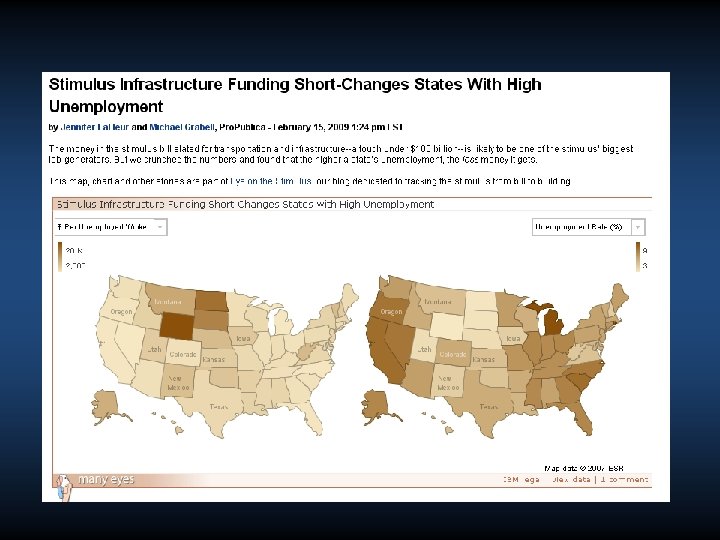
Combining data • • • Census data versus bank locations Flood area versus building permits Transit routes versus census data Crime incidents versus police distribution Stimulus funding and unemployment

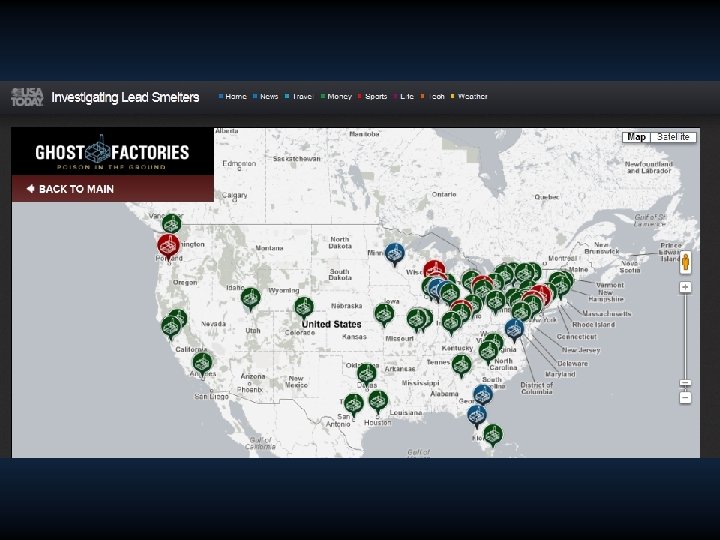
Source: EPA and state data on hazardous chemical locations Findings: Dallas County has 900+ sites that store hazardous chemicals

Source: 311 calls for downed trees Findings: After a tornado swept across New York City, 311 calls for downed trees helps trace

Stories Think about the stories you and others already doing - and how geography affects them. • Find the experts in other disciplines who are using mapping • • • Crime mapping Demographers Planners Environmental scientists

Source: Texas Department of Insurance Findings: Cash only policies were in lower income ZIP codes. 1: 56 AM

Source: Boating accidents data from Fish and Wildlife Conservation Commission In Florida waters in 2011, 67 people were killed and 431 injured in 742 boating accidents. 1: 56 AM

Source: City Budget Findings: Some neighborhoods suffer more than others as mayor cuts budgets

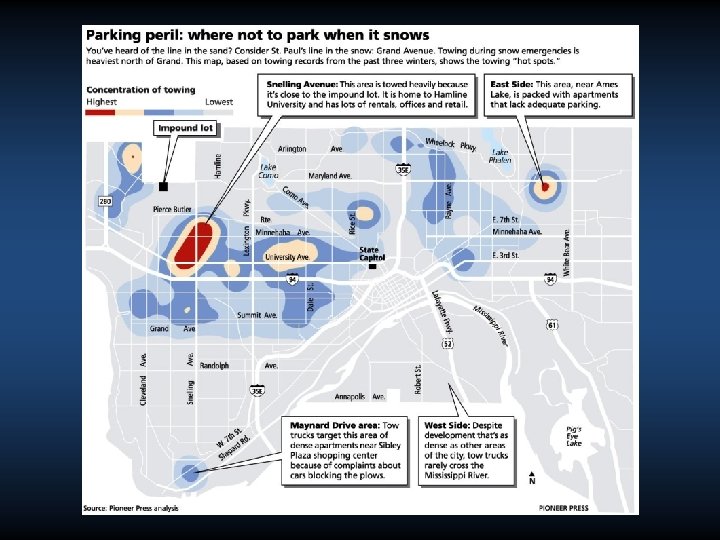
Source: Parking tickets Findings: Ticket “dumping, ” “disco” towing, day with most
 Findings: Allies of the speaker seem to get")
Source: City Council discretionary spending (earmarks) Findings: Allies of the speaker seem to get more money to spend in their districts

Source: 40 years of election results Findings: When Republicans had full control, this is how new redistricting lines were drawn in.
")
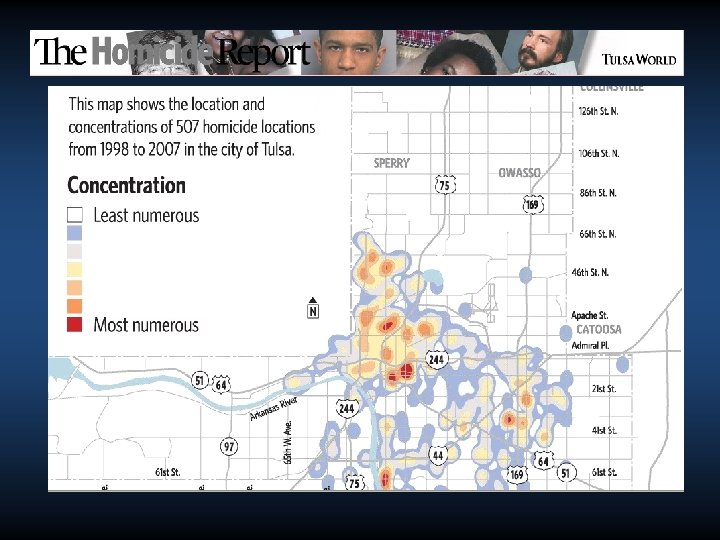
Find hot spots (stay tuned for more info on that)

Sometimes you don’t actually need the map

The Dallas Morning News used mapping to test theory of the Dallas County District Attorney that income, not race, was the reason people were struck from juries.

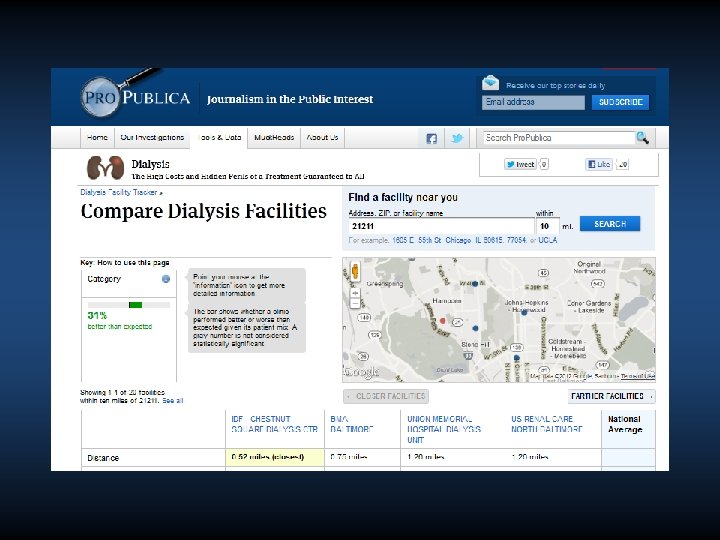
Crowdsourcing maps


The power of layers

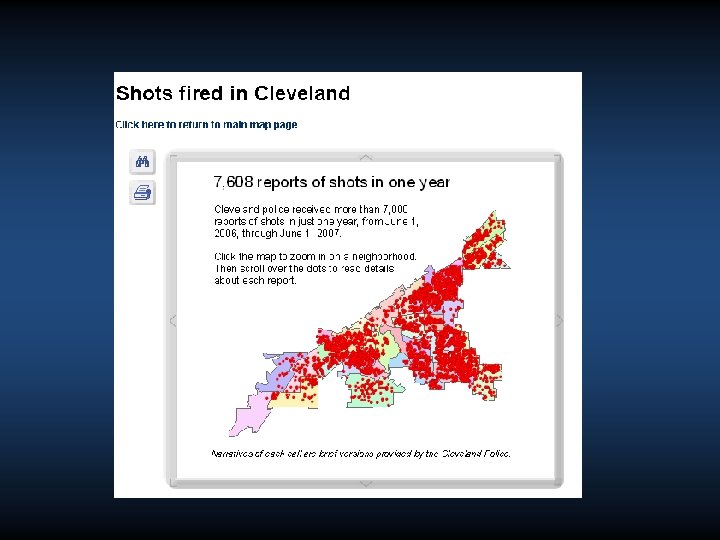
Cleveland Plain Dealer

Source: Dam inspection data from Texas and federal government Findings: Dam records had not been updated to account for population growth 1: 57 AM

Disparities in water usage “Water use highest in poor areas of the city” Mapping and statistical analysis 1: 57 AM

Maps to have on hand in your newsroom • • • Local roads Precincts Parcels Police reporting areas Census geography School districts/schools

Access to GIS Know how your state law treats GIS • Watch out for: privacy, privatization, cash cows, homeland security • Places to find data • • • Universities GIS users group State GIS clearinghouse Local/state agencies
- Slides: 45