Welcome to Advanced Placement Statistics Find the desk


")


 for distributions.")


 C --- ________ CENTER S ---SHAPE ______ O")


 All bell-shaped distributions are")

- Slides: 62
Welcome to Advanced Placement Statistics Find the desk number by your name. Each day you should POWER OFF your cell phone and place it in a slot in the holder at the front of the room.
WELCOME TO AP STATISTICS Course Objective: The student will master the statistics concepts taught in this course and possibly earn college credit by obtaining a passing grade of 3, 4, or 5 on the National Advanced Placement Statistics Examination.
You will have a Rollercoaster of Emotions this semester in AP Stat:
But on the day of the AP Stat exam, you will feel….
Some of the college majors requiring at least one statistics course: • Veterinary Science • Math Credit • Psychology for Liberal • Civil Engineering Arts Majors • Mechanical Engineering • Nursing • Chemical • Animal Science • Nutritional Science Engineering • Education • Pharmacy • Marketing • Economics • Business Management • Pre. Med • Biology • Sociology • Aerospace • Accounting Engineering • Finance
Taking AP classes is more than just trying to make a good grade in the class: v. Colleges want to see that you can pass a Cumulative National Exam covering specific course material. Ø RED FLAGS FOR COLLEGE ADMISSION: q A or B in an AP Course, but scores 1 or 2 on AP Exam q C or F in AP Course and passes AP Exam q Not taking the AP Exam v. AP credit does not count towards the 127 hours for HOPE. v. Going into college with AP credit gives you some cushion so you can to take a smaller load during harder semesters. v. Going into college with AP credit gives you the opportunity to participate in co-ops, internships, and study abroad programs without possibly getting behind towards graduation.
HOW CAN YOU BE SUCCESSFUL ON THE AP STAT EXAM? RULE #1: Show work the way Mrs. Dillon tells you to. RULE #2: Write verbal responses the way Mrs. Dillon shows you how to write them. RULE #3: Practice the assigned problems Mrs. Dillon gives you. The course is cumulative; all concepts are built upon prior topics. RULE #4: Be “committed” and “invested” in this course. Mrs. Dillon is “all in” from Jan 4 to May 11 and she expects you give your best every day.
Grading Policy: Tests (Midterm Exam & Final Exam count as 2 test grades test) 70% Midterm Exam ---- no exemption allowed Final Exam --- 3 or less absences and sits for national exam; no minimum grade requirement Cumulative Final Exam (optional; used as replacement for lowest test grade) Quiz & Daily Grades 30% Take Home Quizzes are due at BEGINNING OF CLASS on due date, even if you are absent. Quizzes and daily grades are made up BEFORE SCHOOL.
Important Class Information: v. A graphing calculator must be brought to class every day and is necessary to complete all assessments. Go ahead and purchase extra batteries to have in your book bag. See me about renting one for the semester. v. Notes, worksheets, assignments, and problem answers will be posted daily on my blog: www. mathwithdillon. weebly. com v. A formula sheet is allowed on the exam. Print a copy of the formula sheet from the blog. Bring it to class each day.
Important Class Information: v. I use REMIND to communicate class information throughout the semester. If you are interested in receiving periodic text messages from me (reminders about quizzes, tests, THQ’s, AP Stat exam info, etc) following these directions: Text 81010 Message to join Stat Group @dillonstat Message to join GMLT Group @ochsgmlt 16
www. mathwithdillon. weebly. com
AP STAT EXAM DAY INFORMATION: Ø DATE & TIME: Thurs, May 18, 2018 12: 00 noon Ø LOCATION: Oconee County Civic Center Ø COST: $95 Ø All AP Stat students are expected to take the national exam on May 18, 2018. If you have a conflict (school competition), you are expected to take the makeup exam.
It is now time, ladies and gentlemen, to start your engines. I mean calculators! AND HERE WE GO…….
Part 1: Exploring Data AP Stat Ch 1. 1: Displaying Distributions with Graphs EQ: How do we categorize data?
v In Class Calculator Activity: ØCreating and Sorting Lists in Your Graphing Calculator ASSIGNMENT: Follow the directions on page 59 (step 1 only) and use the data in Table 1. 4 on p. 57 of your textbook to create and name a calculator list of president’s age at inauguration, adding Barack Obama, age 47 and Donald Trump, age 70. Keep this list in your list of lists until I tell you to delete it.
Recall: • Variables --- measureable or observable characteristic of interest • Data --- actual observations made of a variable • Individuals ---objects from which data is collected; humans are called “subjects” • Statistics --- collecting, organizing and analyzing data
Ex. Complete the following table: VARIABLE Height Gender _______ Opinion on smoking in restaurants Number of children per family DATA 5’ 9” _______ Male NO! _______ 2 ______
Recall: Two Types of Data Qualitative Variable Qualitative Data Quantitative vs. categorical, verbal Can be ordinal or nominal Quantitative: Discrete countable numerical; Arithmetic operation can be performed. vs. Continuous not countable
Ex. Identify the type of data for each variable as qualitative, quantitative discrete, or quantitative continuous. 1. model of cars found in the student parking lot qualitative 2. height of a falling object at any given time quantitative continuous 3. age, in years, of current racecar drivers quantitative discrete 4. number of teachers whose ages fall in the categories under 30 yrs old, 31 – 40 yrs old, over 41 yrs old quantitative discrete 5. final score of every 2016 UGA football game quantitative discrete 6. name of AP courses offered at OCHS qualitative 7. race results for a 5 k road race (1 st, 2 nd, etc. ) qualitative
EQ: How do we represent data in an appropriate graph? Relative Frequency proportion relative to whole vs. Cumulative Frequency summation of relative frequency up to a particular value
Let’s Look at Different Types of Distributions: Distribution Time Plot Shows Raw Data ? Purpose? Yes and No Show Trends
Let’s Look at Different Types of Distributions: Distribution Pie Graph Shows Raw Data ? No Purpose? Compare Relative Frequencies
Let’s Look at Different Types of Distributions: Distribution Bar Graph Shows Raw Data ? Yes and No Purpose? Compare Frequencies
Let’s Look at Different Types of Distributions: Distribution Histogram Shows Raw Data ? Purpose? No Shows Shape of Distribution
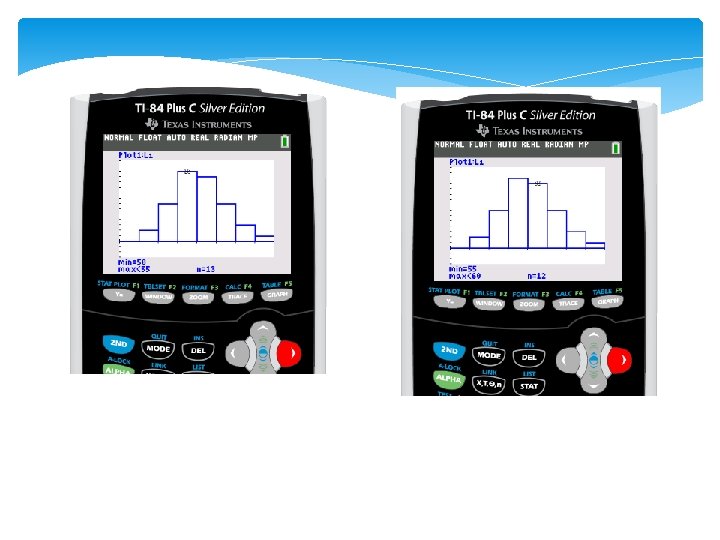
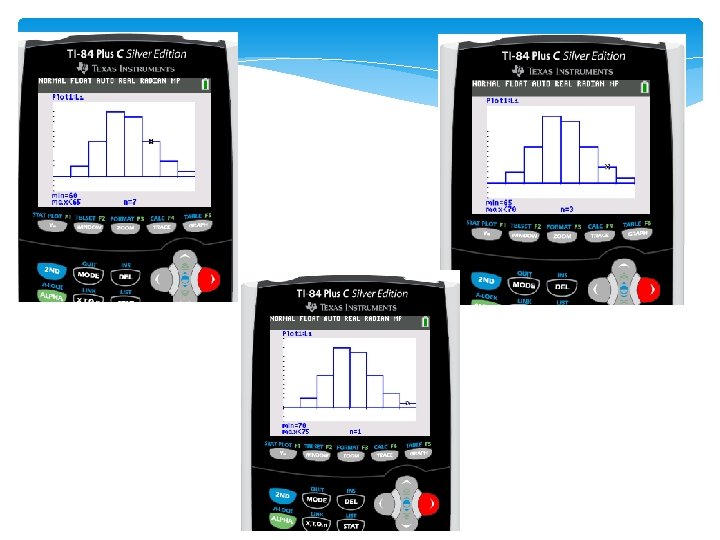
Creating Histogram Using TI-83/TI-84 ØUse directions for Technology Toolbox p. 59 – 60 to create a histogram of PREZ. Turn to the last page of your notes and sketch the histogram on the first graph. We will finish this part of the notes tomorrow. Ours will look different from the one in the book because we added Obama and Trump’s ages.
Hit the TRACE button and discuss what information appears on the screen.
Hit the right arrow button and discuss the information that appears on the screen.
ØNow create a Histogram of PREZ using ZOOM 9. ØSketch this graph on the second graph in your notes. ØWe will discuss these graphs later in the notes.
v. From now on, use the ZOOM 9 function to create all histograms on your graphing calculator.
v. Back to the examples (#6) for distributions.
• Take up syllabus signature page. • Check formula sheet.
Let’s Look at Different Types of Distributions: Distribution Stem Plots Shows Raw Data ? Purpose? Yes Shows Shape of Distribution
Let’s Look at Different Types of Distributions: Distribution Dot Plots Shows Raw Data ? Purpose? Yes Shows Shape of Distribution
Let’s Look at Different Types of Distributions: Distribution Ogive Shows Raw Data ? Purpose? Shows Cumulative No Frequency or Cumulative Relative Frequency
Creating An Ogive v. Ex. 1. 9 p. 60 – 61 Set up 5 lists in your calc. o Place the upper value of each class in L 1 o Place the frequency for each class in L 2 o Place the cumulative frequency for each class in L 3. Hint: use the cum. Sum function.
Creating An Ogive o Place the cumulative relative frequency of each class in L 4.
Creating An Ogive o Go to STAT PLOT and cut on Plot 1 o Select the second graph; let your domain be the upper limit ages (L 1) and the range be cumulative relative frequency (L 4). o Use ZOOM 9 to create graph
Creating An Ogive o Use TRACE and the arrow buttons to move along the graph. What information is given at the bottom of the screen?
Creating An Ogive o Hit the clear button and use only the arrow keys to move up and down the graph.
Creating An Ogive o Fifty percent of our presidents have been at most what age? Approximately 50% of our presidents have been at most (and at least) 54 years old.
Creating An Ogive RECALL: 50% of your data lies at what statistical measure of center? MEDIAN o Use a calculator function to locate the median of L 1.
Interpret the indicated point on the given ogive. 40 ____% of the __________ students taking the test score had a _______ of 12 at most ____.
AP STAT EXAM GOLDEN RULE #1: When creating graphs of data: TITLE GRAPH LABEL BOTH AXES COUNT BY CONSTANT INTERVALS
§ In Class Discussion p. 47 #3 1. 0 1. 6 2. 0 Cumulative frequency to median from each end Leaf Stem
RECALL: Describing the Shape of Distributions: Symmetric, Uniform Skewed Right Skewed Left Symmetric, Bell-shape
ACRONYMS TO DESCRIBE DISTRIBUTIONS SHAPE CENTER S --- ______ C --- ________ O --- ______ U --- ________ UNUSUAL VALUES OUTLIER C --- ______ S --- ________ SHAPE CENTER S --- ________________ SPREAD uniform symmetric skewed Shape --- ____________, _______
ACRONYMS TO DESCRIBE DISTRIBUTIONS SHAPE CENTER S --- ______ C --- ________ O --- ______ U --- ________ UNUSUAL VALUES OUTLIER C --- ______ S --- ________ SHAPE CENTER S --- ________________ SPREAD uniform symmetric skewed Shape --- ____________, _______ away from body of data points clearly _______ Outliers --- _____
ACRONYMS TO DESCRIBE DISTRIBUTIONS (implies? ) C --- ________ CENTER S ---SHAPE ______ O --- OUTLIER ______ U --- ________ UNUSUAL VALUES C --- ______ S --- ________ CENTER SHAPE (implies? ) S --- ________________ SPREAD uniform symmetric skewed Shape --- ____________, _______ away from body of data points clearly _______ Outliers --- _____ balancing point typifies Center --- _______ data; ______
ACRONYMS TO DESCRIBE DISTRIBUTIONS SHAPE CENTER S --- ______ C --- ________ O --- ______ U --- ________ UNUSUAL VALUES OUTLIER C --- ______ S --- ________ SHAPE CENTER S --- ________________ SPREAD Shape --- uniform ________, ________ skewed symmetric points clearly away Outliers --- ______ from body of data typifies balancing point Center --- _____ data; _____ gaps Spread --- variation _____ of data; _____, ______ clusters
Now let’s use SOCS to describe the distribution of president’s age at inauguration: You can write a paragraph or you can just do “bullets”. Make sure you cover all terms. Write complete sentences in context of the distribution. SHAPE OUTLIERS Center Spread
SHA PE The distribution of president’s age at inauguration appears to be right skewed indicating there has been a higher frequency of younger presidents at inauguration. OUTLIERS Center Spread
SHA PEdistribution of president’s age at inauguration The appears to be right skewed indicating there has been a higher frequency of younger presidents at inauguration. OUTLIER S There appear to be no outliers in distribution of president’s age at inauguration. [We will discuss how to determine if there are/are not in the next lesson. ] Center Spread
SHA PEdistribution of president’s age at inauguration The appears to be right skewed indicating there has been a higher frequency of younger presidents at inauguration. OUTLIER S There appear to be no outliers in distribution of president’s age at inauguration. [We will discuss how to determine if there are/are not in the next lesson. ] Cent er the distribution of president’s age at inauguration Since appears to be right skewed, the best measure of center is the median. [State the value of possible. ] Spread
SHA PEdistribution of president’s age at inauguration The appears to be right skewed indicating there was a higher frequency of younger presidents. OUTLIER There appear to be no outliers in distribution of president’s age at inauguration. S [We will discuss how to determine if there are/are not in the next lesson. ] Cent Since the distribution of president’s age at inauguration er appears to be right skewed, the best measure of center is the median. [State the value if possible. ] Sprea Since the distribution of president’s age at inauguration appears to be right skewed, the best measure of spread is the IQR. d [State the value if possible. ]
v. From now on, use the ZOOM 9 function to create all histograms on your graphing calculator.
Determine if the following statements are true or false. 1) All bell-shaped distributions are symmetric. YES 2) All symmetric distributions are bell-shaped. NO
v. From now on, use the ZOOM 9 function to create all histograms on your graphing calculator. Assignment: p. 46 - 48 #2, 6 p. 55 #7, 8, 10 p. 64 #13 DO NOT DO p. 67 yet. Do this page after the next lesson.