WELCOME MACHINE LEARNING Unit 4 KMedoid about Mr

WELCOME MACHINE LEARNING Unit- 4 K-Medoid

about Mr. Rasmi Ranjan Assistant Professor Khansama Department of Computer Science and Engineering

Outline Topic K-Means K-Medoid Algorithm Pros and Cons 1 2 3 4

K-means Clustering • • • Partitional clustering approach Each cluster is associated with a centroid (center point) Each point is assigned to the cluster with the closest centroid Number of clusters, K, must be specified The basic algorithm is very simple

K-means Clustering : Algorithm
 representing locations) into three")
Problem-01: • Cluster the following eight points (with (x, y) representing locations) into three clusters: • A 1(2, 10), A 2(2, 5), A 3(8, 4), A 4(5, 8), A 5(7, 5), A 6(6, 4), A 7(1, 2), A 8(4, 9) • • Initial cluster centers are: A 1(2, 10), A 4(5, 8) and A 7(1, 2). • The distance function between two points a = (x 1, y 1) and b = (x 2, y 2) is defined as • Ρ(a, b) = |x 2 – x 1| + |y 2 – y 1|

K-medoid Clustering : Algorithm

Cost


Limitations of K-means • K-means has problems when clusters are of differing • Sizes • Densities • Non-globular shapes • K-means has problems when the data contains outliers.

2. Hierarchical Clustering Methods • Hierarchical decomposition of the given set of data objects • Hierarchical method can be classified as… 1. Agglomerative (bottom-up ) 2. Divisive (top-down)
 Agglomerative (bottom up) 1. 2. 3. Start with 1")
2. Hierarchical clustering (visit-once approach) Agglomerative (bottom up) 1. 2. 3. Start with 1 point (singleton) cluster Recursively add two or more appropriate clusters(merge) Stop when k number of clusters is achieved. Result: Only one Cluster Algorithm: AGNES (AGglomerative NESting) Note: Initially number of small clusters( contain one point each) Divisive (top down) 1. Start with a big cluster 2. Recursively divide into smaller clusters(split) 3. Stop when k number of clusters is achieved. Result: Many Clusters Algorithm: DIANA (DIvisive ANAlysis) Note: Initially one big cluster( contains all points)

AGNES vs DIANA • A data set of five objects: {a, b, c, d, e }
 to merge/split • The crucial step is how to best")
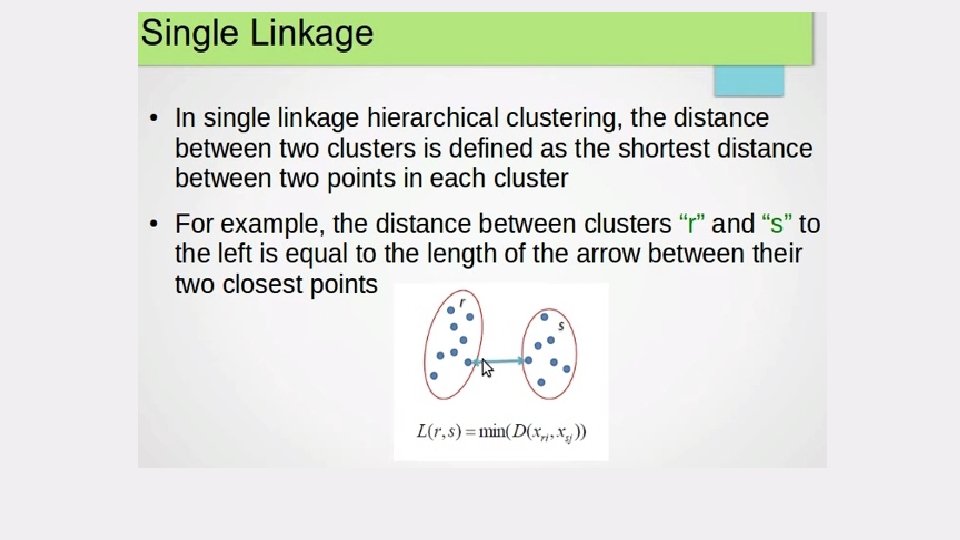
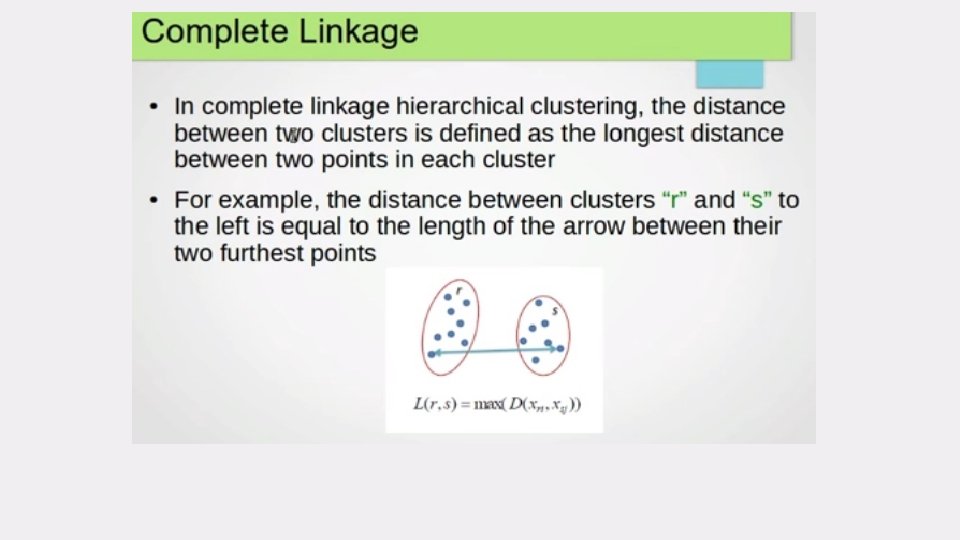
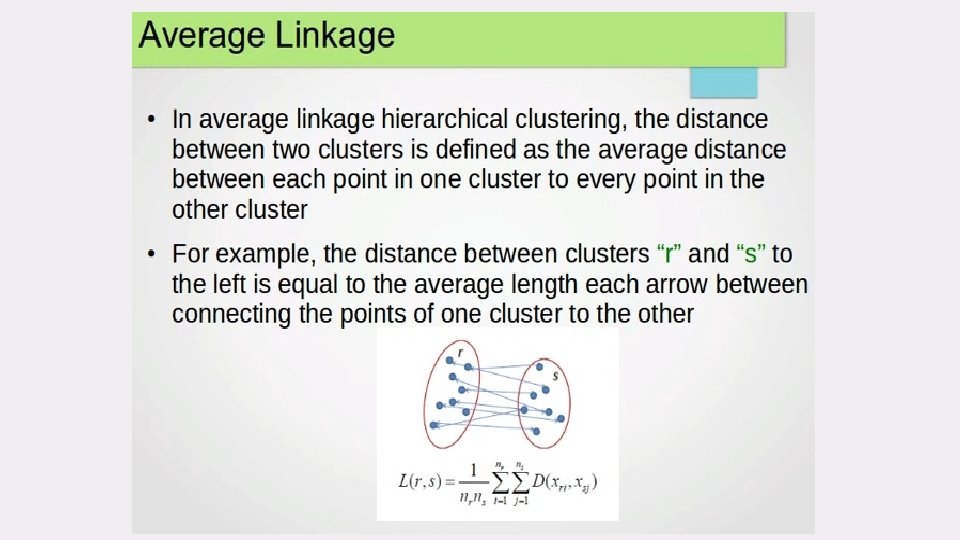
select the next cluster(s) to merge/split • The crucial step is how to best select the next cluster(s) to split or merge. • Compute distances (similarities) between the new cluster and each of the old clusters. • It can be done in different ways, • single-link • complete-link • average-link Agglomerative Clustering Divisive clustering


Algorithm

• See Example in MS-Document

Starting Situation • Start with clusters of individual points and a proximity matrix p 1 p 2 p 3 p 4 p 5. . . Proximity Matrix . . .

Intermediate Situation • After some merging steps, we have some clusters C 1 C 2 C 3 C 4 C 5 Proximity Matrix C 1 C 2 C 5

Intermediate Situation C 1 C 2 C 3 C 4 C 5 • We want to merge the two closest clusters (C 2 and C 1 C 5) and update the proximity matrix. C 2 C 3 C 4 C 5 Proximity Matrix C 1 C 2 C 5

After Merging • The question is “How do we update the proximity matrix? ” C 1 C 2 U C 5 C 3 C 4 ? ? ? C 3 ? C 4 ? Proximity Matrix C 1 C 2 U C 5

Hierarchical Clustering: 1 3 5 2 1 2 3 4 5 6 4 Nested Clusters Dendrogram

Hierarchical methods : Issues • Hierarchical methods suffer from • The fact that once a step (merge or split) is done it can never be undone • Difficulty handling different sized clusters and convex shapes • Sensitivity to noise and outliers • So, It is useful because of smaller computation costs • But such techniques cannot correct erroneous decisions • Approaches to improve the quality of hierarchical clustering • Integrate hierarchical agglomeration and other approaches • BIRCH Algorithm , etc. ,

Hierarchical methods : Issues • Thus merge or split decisions, if not well chosen at some step, may lead to low-quality clusters. • So each decision to merge or split requires the examination and evaluation of a good number of objects or clusters. • The clustering quality of hierarchical methods is to integrate hierarchical clustering with other clustering techniques resulting in multiple-phase clustering. • Some methods are there as follows…

BIRCH • Balanced Iterative Reducing and Clustering Using Hierarchies • Designed for clustering a large amount of numerical data by integration of hierarchical clustering (at the initial microclustering stage) and other clustering methods such as iterative partitioning (at the later macroclustering stage). • It overcomes the two difficulties of agglomerative clustering methods: • (1) scalability and (2) the inability to undo

Hierarchical methods : Issues • All Methods 1. BIRCH: • Begins by partitioning objects hierarchically using tree structures, where the leaf or low-level nonleaf nodes can be viewed as “microclusters” depending on the scale of resolution. • It then applies other clustering algorithms to perform macroclustering on the microclusters. • 2. ROCK: merges clusters based on their interconnectivity • 3. Chameleon: Explores dynamic modeling in hierarchical clustering.

3. Density Based Methods • Based on the notion of density • The general idea is to continue growing the given cluster as long as the density (number of objects / data points) in the “neighborhood” exceeds some threshold • That is, for each data point within a given cluster, the neighbourhood of a given radius has to contain at least a minimum number of points outliers • Such a method can be used to filter out noise ( ) and discover clusters of arbitrary shape. • DBSCAN and its extension, OPTICS are density-based methods • OPTICS: Ordering Points To Identify the Clustering Structure

DBSCAN • Density-Based Spatial Clustering of Applications with Noise • The algorithm grows regions with sufficiently high density into clusters and discovers clusters of arbitrary shape in spatial databases with noise • Given a set of points in some space, it groups together points that are closely packed together (points with many nearby neighbors), • Marking as outliers points that lie alone in low-density regions (whose nearest neighbors are too far away).

Density Based Clustering: Basic Concept • Intuition for the formalization of the basic idea • For any point in a cluster, the local point density around that point has to exceed some threshold • The set of points from one cluster is spatially connected • Local point density at a point p defined by two parameters • – radius for the neighborhood of point p: N (p) : = {q in data set D | dist(p, q) } • Min. Pts – minimum number of points in the given neighbourhood N(p)

-Neighborhood • -Neighborhood – Objects within a radius of from an object. • “High density” - ε-Neighborhood of an object contains at least Min. Pts of objects. ε q p ε ε-Neighborhood of p ε-Neighborhood of q Density of p is “high” (Min. Pts = 4) Density of q is “low” (Min. Pts = 4)

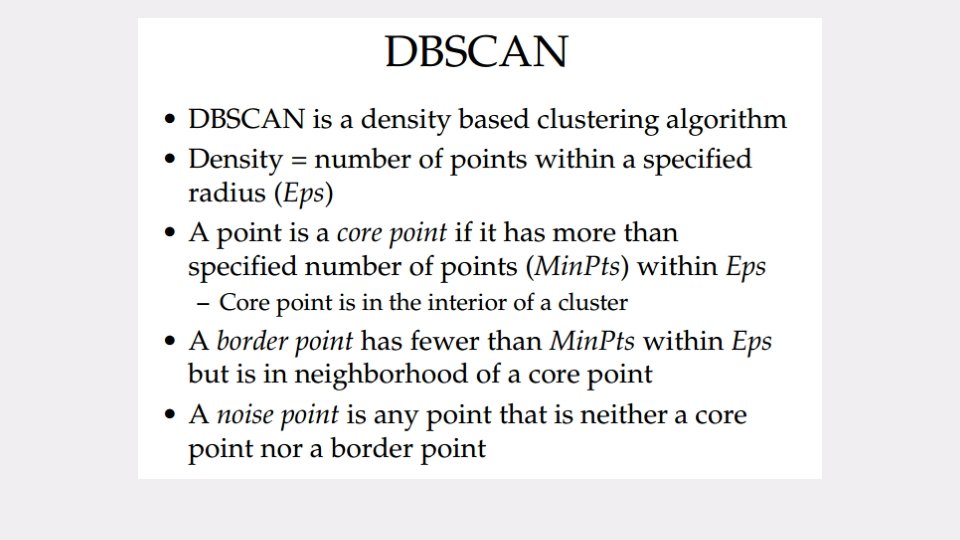
Core, Border & Outlier Border A point is a core point if it has more than a specified number of points (Min. Pts) within Eps These are points that are at the interior of a cluster. Core = 1 unit, Given and Min. Pts, categorize the objects into three exclusive groups. Min. Pts = 5 A border point has fewer than Min. Pts within Eps, but is in the neighborhood of a core point. A noise point is any point that is not a core point nor a border point.

DBSCAN Algorithm Input: The data set D Parameter: , Min. Pts For each object p in D if p is a core object and not processed then C = retrieve all objects density-reachable from p mark all objects in C as processed report C as a cluster else mark p as outlier end if End For DBScan Algorithm

DBSCAN: The Algorithm • Arbitrary select a point p • Retrieve all points density-reachable from p wrt Eps and Min. Pts. • If p is a core point, a cluster is formed. • If p is a border point, no points are density-reachable from p and DBSCAN visits the next point of the database. • Continue the process until all of the points have been processed.

Density Based Clustering: Discussion • Advantages • Clusters can have arbitrary shape and size • Number of clusters is determined automatically • Can separate clusters from surrounding noise • Disadvantages • Input parameters may be difficult to determine • In some situations very sensitive to input parameter setting

DBSCAN: Core, Border, and Noise Points

DBSCAN: Core, Border and Noise Points Original Points Point types: core, border and noise Eps = 10, Min. Pts = 4

When DBSCAN Works Well Original Points Clusters • Resistant to Noise • Can handle clusters of different shapes and sizes

Outlier Analysis : • What is an outlier? Data objects, which are grossly different from or inconsistent with the remaining set of data, are called outliers. • Outliers can be caused by • Measurement • For example, the display of a person’s age as 999 could be caused by a program default setting of an unrecorded age • Execution error • The salary of the chief executive officer of a company, could naturally stand out as an outlier among the salaries of the other employees in the firm.

Outlier Analysis / Mining : • Many data mining algorithms try to minimize the influence of outliers or eliminate them all together • This could result in the loss of important hidden information because one person’s noise could be another person’s signal • The outliers may be of particular interest, such as in the case of fraud detection, where outliers may indicate fraudulent activity • So, outlier detection and analysis is an interesting data mining task, referred to as outlier mining.

Outlier Mining : Applications • Used in fraud detection, • For example, by detecting unusual usage of credit cards or telecommunication services. • It is useful in customized marketing for identifying the spending behavior of customers with extremely low or extremely high incomes, • In medical analysis for finding unusual responses to various medical treatments.

Outlier Mining Process: • Given a set of n data points or objects and k, (i. e. , the expected number of outliers) • Find the top k objects that are considerably dissimilar, exceptional, or inconsistent with respect to the remaining data • Outlier mining problem can be viewed as two sub problems: (1) Define outlier: Define what data can be considered as inconsistent in a given data set, and (2) Detect outlier: Find an efficient method to mine the outliers so defined.

Outlier Mining Process: Define Outlier • If a regression model is used for data modeling, analysis of the residuals can give a good estimation for data “extremeness” • When multidimensional data are involved then definition of outliers requires special consideration. • Data visualization methods : • Data visualization methods are weak in detecting outliers in data with many categorical attributes or in data of high dimensionality, • Human eyes are good at visualizing numeric data of only two to three dimensions.

Computer-based methods: Outlier detection 1. Statistical Distribution-based Approach 2. Distance-based approach 3. Density-based approach 4. Deviation-based approach
 for given data • Then")
1. Statistical Distribution-based Approach • Assumes a probability model(F) for given data • Then Identifies outliers w. r. t that model • For that it uses “Discordancy Test” • To apply this test, it requires • knowledge of the dataset parameters, • Knowledge of distribution parameters(i. e. , mean, variance) • Expected number of outliers • To work with this test, • A working hypotheses(H) • Alternative hypotheses

Drawback: • Mostly for single attributes • Requires knowledge of distribution parameters of the dataset • In many cases the data distribution may not be known • Do not guarantee that all outliers will be found

2. Distance-based approach • To over come the limitations of statistical model • An object (O) in a dataset (D) is a distance-based(DB) outlier with parameters… • i. e. , DB( pct, dmin)-outlier • pct ( Fraction of objects in D) • Dmin ( Lie at a distance greater than dmin from O • Note: Use has to set pct & dmin parameters • So, the algorithm required for this are… • Index-based algorithm • Nested-loop algorithm • Cell-based algorithm

3. Density-based approach • Figure shows a simple 2 -D dataset • Contains 502 objects, with two clusters. • Cluster C 1 contains 400 objects. • Cluster C 2 contains 100 objects. • Two additional objects, o 1 and o 2 are clearly outliers.

4. Deviation-based approach • It identifies outliers by examining the main characteristics of objects in a group • Objects that deviate from this description are considered outliers • Two techniques to detect outliers • Sequential exception technique • OLAP data cube technique

Thank You
- Slides: 58