Weight Loss Nutrition and ALS Stacy Rudnicki MD


 � Used different")
![Most Practical/Accurate of the Models Created to Better Estimate the TDEE = [Harris-Benedict RMR]](https://slidetodoc.com/presentation_image_h/78c7155a4a56e76942e55d02a9551b9c/image-11.jpg "Most Practical/Accurate of the Models Created to Better Estimate the TDEE = [Harris-Benedict RMR]")


 �Increased pre-diagnostic")


 Site Onset Bulbar Extremity Gender Female Male Age of Onset Time")

 Range -19. 3 to 5. 6 Mean")


and PEG group (-----) Chiò A et")
: a prospective cohort study Pro. Gas Study Group")
: a prospective cohort study Pro. Gas Study Group")


- Slides: 45
Weight Loss, Nutrition and ALS Stacy Rudnicki, MD Kathryn and J Thomas May Chair in ALS University of Arkansas for Medical Sciences Little Rock, AR SAR has nothing to disclose
Objectives � Identify possible causes for weight loss in ALS patients � Understand total daily energy expenditure in ALS patients may be greater than expected using routine calculations � Recognize prognostic implications of early changes in BMI in ALS � Summarize the guidelines for feeding tubes in ALS patients � Compare and contrast the benefits and limitations of enteral nutrition in ALS patients
ALS: Disease of the Motor Neuron
Weight Loss in ALS Patients � Dysphagia � Muscle atrophy � Depression / poor appetite � Altered taste � Impaired energy balance ◦ Hypermetabolic state
Body mass index and dietary intervention: Implications for prognosis of amyotrophic lateral sclerosis Ngo ST, et al. J Neurol Sci 2014: 340: 5 -12.
Total Daily Energy Expenditure TDEE Sedentary Physically Active
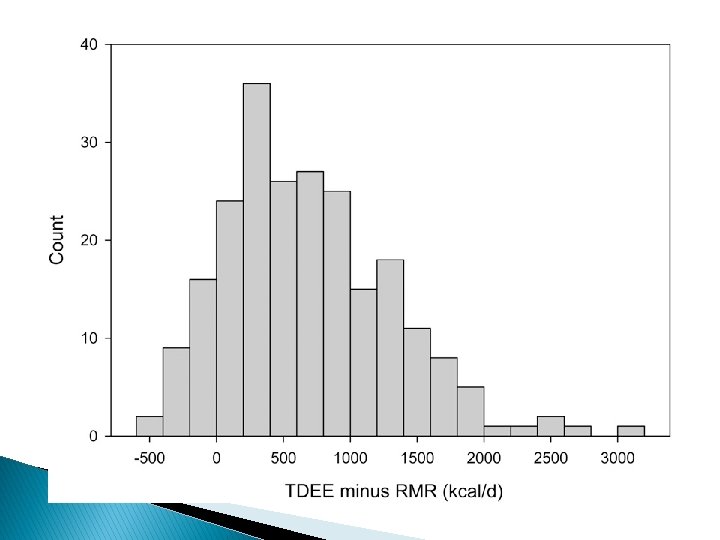
Estimating daily energy expenditure in individuals with ALS Kasarskis EJ et al, Am J Clin Nutr 2014; 99: 792– 803 � 80 ALS pts � Measured total daily energy expenditure (TDEE) over a 10 -d period with doubly labeled water method � Estimated resting metabolic rate (RMR) using a variety of equations as well as by indirect calorimetry
Possible Causes for Increased Total Daily Energy Expenditure � Functional motor work – increased work of using weak muscles ◦ Extremity muscles ◦ Respiratory muscles � Non-functional motor work ◦ Fasciculations ◦ Cramps ◦ Spasticity ◦ Pseudobulbar manifestation � Metabolic cost of protein catabolism
Modeling for more practical way to accurately estimate TDEE (18 models) � Used different equations for RMR � Took into account muscle strength testing � Used lean body mass, fat mass, BMI � Included TSH, site of disease onset � Different elements of the ALS-FRS-R � ALSFRSR-6 ◦ ◦ ◦ Speech Handwriting Dressing and Hygiene Turning in bed Walking Dyspnea
Most Practical/Accurate of the Models Created to Better Estimate the TDEE = [Harris-Benedict RMR] + (55. 96 x ALSFRS-6 Score) – 168 � Harris Benedict for men ◦ [66 + (13. 7 x wt in kg) + (5 x ht in cm) – (6. 76 x age yrs)] � Harris Benedict for women ◦ [665+ (9. 6 x wt in kg + (1. 8 x ht in cm) – (4. 7 x age yrs)] ◦ https: //mednet. mc. uky. edu/alscalculator/
56 year old male, 5’ 10 inches, 160 pounds, with ALS-FRS 6 score of 12 � TDEE traditional method – sedentary activity level ◦ 1892 calories � TDEE specific for ALS ◦ 2081 calories
Early Changes in BMI / Weight in ALS
BMI / Weight loss and survival � Loss of BMI > 1 from time of dx to 2 year f/u associated with shorter survival and faster rate of progression Jawaid et al. Amyotroph Lateral Scler 2008; 11: 542 -548 � Weight loss >10% but not BMI <18. 5 at time of dx associated with worse prognosis Limousin et al. J Neurol Sci 2010; 297: 36 -39 � Lowest mortality found in patients who at study entry were mildly obese (BMI 30 -34. 99) Paganoni et al. Muscle Nerve 2011; 44: 20 -24 � Significantly worse prognosis in patients with loss of BMI >2. 5 per year (based on change in premorbid BMI compared to first visit) Shimizu T, Nagaoka et al. Amyotroph Lateral Scler 2012; 13: 363 -366.
Prevalence of Self-Reported Obesity Among U. S. Adults by State and Territory 2014
Questions Asked � Is survival related to ◦ Premorbid BMI (p. BMI) �Increased pre-diagnostic body fat is associated with a decreased risk of ALS mortality EPIC Cohort Neurology 2013; 80: 829– 838 ◦ BMI classification at first visit (1 BMI) ◦ Rate of change in BMI (rc. BMI) �rc. BMI = 1 BMI – p. BMI / months since sxs onset � Are there clinical features that are associated with greater rc. BMI
Study Design � Retrospective chart review of MND patients seen from January 2001 – February 2013 � Survival recorded through April 2013 � Data abstracted ◦ Onset site ◦ Time to first clinic visit (months) ◦ Gender ◦ ALS-FRS at first visit ◦ Vital capacity at first visit ◦ Self reported premorbid weight – used to calculate the p. BMI ◦ 1 BMI
Study Design � Exclusions ◦ PLS ◦ Missing premorbid weight ◦ Transfers from another ALS clinic � BMI Classification ◦ ◦ <18. 5 Underweight 18. 5 – 24. 9 Normal weight 25 – 29. 9 Overweight 30 + Obese � Statistical analysis done using Med. Calc
Clinical Features (n=289) Site Onset Bulbar Extremity Gender Female Male Age of Onset Time to first clinic visit ALS FRS R Vital Capacity (% predicted) BMI p. BMI 1 BMI 86 (29. 8%) 203 (70. 2%) 132 (45. 7%) 157 (54. 3%) 59. 0 + 12. 1 years 12. 7 + 9. 2 months 36. 8 + 7. 6 71. 4 + 23. 6 28. 8 + 5. 8 26. 8 + 5. 6
140 p=0. 94 120 p = 0. 0028 100 p=0. 47 80 p. BMI 1 BMI 60 40 20 p=0. 014 0 Underweight Normal Weight Overweight Obese
Absolute Change in BMI (kg/m 2) Range -19. 3 to 5. 6 Mean -2. 0 + 2. 8 rc. BMI (kg/m 2/month) Range -2. 0 to 1. 53 Mean -0. 21 + 0. 42
Site of Onset Bulbar Extremity Gender Female Male ALS-FRS-R < 37 > 37 Age of Onset < 59 years > 59 years Vital Capacity < 71% > 71% Premorbid BMI Classification Under, Normal, and Over Weight Obese Time to Clinic < 13 > 13 rc. BMI -0. 28 + 0. 42 -0. 19 + 0. 42 -0. 17 + 0. 29 -0. 24 + 0. 50 -0. 26 + 0. 37 -0. 17 + 0. 49 -0. 19 + 0. 33 -0. 24 + 0. 50 -0. 25 + 0. 34 -0. 18 + 0. 37 -0. 15 + 0. 31 -0. 31 + 0. 55 -0. 26 + 0. 50 -0. 12 + 0. 20 P Value 0. 1027 0. 1543 0. 1317 0. 0573* 0. 0137** 0. 0012** 0. 0050**
Kaplan Meier Survival Analysis p. BMI Classification p = 0. 1822
Kaplan Meier Survival Analysis 1 BMI Classification p = 0. 020
Kaplan Meier Survival Analysis rc. BMI p = 0. 001
Kaplan Meier Survival Analysis Factor Gender Female Male Site of Onset Bulbar Non-bulbar Vital Capacity < 71% > 71% ALS-FRS-R < 37 > 37 Time to clinic < 13 > 13 Median Survival 31 30 26 34 25 36 23 36 24 37 P value 0. 6192 0. 0054* <0. 0001*
Cox Proportional Hazards Model Covariate Hazard Ratio 95% CI p value Time to clinic < 13 months Age > 59 yrs 1. 8140 1. 3832 to 2. 3791 <0. 0001 1. 7125 1. 2973 to 2. 2605 0. 0002 rc. BMI > - 0. 21 1. 6312 1. 2395 to 2. 1467 0. 0005 Non Obese 1. 3030 0. 9437 to 1. 7991 0. 1096 Bulbar Onset 1. 2519 0. 9371 to 1. 6725 0. 1304
Conclusions � Early and rapid rc. BMI is a poor prognostic indicator � Bulbar onset patients did not have a significantly greater rc. BMI � 1 BMI classification was only modestly associated with prognosis � Study limited by depending upon self reported premorbid weight
Future Questions � What happens to rc. BMI after the diagnosis? � Will rc. BMI improve with �Aggressive nutritional support �Noninvasive ventilation � Should rc. BMI be taken into account in future treatment trials?
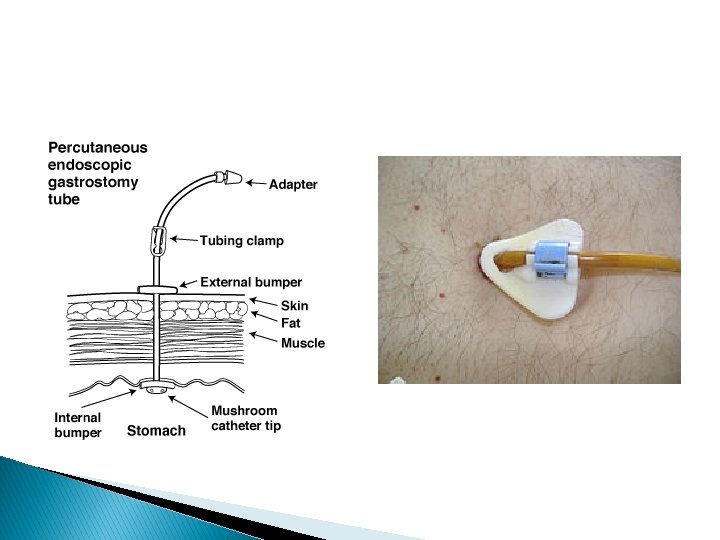
Gastrostomy in ALS
Gastrostomy Timing � Weight loss >10% compared to premorbid weight � VC < 50% of predicted � Symptoms ◦ Frequent choking / evidence for aspiration ◦ Lengthy meals � Practical considerations
Percutaneous endoscopic gastrostomy in amyotrophic lateral sclerosis: Effect on survival Spartaro et al. . J Neurol Sc 2011; 304: 44 -48
Percutaneous endoscopic gastrostomy in amyotrophic lateral sclerosis: Effect on survival Spartaro et al. . J Neurol Sc 2011; 304: 44 -48 �Bulbar Onset Extremity Onset P = 0. 14 PEG 28 mos no PEG 25 mos P=. 046 PEG 44 mos no PEG 36 mos
Survival curves of the RIG group ( )and PEG group (-----) Chiò A et al. J Neurol Neurosurg Psychiatry 2004; 75: 645 -647 Median survival from RIG/PEG 204 days vs 85 days, p=0. 004
Gastrostomy in patients with ALS (Progas): a prospective cohort study Pro. Gas Study Group Lancet Neurology Vol 14 Jul 2015
Gastrostomy in patients with ALS (Progas): a prospective cohort study Pro. Gas Study Group Lancet Neurology Vol 14 Jul 2015
Cox Proportional Hazards Model for Survival After Gastrostomy � Worse survival with ◦ Greater weight loss from dx to gastrostomy ◦ Increasing age at time of dx � No differences found related to ◦ VC at time of procedure ◦ Procedure type
Weight Changes after Gastrostomy � 25% gained > 1 kg � 25% lost/gained < 1 kg � 49% lost > 1 kg ◦ Continued weight loss at 3 months was associated with poor survival
Gastrostomy tube placement by endoscopy vs radiologic methods in patients with ALS Allen JA. Et al Amyotrophic Lateral sclerosis & Frontotemporal Degeneration. 14(4): 308 -14, 2013 May. � Failed placement ◦ 15. 7% PEG ◦ 1. 9% of RIGs � Post-procedure aspiration ◦ 10. 5% PEG attempts ◦ 0% RIG attempts ◦ Increased with worsening ALSFRS swallowing score
Survey of current enteral nutrition practices in treatment of amyotrophic lateral sclerosis Zhang M, Hubbard J, Rudnicki SA et al. Clin Nut ESPEN 2013; 8: e 25 -28 Zhang M, Hubbard � Survey of ALS clinics regarding enteral nutrition (EN) in patients with ALS � 148 respondents (50% RDs) ◦ Estimated only half patients fully compliant with EN recommendations ◦ Suspected reasons for non-compliance �Side effects (fullness, diarrhea, constipation, and bloating) most common �Dependence on caregivers �Rare - depression/hopelessness ◦ Half estimated more than 25% of patients continued to lose weight after starting EN
Diet and Survival – Animal Studies Courtesy of Jeff Elliott MD, UTSW
Is there a ‘best diet’ in ALS? Author n = Time Results Oliveria, et High protein al 20 6 mos No change in muscle mass or ALS progression Silva, et al High protein 16 4 mos Stabilization of ALS-FRS Dorst, et al - High fat, high calorie - High carbohydrate, high calorie 22 3 mos Wt stabilized ALS-FRS progressed Wills, et al Diet 16 - High fat, high 8 calorie (Oxepa) - High carb, high 9 calorie (Jevity 1. 5) 7 - Control (Jevity) High drop out rate with High carb/high calorie 4 mos High carb, high calorie fewer AEs, dropouts, deaths
Conclusions � Early changes in weight and BMI are associated with a poor prognosis in ALS � Caloric needs in ALS are likely higher than expected � Studies of survival benefits of gastrostomy ALS variable � PEG vs RIG vs PIG? � Unanswered questions about dietary recommendations in ALS
Acknowledgements UAMS ALS Team & Kara Way, MD Work supported by the Kathryn and J Thomas May Fund for ALS