
WEEK 3 INFORMATION TECHNOLOGY PROJECT MANAGEMENT Magister Sistem







- Slides: 27
WEEK 3 INFORMATION TECHNOLOGY PROJECT MANAGEMENT Magister Sistem Informasi Universitas Komputer Indonesia
PROJECT SELECTION
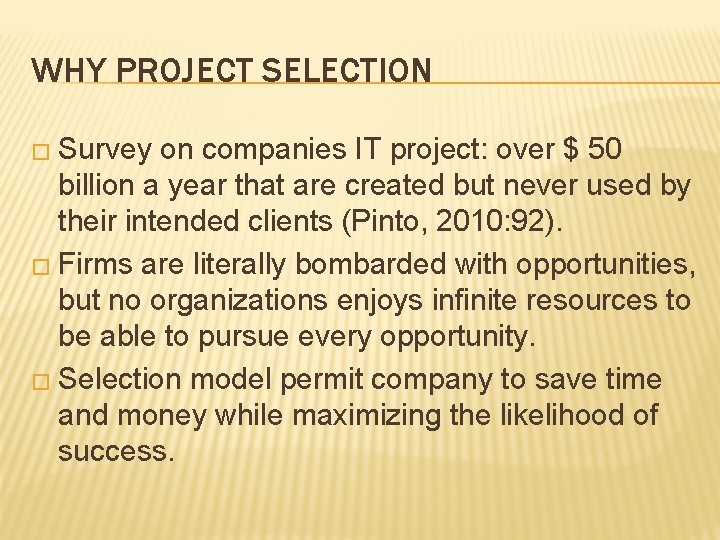
WHY PROJECT SELECTION � Survey on companies IT project: over $ 50 billion a year that are created but never used by their intended clients (Pinto, 2010: 92). � Firms are literally bombarded with opportunities, but no organizations enjoys infinite resources to be able to pursue every opportunity. � Selection model permit company to save time and money while maximizing the likelihood of success.
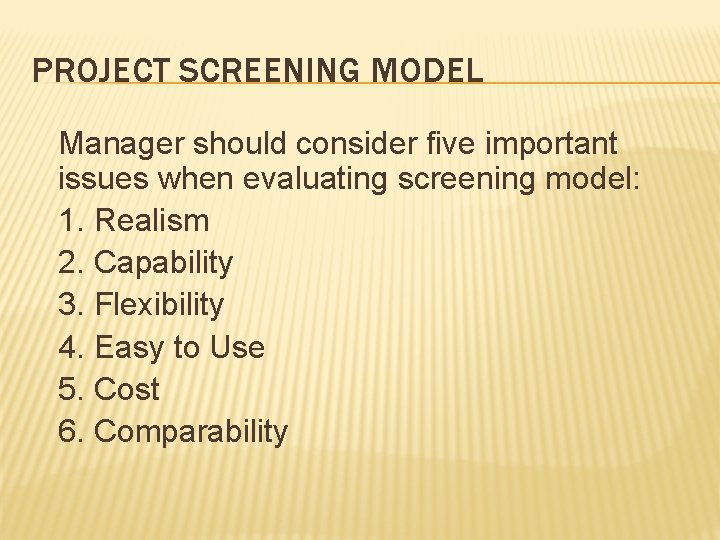
PROJECT SCREENING MODEL Manager should consider five important issues when evaluating screening model: 1. Realism 2. Capability 3. Flexibility 4. Easy to Use 5. Cost 6. Comparability
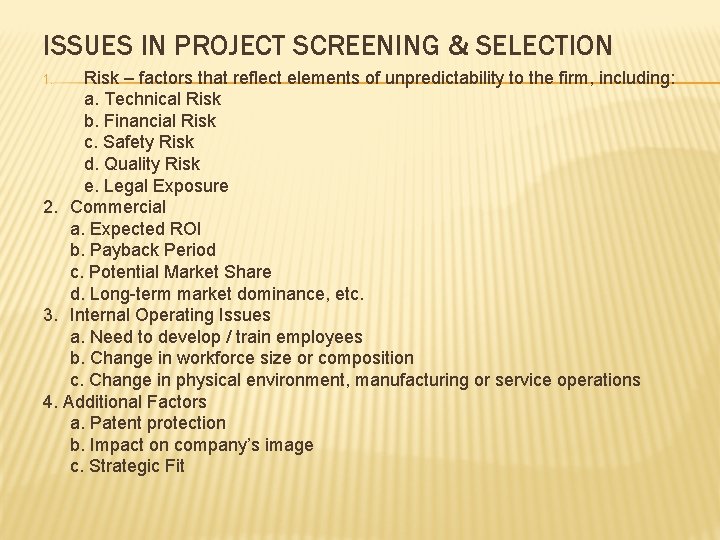
ISSUES IN PROJECT SCREENING & SELECTION Risk – factors that reflect elements of unpredictability to the firm, including: a. Technical Risk b. Financial Risk c. Safety Risk d. Quality Risk e. Legal Exposure 2. Commercial a. Expected ROI b. Payback Period c. Potential Market Share d. Long-term market dominance, etc. 3. Internal Operating Issues a. Need to develop / train employees b. Change in workforce size or composition c. Change in physical environment, manufacturing or service operations 4. Additional Factors a. Patent protection b. Impact on company’s image c. Strategic Fit 1.
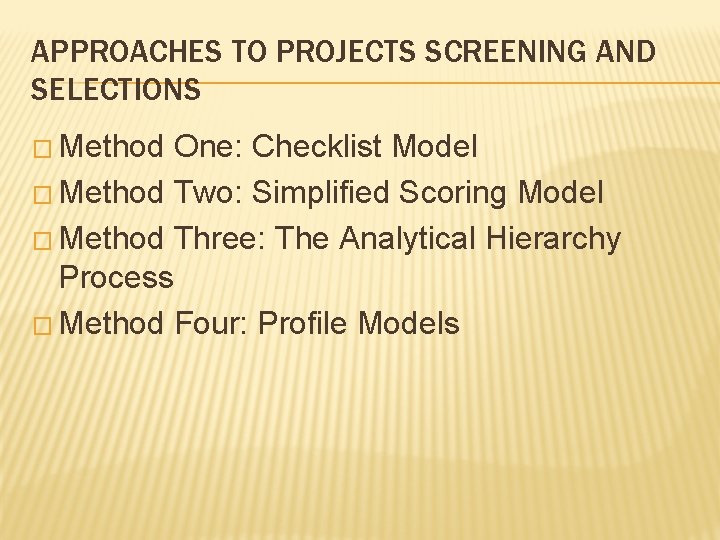
APPROACHES TO PROJECTS SCREENING AND SELECTIONS � Method One: Checklist Model � Method Two: Simplified Scoring Model � Method Three: The Analytical Hierarchy Process � Method Four: Profile Models
CHECK LIST MODEL
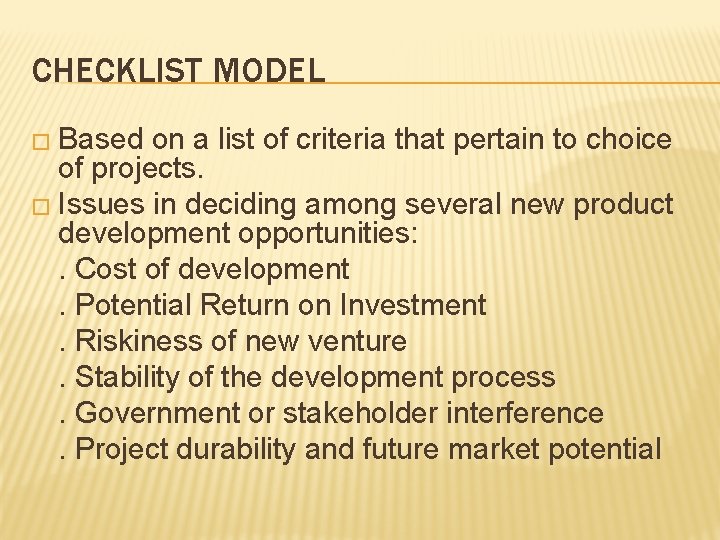
CHECKLIST MODEL � Based on a list of criteria that pertain to choice of projects. � Issues in deciding among several new product development opportunities: . Cost of development. Potential Return on Investment. Riskiness of new venture. Stability of the development process. Government or stakeholder interference. Project durability and future market potential
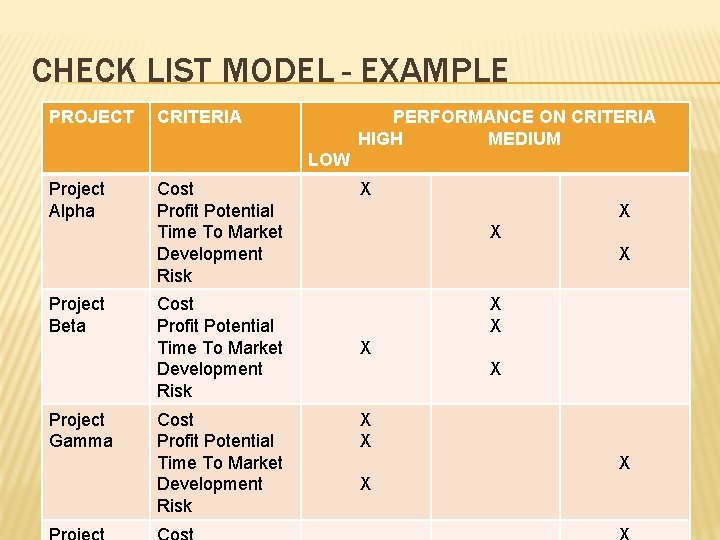
CHECK LIST MODEL - EXAMPLE PROJECT CRITERIA PERFORMANCE ON CRITERIA HIGH MEDIUM LOW Project Alpha Project Beta Project Gamma Cost Profit Potential Time To Market Development Risk X X X
SIMPLIFIED SCORING MODEL
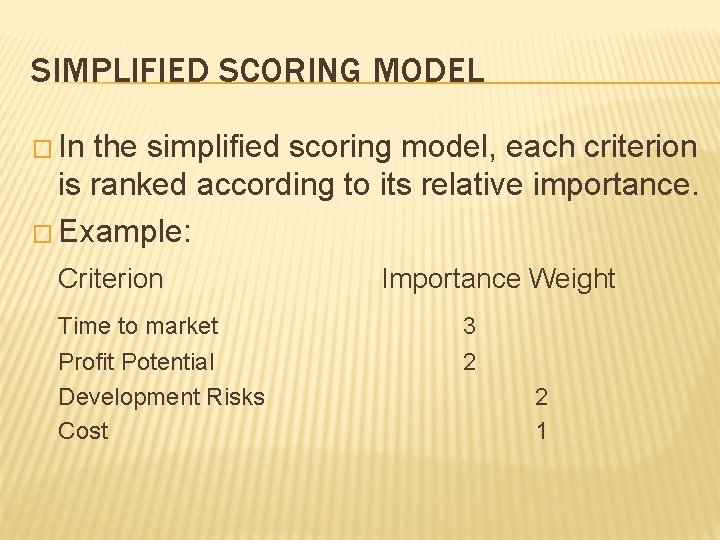
SIMPLIFIED SCORING MODEL � In the simplified scoring model, each criterion is ranked according to its relative importance. � Example: Criterion Importance Weight Time to market 3 Profit Potential Development Risks Cost 2 2 1
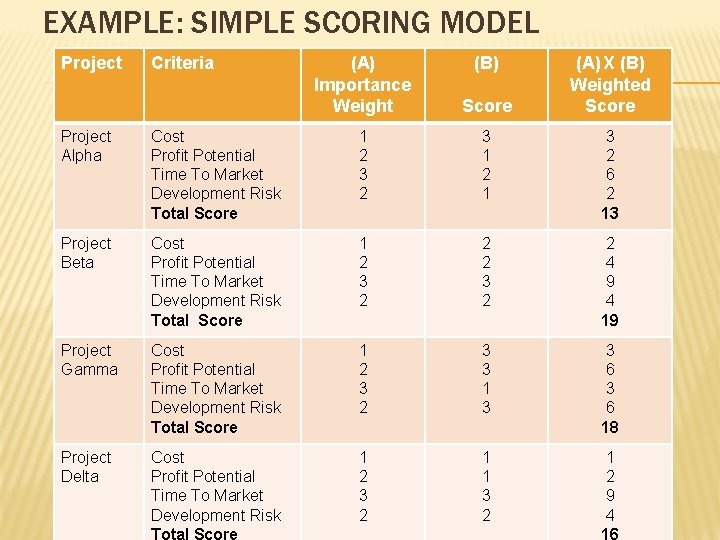
EXAMPLE: SIMPLE SCORING MODEL Project Criteria (A) Importance Weight (B) Score (A) X (B) Weighted Score Project Alpha Cost Profit Potential Time To Market Development Risk Total Score 1 2 3 1 2 1 3 2 6 2 13 Project Beta Cost Profit Potential Time To Market Development Risk Total Score 1 2 3 2 2 4 9 4 19 Project Gamma Cost Profit Potential Time To Market Development Risk Total Score 1 2 3 3 1 3 3 6 18 Project Delta Cost Profit Potential Time To Market Development Risk Total Score 1 2 3 2 1 1 3 2 1 2 9 4 16
ANALYTICAL HIERARCHY PROCESS
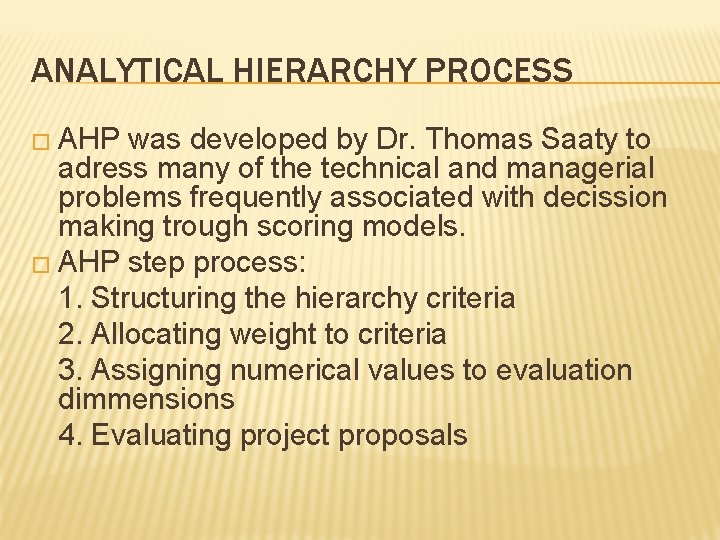
ANALYTICAL HIERARCHY PROCESS � AHP was developed by Dr. Thomas Saaty to adress many of the technical and managerial problems frequently associated with decission making trough scoring models. � AHP step process: 1. Structuring the hierarchy criteria 2. Allocating weight to criteria 3. Assigning numerical values to evaluation dimmensions 4. Evaluating project proposals
PROFILE MODELS
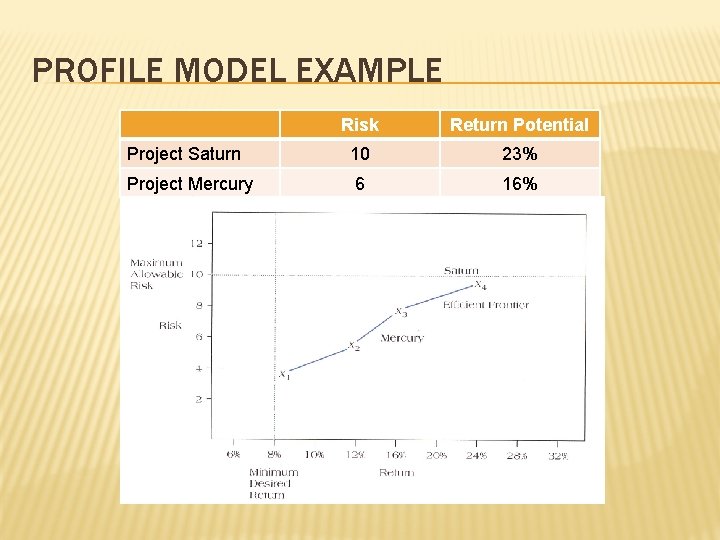
PROFILE MODELS � Profile Models allow managers to plot risk/return options for various alternatives and then select project that maximizes return while staying within a certain range of minimum acceptable risk.
PROFILE MODEL EXAMPLE Risk Return Potential Project Saturn 10 23% Project Mercury 6 16%
FINANCIAL MODELS
TIME VALUE OF MONEY � Financial models are all predicated on the time value of money. � Money earned today is worth more than money we expect to earn in the future.
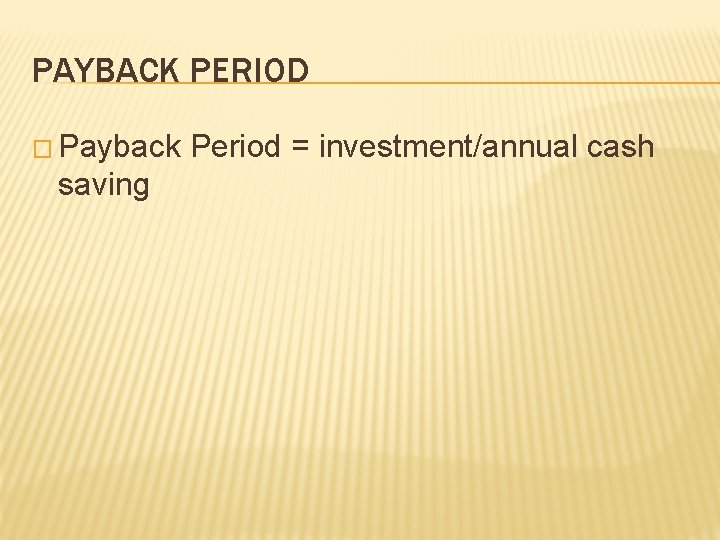
PAYBACK PERIOD � Payback Period = investment/annual cash saving
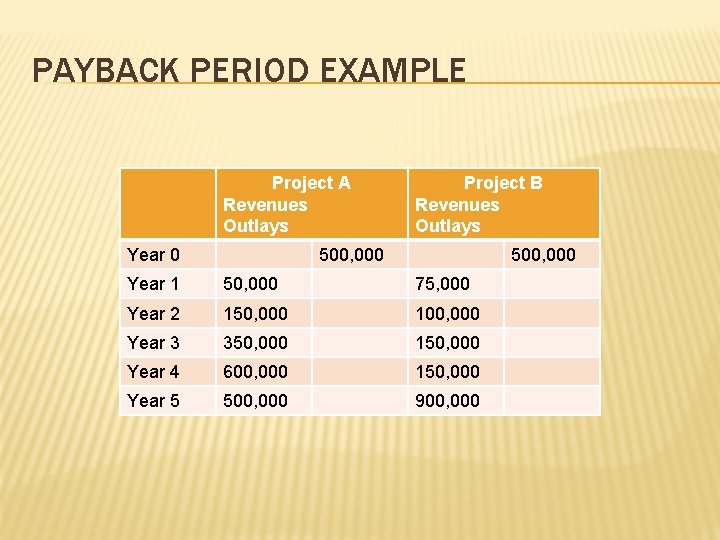
PAYBACK PERIOD EXAMPLE Project A Revenues Outlays Year 0 Project B Revenues Outlays 500, 000 Year 1 50, 000 75, 000 Year 2 150, 000 100, 000 Year 3 350, 000 150, 000 Year 4 600, 000 150, 000 Year 5 500, 000 900, 000
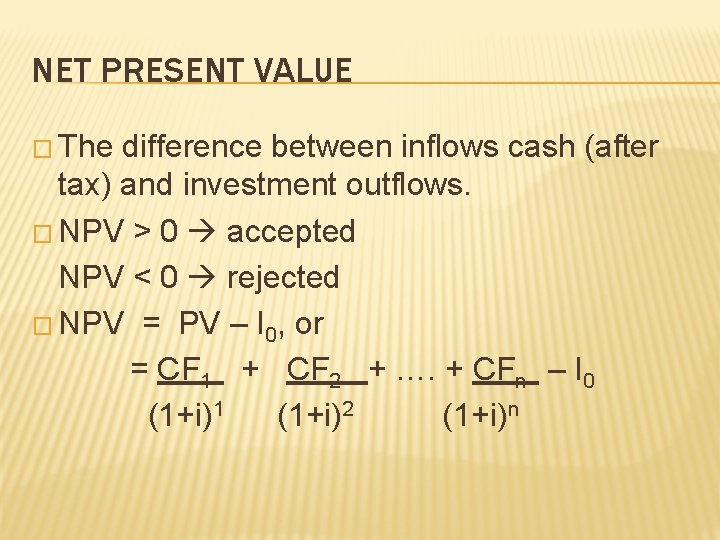
NET PRESENT VALUE � The difference between inflows cash (after tax) and investment outflows. � NPV > 0 accepted NPV < 0 rejected � NPV = PV – I 0, or = CF 1 + CF 2 + …. + CFn – I 0 (1+i)1 (1+i)2 (1+i)n
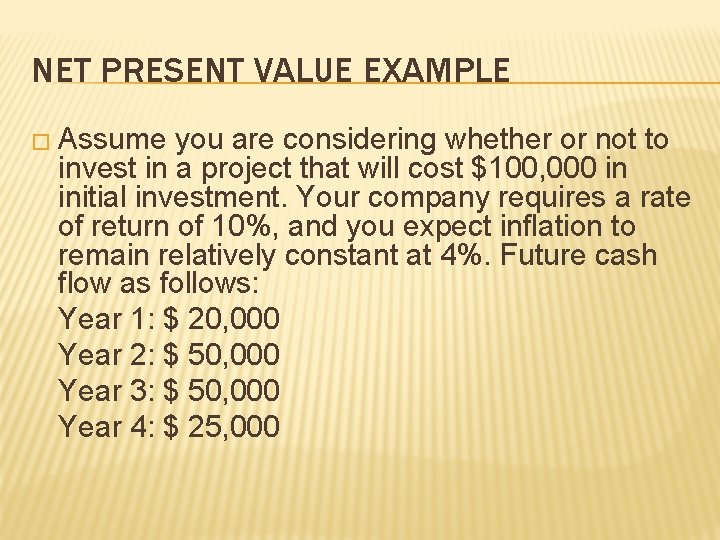
NET PRESENT VALUE EXAMPLE � Assume you are considering whether or not to invest in a project that will cost $100, 000 in initial investment. Your company requires a rate of return of 10%, and you expect inflation to remain relatively constant at 4%. Future cash flow as follows: Year 1: $ 20, 000 Year 2: $ 50, 000 Year 3: $ 50, 000 Year 4: $ 25, 000
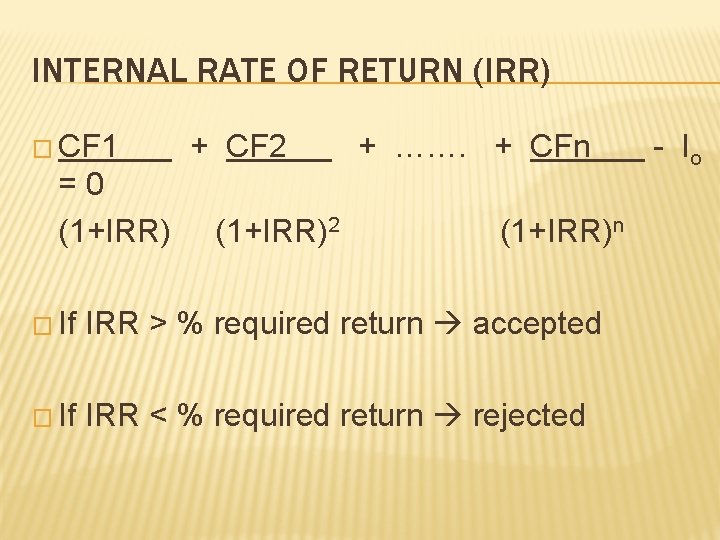
INTERNAL RATE OF RETURN (IRR) � CF 1 + CF 2 + ……. + CFn - Io = 0 (1+IRR)2 (1+IRR)n � If IRR > % required return accepted � If IRR < % required return rejected
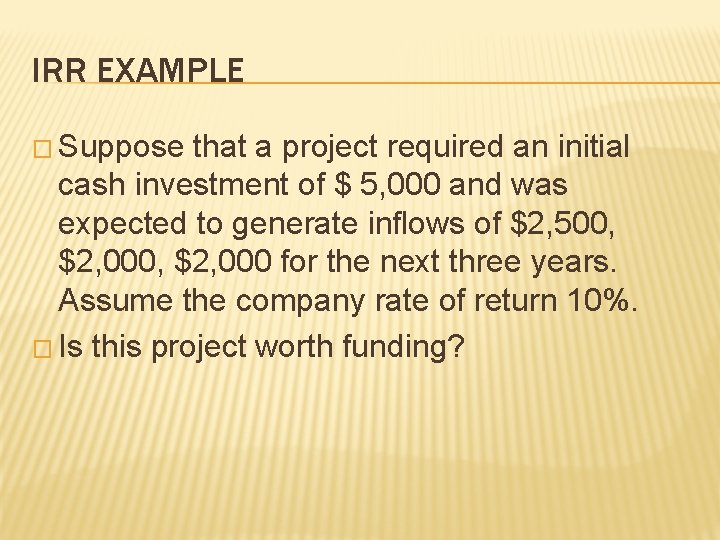
IRR EXAMPLE � Suppose that a project required an initial cash investment of $ 5, 000 and was expected to generate inflows of $2, 500, $2, 000, $2, 000 for the next three years. Assume the company rate of return 10%. � Is this project worth funding?
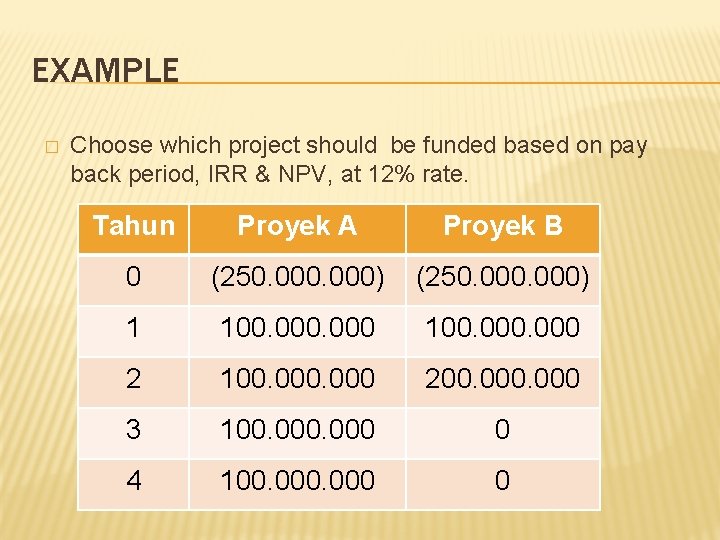
EXAMPLE � Choose which project should be funded based on pay back period, IRR & NPV, at 12% rate. Tahun Proyek A Proyek B 0 (250. 000) 1 100. 000 2 100. 000 200. 000 3 100. 000 0 4 100. 000 0