Weather Station Models Isobars Isotherms What do Weather

Weather Station Models Isobars & Isotherms

What do Weather Map Symbols look like?

What does a weather station tell us? § The sky around the weather observation station including the amount of cloud cover § The present weather conditions including precipitation type and amount. § The visibility (measured in miles) § The air temperature and dew point (both in degrees Fahrenheit § The wind speed and direction § The barometric pressure (measured in millibars) and the pressure trend.

Cloud Cover § Cloud cover is represented by a pie graph. The amount of the circle that is dark is used to indicate the portion of the sky covered by clouds. It can be empty (0%), shaded by 25%, 50%, 75% or 100%.

Temperature § Temperature, also known as dry bulb temperature, will always be the first number written on the upper left hand side of the model.

Dew Point § Dew point is the temperature at which the air would be saturated with water vapor. Although dew point is a temperature it is an indicator of the absolute humidity.

Wind Direction § A line connected to the circle indicates wind direction. Remember wind is always named according to the direction it is coming from.
 pressure is recorded as a three digit number. It")
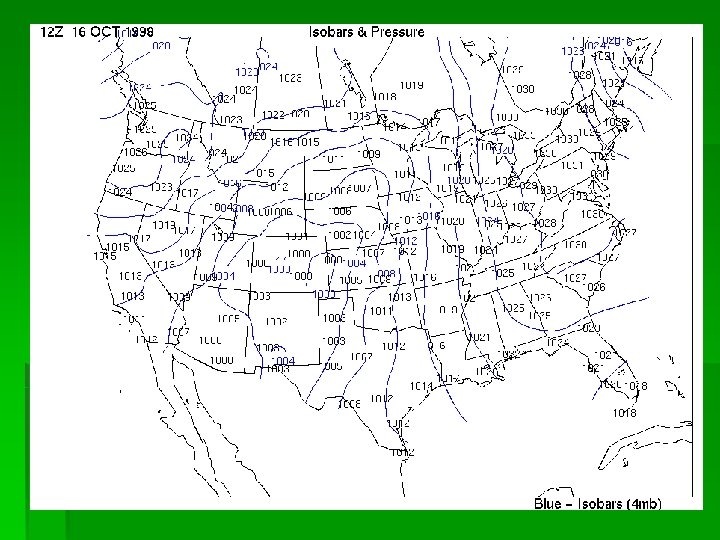
Barometric Pressure § Barometric (air) pressure is recorded as a three digit number. It helps to realize that the normal barometric pressure at Earth’s surface is generally 1000 millibars (mb).
 Pressure § Study This!!!!!! § If the three digit")
How to Interpret Barometric (Air) Pressure § Study This!!!!!! § If the three digit code is less than 500 (499 or less) add a 10 at the beginning and a decimal point before the last number. § If the three digit code is greater than 500 (500+) add a 9 before the number and a decimal before the last digit.

Practicing Interpreting Barometric Pressure § Decode these coded pressures: § 002 = _______ § 993 = _______ § 280 = _______ § 000 = _______ § 480 = _______
- Slides: 11