Weather Maps Meteorologists use the information they get


- Slides: 21
Weather Maps
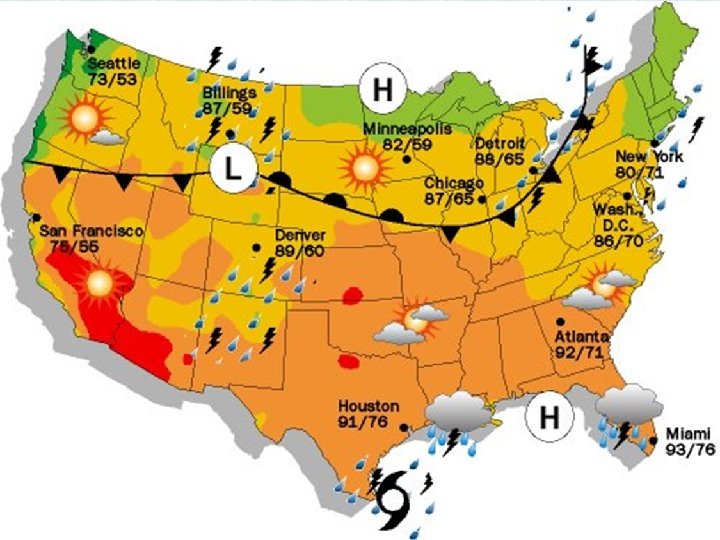
Meteorologists use the information they get using weather tools to make weather maps.
: s p a m r e h t a We shows the weather over a part of Earth’s surface. help meteorologists forecast the weather. show what the weather is like at a certain time, such as right now.
: s p a m r e h t a e W help scientists make predictions about what the weather will be in the future. A prediction is a guess about what will happen in the future. show temperature and precipitation may also show other types of weather data. will show a list of symbols called a key. The key tells you what the different symbols mean.
Weather maps show the movement of air masses An air mass is a large body of air with the same temperature and humidity throughout. Humidity is the amount of water vapor in the air. Humid air contains a lot of water vapor. An air mass can cover thousands of square kilometers.
There are four basic types of air masses: 1. Cold and dry 2. cold and humid 3. warm and dry 4. warm and humid.
Weather maps also show fronts. A front is a place where two different air masses meet. Triangles show a cold front. Half circles show a warm front. The triangles and half circles point in the direction the front is moving.
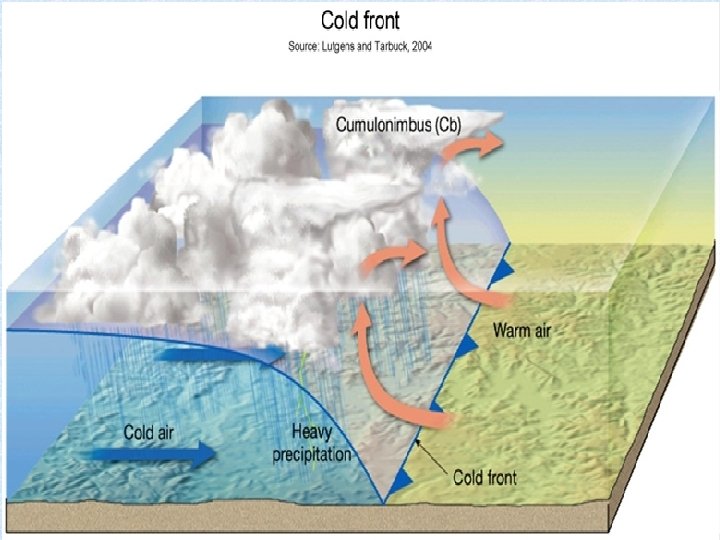
d l Co t n o r F a cold air mass bumps up against a warm air mass. Strong storms happen at cold fronts. Thunderstorms are likely in warm weather. In winter, snowstorms are likely. When a cold front passes over an area, the temperature drops.
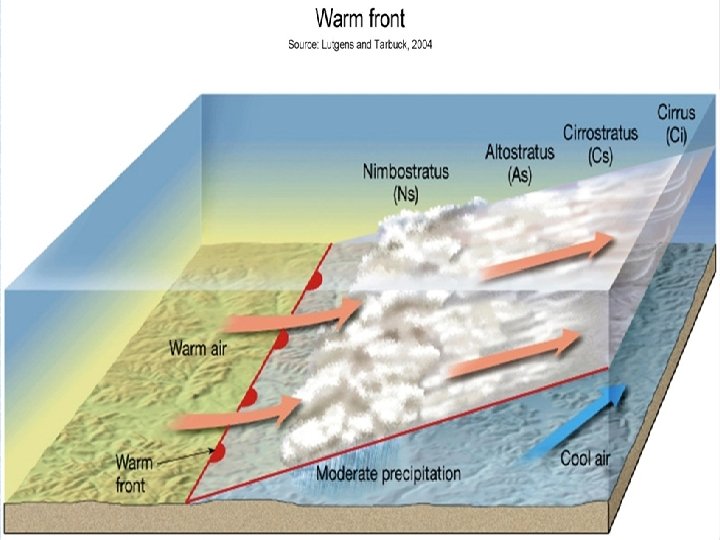
Warm Front warm air mass meets a colder air mass and slowly rides up over it. Sheets of gray clouds form at warm fronts and often bring rain. After a warm front passes over an area, the temperature rises.
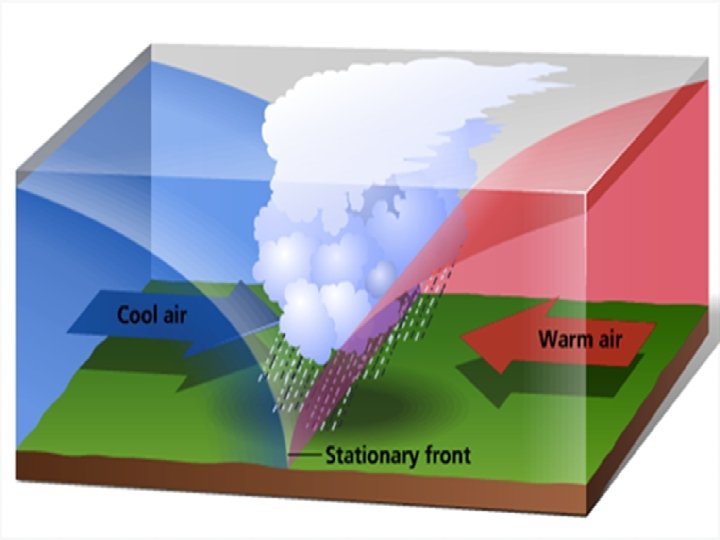
Stationary Front forms when two air masses meet and stop moving. Clouds and precipitation form at a stationary front.
Weather maps also show air pressure. When you look at weather maps, you will also see circles with H’s or L’s inside them. The H stands for “high”. A high is an area of high air pressure. Highpressure areas usually bring fair weather The L stands for “low”. A low is an area of low-pressure. Lowpressure areas usually bring storms.
Recording the Weather • Data used to make weather maps come from local weather stations all over the world. A weather station is a place where weather data are collected. You can use simple weather tools to gather temperature, precipitation, and other data about the weather where you live. Then you can record the data in a table like the one below, or on a graph.
Discussion Question: Why are weather maps useful?
Lesson Review 1. What does a key on a weather map tell you? a. What symbols on the map mean b. What today’s temperature is c. Where mountains are located d. How to predict the weather
2. What does the letter H on a weather map show? a. An area of high pressure b. A high front c. An area of high mountains d. An area of high temperatures
3. Look at this weather map symbol. What does the symbol stand for? a. Stationary front b. Cold front c. Warn, dry air mass d. Warm front
4. What is a front? a. A place where air masses meet b. The front part of a storm c. An area of very high wind d. An area that has fair weather.