Weather and Climate Unit Mrs Weimer 1 2


- Slides: 100
Weather and Climate Unit Mrs. Weimer 1
2
3
Climate Weather Definition Describes the average conditions expected at a specific place at a given time. Describes the atmospheric conditions at a specific place at a specific point in time. Time Frame Long term: Months, years, decades, or longer Short term: Minutes, hours, days, or weeks Determined by: Aggregating weather Real-time measurements statistics over periods of 30 of atmospheric pressure, years ("climate normals"). temperature, wind speed and direction, humidity, precipitation, could cover, and other variables Study Climatology Meteorology 4
ATMOSPHERE AND CLIMATE • Weather - A description of short-term physical conditions of the atmosphere. • Climate - A description of the long-term weather pattern in a particular area. – Temperature – Humidity – Wind – Rainfall 5
The Atmosphere • The atmosphere is a thin layer of gasses surrounding the Earth. – If the Earth were the size of an apple, the atmosphere would be the skin. 6
Layers of the Atmosphere 7
Weather – The condition of the atmosphere at a certain time & place. Strongly affected by the amount of water vapor in the air. What affects the weather? ? WATER AND THE SUN
Driven by… 9
TASK Describe the differences between climate and weather in exactly 25 words 5 minutes End
Clouds Cloud - A collection of tiny water droplets or ice crystals. Fog – A cloud that forms or descends close to the surface of the Earth. Cloud Types: Cumulus – puffy, cottony appearing clouds. Forecasts fair weather conditions. Stratus – Layered or sheet like clouds covering a large area. Forecasts continuous rainy conditions. Cirrus – Thin, feathery, high altitude clouds. Forecasts changing weather conditions. Nimbus-low, gray rain clouds CLOUDS: also based on altitude: Cirro=high, alto=mid, strato=low
TASK Sort the clouds and place them with the appropriate name 12
CLOUD NAME OPTIONS • • • Altocumulus Nimbo stratus Cirrostratus Altostratus Cirrocumulus Cumulus Stratus Cumulonimbus Cirrus Contrails 13
Cumulus 14
Stratus 15
Cirrus 16
Cirrostratus 17
Cirrocumulus 18
Cumulonimbus 19
Nimbostratus 20
Contrails 21
Altostratus 22
Altocumulus 23
• What do they mean? 24
25
Weird Clouds 26
27
TASK: LAB • cloud types poster project. docx 28
Review of Cloud Types 29
Precipitation Forms of Precipitation: Rain – Liquid form that is the most common. Sleet – Rain that freezes as it falls from altitude. Snow – Water vapor that changes into a solid, crystalline form. Hail – A layered, solid, ball of ice.
Air Masses Air Mass – A large volume of air with similar temperature and humidity. Maritime – Forms over water; moist. Continental – Forms over land; dry. Polar – Forms over polar regions; cold. Tropical – Forms over the tropics; warm. http: //www. classzone. com/books/earth_science/te rc/content/visualizations/es 2001 page 01. cfm
32
33
Fronts – The boundary between air masses. Weather changes when these air masses move and meet. Cold – Occurs when cold air moves in under a warm air mass. Strong winds, heavy precipitation, fast moving.
Warm – Occurs when warm air moves in over a denser, cold air mass and replaces it. Slower, has precipitation with warmer temperatures to follow. 35
Occluded – Occurs when a warm air mass is caught between two colder air masses. -Very slow moving and can have cool temperatures with large amounts of precipitation.
Stationary – Occurs when weak warm and cold air masses and there is not enough wind to move them. -Produces many days of cloudy, rainy weather. 37
http: //www. phschool. com/atschool/p hsciexp/active_art/weather_fronts/ 38
http: //www. phschool. com/atschool/p hsciexp/active_art/weather_fronts/ 39
TASK • You and your squad will launch the app for the Smithsonian Weather Lab • Click through and play with the app • Answer the questions on the following slide • https: //ssec. si. edu/weather-lab 40
Questions • 1. How do each of the ocean currents affect the weather (what do they do? ) • 2. Describe the air masses (what do they do, what do they represent)? • 3. Fill in the probability table with some of your picks, answer the questions. • 4. Complete the conclusion questions. 41
Brain Bender Pick a partner 42
weather Ring-dingding-ding Occluded Front Precipitation Air Mass Water Cycle 43
Weather and Air Pressure & Weather: Cyclones – Areas of low pressure with rising air spinning counter-clockwise. The rising air cools, condenses forming clouds and precipitation. Anticyclones – Areas of high pressure where sinking air spins clockwise. Causes dry, clear weather.
Thunderstorms – Small, intense weather systems that produce strong winds, heavy precipitation, lightning and thunder. -Forms along cold fronts associated with very low pressure systems. -T-Storms form the highest and most dangerous cloud type, the Cumulonimbuscloud. Thunder – The sound resulting from the rapid expansion of air caused by a lightning bolt.
46
Tornadoes – Small, intense, spinning funnel of air caused by extremely low pressure cells. -This occurs in roughly 1% of all thunderstorms. -75% of all world tornadoes occurs in the United States. -These happen most frequently in the late spring/early summer when cold, dry Canadian air meets warm, humid, southern air. -The average tornado travels about four miles with a path of 30 – 200 feet wide and wind speeds of up to 300 miles per hour. https: //cimss. ssec. wisc. edu/wxfest/Tornado/tornado. html
48
49
• Hurricanes – A very large tropical storm of very low pressure and they are the most destructive type of storm. – Also known as cyclones or typhoons, – they have wind speeds ranging from 80 – 180 miles per hour. – These storms form during the late summer in the tropics after the water has warmed up and can cause a destructive path as wide as 900 miles producing high winds and very heavy precipitation. • http: //scifiles. larc. nasa. gov/kids/Problem_Board/ problems/weather/hurricanebasics. swf
51
Forecasting – A prediction of the weather for the next three to five days. A meteorologist is a scientist who collects weather data and makes predictions about the weather. A three day forecast is about the most accurate and requires satellites and Doppler radar.
Tools Thermometer – Instrument that measures the temperature. Barometer – Instrument that measures air pressure. Anemometer – Instrument that measures wind speed. Weather Vane – Instrument that measures wind direction.
54
Heating the atmosphere • The earth receives energy from the sun by radiation – This is the transfer of energy as electromagnetic waves – The radiation absorbed by the land, water and atmosphere is changed into thermal energy
56
• Conduction is the transfer of thermal energy from one material through direct contact – Thus, the radiation from the sun is absorbed by black pavement and you walk on it with your bare feet and it burns them (b/c of conduction) • Thermal energy ALWAYS moves from warm to cold areas
58
• Convection is the transfer of thermal energy by the circulation or movement of a liquid or gas – So, the solar energy is in the form of radiation, conduction is what occurs through direct contact and convection is the mvmt of that heat in a circular pattern – When air becomes heated, it becomes less dense and rises, the cooler and is more dense and sinks, then gets warm again, and rises
60
61
The greenhouse effect • The greenhouse effect is the earth’s heating process in which gases in the atmosphere trap thermal energy and heat up the earth. – Radiating the heat back towards earth (acting like a blanket) • The gases in the atmosphere that cause this are CO 2 and Water Vapor
• http: //ed. ted. com/on/TM 3 svmbm
Pressure and Winds • Wind- moving air • Why does air move? – Differences in air pressure-the greater the pressure differences, the faster the wind moves – Difference in air pressure is caused by the uneven heating of the earth • Air at the equator is warmer and less dense and it rises, this creates an area of low pressure • Air at the poles is colder and more dense, so it is heavier and sinks, this creates an area of high pressure
• Pressure belts-almost like convection currents – Made of circular patterns caused by the rising and sinking of air and is called convection cells
• Coriolis effect- curving of the moving objects, such as wind, by the earth’s rotation – Because of this effect winds in the northern hemisphere curve to the right and those in the southern hemisphere curve to the left – (Coriolis effect is also seen in the river system with rivers in the northern hemisphere eroding their banks on the right and in the southern eroding their banks on the left – equal erosion for rivers N-S) – http: //www. classzone. com/books/earth_science/terc /content/visualizations/es 1904 page 01. cfm
Types of Winds • 2 main types of winds: local and global – Both are caused by uneven heating of the earth and pressure differences – Local winds-can blow in any direction and are short in distance – Global winds- are part of a pattern of air circulation that moves across the earth, and travel in a specific direction
Wind Types
• Trade winds- blow from 30 degrees to the equator on both sides of the hemispheres – Used to transport ships from Europe to America • Doldrums- low pressure area around the equator – Very little wind because of the low pressure area – Doldrum means foolish in old english because people who got their ships stuck there were foolish
• Horse latitude- area of high pressure at 30 degrees N and 30 degrees S latitude – Winds are weak – Given the name because ships who got stuck there and the horses were thrown overboard to save the drinking water for the sailors
• Westerlies- wind belts found in both hemispheres between 30 and 60 degrees Lat – Are in the opposite direction as the trade winds • Polar easterlies- wind belts from the poles to 60 degrees Lat in both hemispheres
• Jet streams- narrow belt of high speed winds that blow in the upper troposhere and lower stratosphere – Can have a max speed of 500 km/h – Does not follow a regular path around the earth – Controls the movements of storms – By flying in the direction of the jet stream, pilots can save time and fuel
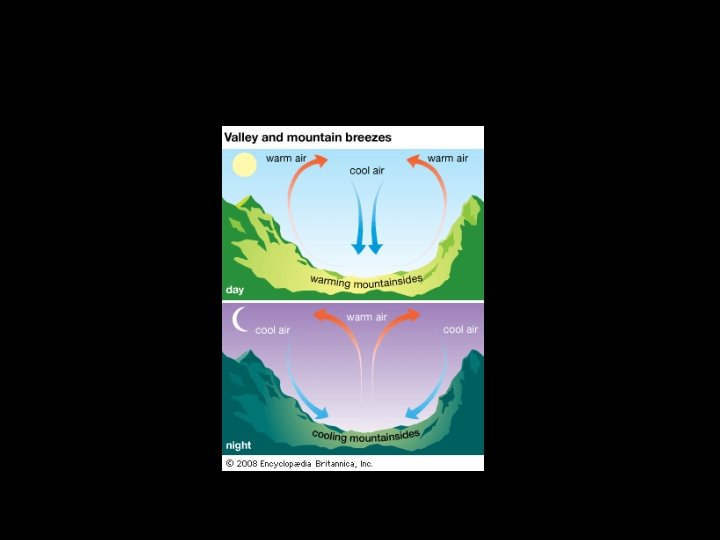
• Local Winds- influenced by geography of the area – During the day, land heats up faster than water and the land heats the air above it – At night, land cools faster than water and cools the air above the land – Valley and mountain breezes are also local winds – http: //www. classzone. com/books/earth_science/ terc/content/visualizations/es 1903 page 0 1. cfm? chapter_no=visualization
Find a partner Brain Bender
Trade winds Jet Stream Horse latitude Churros Layers T. SMITHE Coriolis effect
Climate 77
78
Solar Radiation • Visible light is energy waves that we can see as color. – These pass through the atmosphere. • Ultraviolet light is energy waves that we cannot see but can cause sun burns and cancer. – These are absorbed by ozone in the stratosphere. • Infrared radiation is the energy of the sun that we feel as heat. – This is absorbed by carbon dioxide and water in the troposphere. 79
Energy and the Greenhouse Effect • Solar Radiation – Of solar energy reaching outer atmosphere: • 25% reflected • 25% absorbed • 50% reaches earth’s surface – Of the solar energy that reaches the surface, much is reflected: • Fresh clean snow • Dark soil • Net average of earth 90% 3% 30% 80
Solar Radiation 81
Solar Radiation Cont’d • Greenhouse Effect – Infrared energy that reflects off the Earth’s surface is trapped by greenhouse gases such as carbon dioxide in the atmosphere. • This is a normal process that keeps our temperature levels in a certain range. • Currently, these gases are at unusually high levels due to human activities. • How will this affect the Earth’s climate? 82
Greenhouse Gases • Carbon Dioxide - Fossil-fuel burning. • Atmospheric levels increasing steadily. • Methane - Cattle, Coal-mines • Absorbs more infrared than CO 2. • Water Vapor – Formed from evaporation. • Chlorofluorocarbons (CFC’s) – Refrigerants and aerosols. (No longer used) • Nitrous Oxide - Burning organic material 83
Sources of Greenhouse Gas Emissions
How Does Global Temperature Affect Rain? • The amount of heat in the atmosphere directly affects the movement of water. • Warm air containing evaporated water rises higher into the atmosphere. – Warm air is less dense than cool air. • As warm air rises, heat is released into the atmosphere and the water vapor condenses. – The condensed water then falls as rain or snow. 85
Convection Currents 86
87
CLIMATE CHANGE IS A NATURAL PROCESS • Changes in climate have been observed throughout history. – There have been at least 5 major ice ages. – The sun undergoes cycles where it releases different amounts of energy. – The Earth’s orbit can shift and tilt. • Example: Magnitude 8. 8 earthquake in Chile shorted the Earth’s day by 1. 26 millionths of a second. 88
Global Warming Timeline • 19 th century: Beginning of industrial revolution • 1958: Daily records of carbon dioxide levels start. – Venus found to have surface temperatures above boiling point. • 1970: First Earth day. • 1973: Arab embargo -- energy crisis. • 1977: Scientific opinion converges on global warming as the major climate risk. • 1981: Warmest year on record. • 1995: Reports on breaking up of Antarctic ice shelf. • 1997: Kyoto protocol established. • 1998: Strong El Nino produces warmest year on record. • 2003: Deadly European heat wave / major ice sheets collapse 89
90
Measuring Carbon Dioxide in the Atmosphere • There is a carbon dioxide detector in Mauna Loa in Hawaii. – This allows measurements far away from cities and forests. – The winds over Mauna Loa have come thousands of miles across the Pacific Ocean, swirling and mixing as they traveled.
Measuring Carbon Dioxide in the Atmosphere • Keeling’s first measurement, in March of 1958, was 0. 0314 percent. – Slightly higher in the winter. – Slightly lower in the summer. – Why? Photosynthesis • These levels have rose steadily over the last 50 years.
Figure 09. 12
Figure 09. 09
Carbon Dioxide-Temperature “Hockey Stick Graph • All temperature data prior to the 19 th century is retrieved as a result of “proxies” – Tree Rings – Ice Core Layering • Water naturally occurs in two isotopes: • H 216 O and H 218 O • Higher amounts of the H 218 O are found in colder temperatures. 95
Older Climate Data? • The data presented only goes back about 650, 000 years. – Limited by the age and extent of the Antarctic glaciers. • Deep sea cores have also been measured: 96
97
Global Warming Effects on Glaciers • Only about 1% of the world’s sheet ice is located in temperate (non-polar) regions, but these are close in proximity to human populations. – Himalayan glaciers are the sources of Asia’s biggest rivers – Biggest single source of water for the entirety of southern Asia. 98
LARGEST GLACIER CALVING EVER FILMED 99
TASK: In 25 words exactly, describe the effects of climate change on the planet. 100