Wealth mobility and inequality The role of inheritance
 Presentation at")
Wealth mobility and inequality: The role of inheritance Daniel Waldenström (Uppsala University) Presentation at Winter School, Canazei, January, 2015 1

Starting point • Two ways to become rich: 1. Save out of one's income (self-made) 2. Receive transfers from others (inheritance) • How important is inherited wealth? Inheritances / national income (%) Inherited wealth / All wealth (%) 2

This presentation Two empirical investigations using Swedish data. 1. Intergenerational wealth mobility: The role of inheritance (with Adrian Adermon and Mikael Lindahl, 2015) 2. Inheritance and wealth inequality: Evidence from register data (with Mikael Elinder and Oscar Erixson, 2015) 3

The concept of wealth • Marketable net wealth – Sum of non-financial and financial assets less debts – Mostly observed in tax-assessments (adj. to market values) – Sometimes estate inventory reports • This wealth concept does not include. . . – Unfunded pension assets (Defined Benefit) – Tax-evaded wealth – Human capital 4

The concept of inheritance • We focus on material transfers – Excludes genes, networks, attitudes etc. – Measurement is not trivial (neither conceptually nor empirically) • Two channels of intergenerational transfers – Bequests (at death) – Gifts during life (inter vivos) 5
 and transfers (gifts, B) over life Marriage Gen 1 F")
Sketch of wealth (W) and transfers (gifts, B) over life Marriage Gen 1 F M Death Inter vivos gifts Gen 2 Death 6

#1: Intergenerational wealth mobility and the role of inheritance (with Adrian Adermon and Mikael Lindahl, 2015) 7

Starting point • Does personal wealth status persist over more than two generations? • How important is inheritance as a driver of this persistence? 8

Previous literature • Wealth mobility – Two-generational IGEs: Menchik 1979; Charles and Hurst 2003; Wahl 2002; Britain: (Harbury and Hitchens 1979) – Three-gen 0. 1– 0. 3 (Wahl 2002; Arrondel and Grange 2006; Boserup et al 2014). • Multigenerational effects – Importance of long-term social mobility over and above parents • Lindahl et al. (2015), Clark and Cummins (2014), Boserup et al. (2014), Long and Ferrie (2013) • Role of inheritance in IG wealth mobility – Adoptees in Sweden (Black et al, 2015) – Korean adoptees in Norway (Mogstad et al, 2015). 9
 • Survey of all third-graders in Sweden’s third largest city, Malmö,")
Data (study population) • Survey of all third-graders in Sweden’s third largest city, Malmö, in 1938 • Dataset used by several studies, e. g. , Lindahl et al (2015). • Four linked generations – – Index generation (1928) + spouses Parents (1898) Children (1957) Grandchildren (1986) • Observe wealth, income, and education • LHS always individual; RHS always family 10

Wealth data • 11

Data: Wealth in 1945 of generation 1 • 12
, inheritance • 13")
Data: Wealth at death (estate wealth), inheritance • 13

Descriptives 14

Estimating intergenerational wealth mobility • 15
 16")
Wealth regressions: Main (wealth ranks) 16

Four-generational persistence 17

By age 18

Life-cycle effects: Midlife vs Terminal W 19

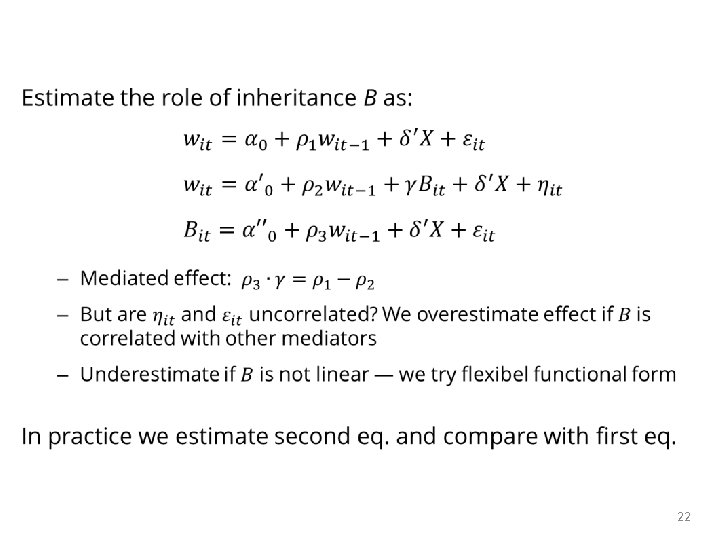
Estimating the role of inheritance • 20

Role of inheritance: W without B 21

Role of inheritance: Flexible controls 23

Role of other factors: Human capital, Skills 24

Role of other factors: Human capital, Skills 25

Nonlinearities: Spline regressions 26

Non-linearities: 2 nd Gen on 1 st Gen 27

Non-linearities: 3 rd Gen on 2 nd Gen 28
 robust to using: • Wealth censored at zero •")
Robustness checks Results are (basically) robust to using: • Wealth censored at zero • Wealth in IHS, log and level • Adjusted taxable wealth values • Single wealth year for 2 nd generation 29

Conclusions on IGW and inheritance Main conclusions 1. Most IG wealth transmission comes from parents; cannot reject AR(1)-type model 2. Direct inheritances accounts for most (50– 75 %) of the intergenerational wealth persistence Additional contributions 1. Mid-life wealth captures more transmission than terminal wealth 2. Wealth persistence patterns visible even at young ages 3. Non-linear relationship — more persistance in the top 4. Some evidence of increasing persistence over time 30

#2: Inheritance and wealth inequality: Evidence from register data (with Mikael Elinder and Oscar Erixson, 2015) 31
 more unequally distributed • Flows of inherited")
Starting point • Wealth has become (somewhat) more unequally distributed • Flows of inherited wealth has increased • How do bequests influence the wealth distribution of heirs? • “. . . Inheritance perpetuates and may intensify inequalities arising originally from other causes. … The extent of its influence on distribution remains an open question, which cannot be decided merely by theoretical reasoning. . . but requires in addition something in the nature of a quantitative analysis of the relevant facts. ” Wedgwood, 1929, pp. 60 -61. 32
, Davies")
Earlier studies of inheritance and wealth inequality • Simulation evidence: – Atkinson (1971), Davies & Shorrocks (1978): Real world wealth distribution more skewed than wealth distribution based on lifecycle wealth only. ⇒ Inheritance increases wealth inequality – Blinder (1973): US parameters. ⇒ Ambiguous effect, mostly increasing – Davies (1982): Canadian evidence ⇒ Inheritance major cause of W_ineq • Empirical evidence: – – Wolff (2003), Gittleman & Wolff (2014): SCF ⇒ Equalizing Klevmarken (2004): HUS data. ⇒ Equalizing Karagiannaki (2011): UK surveys. ⇒ Small, equalizing effect Crawford & Hood (2015). UK survey of elderly. ⇒ Equalize or no effect – Boserup et al (2015). Danish register ⇒ Dis-equalizing effect 33

Population register data on inheritance • New Swedish database: All decedents and all theirs • Inheritance years (cohorts): 2002− 2005 • Details about estates, inheritances (incl. 0’s), insurances, taxable gifts – Problem: Undervaluation of some assets (e. g. , family firms) – Problem: Gifts (we only observe taxable gifts made in last 10 yrs) • Panel data on marketable net wealth of heirs – Third party-reported. Excludes pension funds, unlisted firms • ⇒ Leaves us with: 200, 000 decedents and 600, 000 heirs 34

What we find • 35

Causal effect • Di. D approach: – Compare evolution of wealth distributions across cohorts • We analyze cohorts: – Presumption: Everybody inherits at some point in life (whether much or nothing) – Cohorts of those who inherit vs. those who have not yet inherited • Counterfactual is thus not a world without inheritances 36

Descriptives of heirs Cohort: Gross inheritance, in SEK Net inheritance, in SEK Paying inheritance tax Net worth T-1 in SEK Taxable labor income T-1, in SEK Age at inheritance, years Woman Marital status Married Education level Primary Lower secondary Upper secondary or post- grad. 2002 82, 520 73, 025 0. 329 638, 967 220, 041 54. 5 0. 507 0. 538 0. 308 0. 436 0. 246 2003 83, 430 73, 737 0. 330 590, 612 224, 993 54. 6 0. 505 0. 532 0. 295 0. 441 0. 254 2004 88, 791 78, 131 0. 342 625, 364 227, 687 54. 9 0. 507 0. 527 0. 290 0. 444 0. 257 2005 na na na 691, 191 234, 903 55. 1 0. 506 0. 523 0. 280 0. 449 0. 262 37
 Total class 1 Child Grandchild Great grandchild Total")
Who inherits? Cohort (% of heirs) Total class 1 Child Grandchild Great grandchild Total class 2 Father Mother Sibling Nephew/niece Grandchild of sibling Total class 3 Grandparents, uncles, aunts Others (foster child, stepchild) Number of observations 2002 62. 7 56. 7 5. 7 0 33. 2 0. 7 1 9. 1 18. 3 2. 9 0. 1 2003 63. 3 57. 1 5. 9 0 32. 6 0. 8 1. 1 9 17. 7 3 0. 1 2004 61. 8 55. 6 6 0. 1 33. 9 0. 7 1 8. 9 18. 7 3. 3 0. 1 2005 65. 1 59. 4 5. 4 0 28. 2 0. 8 1. 1 8. 2 15 2. 4 0. 1 0 4. 0 162, 207 0 4. 0 159, 292 0 4. 2 150, 914 0 3. 9 150, 414 38

Distribution of inheritances 39

Distribution of wealth among heirs in t-1 40

Identification • 41

Results: Distributional graphical analysis Inheritance + Macro + Cohort effects No inheritance: Cohort 2004 in same years (t-3, t-1) No inheritance: Cohort 2002 t-3, t-1 No inheritance: Cohort 2002 in same years (t-5, t-3) 42
 No inheritance: Di. D (placebo")
Distributional graphical analysis Inheritance + Cohort effects (Macro removed) No inheritance: Di. D (placebo vs control) Inheritance effect No inheritance: Control 43

Wealth inequality effects Wealth gini of heirs in 2002 -cohort 44

Wealth inequality effects Wealth gini of heirs in 2002/2004 -cohorts 45
 (2) (3) (4) (5) (6) (7) (8)")
Di. D regression estimates: Main model (1) (2) (3) (4) (5) (6) (7) (8) (9) Outcome: Gini P 90/P 50 P 99/P 50 Top 1% Top 10% Bot. 50% P 75 -P 25 P 99 -P 1 CV -0. 023** -0. 029*** 259, 586* -4. 320 Treatment -0. 035*** -0. 601*** -1. 876** 0. 018*** 64, 998*** (0. 008) (0. 163) (0. 831) (0. 010) (0. 004) (0. 005) (15, 484) (128, 255) (3. 007) Ave in t-1 0. 802 6. 609 20. 618 0. 189 0. 556 -0. 015 765, 926 5, 545, 335 6. 79 Effect in % -4. 36 -9. 10 -12. 70 -5. 21 120 8. 49 4. 68 -63. 62 R-squared 0. 992 0. 988 0. 947 0. 996 0. 987 0. 999 0. 998 0. 647 Number of heirs 472, 413 472, 413 472, 413 Cohorts 3 3 3 3 3 Obs 24 24 24 46

Robustness checks Children-heirs only Add ”expected” inheritance Add consumer durables Unexpected deaths 47
 Main Treatment ‒ 0. 035*** (0. 008) Mean")
Robustness Di. D regressions Outcome: (1) Main Treatment ‒ 0. 035*** (0. 008) Mean of 0. 802 outcome t-1 Effect in % -4. 4 R-squared 0. 992 Number of heirs 472, 413 Cohorts 3 Observations 24 (2) Children ‒ 0. 039*** (0. 010) 0. 819 -4. 7 0. 991 266, 917 3 24 (3) Cons. dur. (4) (5) Adding future Unexp. death inh. (”younger”) ‒ 0. 031*** ‒ 0. 021*** ‒ 0. 067* (0. 006) (0. 005) (0. 036) 0. 769 0. 754 0. 924 -4. 0 0. 993 472, 413 3 24 -2. 9 0. 993 472, 413 3 24 -7. 3 0. 950 22, 129 3 24 48

Mechanism analysis • What explains the finding that inheritances reduce wealth inequality? • Two candidates: – The rich have more children – Inheritances are relatively more important lower down the distribution 49

Do the rich have more children? Number of children by estate size 50

Bequests relatively more important in the bottom Mean inheritance and inheritance/wealth across heirs wealth deciles Relatively more Absolutely more important in the bottom important in the top 51

Inheritance taxation: Did it matter in Sweden? • Progressive tax rate: 0, 10, 20, and 30 percent – But, the average, effective tax rate was rarely above 20 percent • Finding: The tax may actually have contributed to increased wealth inequality among heirs • Caveats: 1. A more progressive tax may yield a different result 2. Does not account for redistribution of inheritance tax revenues 3. Does not account for popular sentiments towards equalization 52

How can a progressive inheritance tax increase wealth inequality? Figure: Inheritance tax payments by wealth decile 53

Extensions • Alternative counterfactuals – 100% inheritance tax – Progressive redistributions of the inheritance tax – Look at full population (incl not year heirs and previous heirs) • Similar to survey evidence • Lifetime resources – Inequality of material wealth is just one distributional outcome – Lifetime Resources = Lifetime earnings + Bequests and gifts • Estimate lifetime earnings and add inheritance 54

Concluding ”Inheritance and wealth inequality” • Positive correlation between bequests and wealth of heirs – Richer heirs inherit more, absolute variation increases • But inheritances reduce wealth inequality – Confirms results in survey data – Results robust to tests for undervalued wealth, gifts, expectations • Limitations/Need for more analysis: – – Cannot perfectly account for pre-inheritance responses …or the impact of all inter vivos gifts Distinguish between lifecycle and inherited wealth of donees? Normative inheritance tax analysis? 55

• Extra slides 56

Wealth regressions: IHS 57

Wealth regressions: log Wealth 58
 59")
Mobility effects Evolution of Shorrocks-Prais index (trace in tr. matrices) 59

Descriptives of heirs Cohort: 2002 2003 2004 2005 Age at inheritance Child of the decedent (%) Woman (%) Married (%) Upper secondary or post-graduate degree (%) 54. 5 56. 7 50. 7 53. 8 24. 6 57. 1 50. 5 53. 2 25. 4 54. 9 55. 6 50. 7 52. 7 25. 7 55. 1 59. 4 50. 6 52. 3 26. 2 220, 041 638, 967 82, 520 73, 025 32. 9 1. 9 2, 683 224, 993 590, 612 83, 430 73, 737 33. 0 1. 9 2, 796 227, 687 625, 364 88, 791 78, 131 34. 2 2. 0 2, 866 234, 903 691, 191 n. a. Gross inheritance (SEK) Net inheritance (SEK) Paying inheritance tax (%) Have received taxable gifts (%) Taxable gifts (SEK) 60

61

Inheritance effects on wealth inequality Outcome: Gini P 90/P 50 P 99/P 50 Top 1% Top 10% – 0. 035*** – 0. 601*** – 1. 876** – 0. 023** – 0. 029*** Bot. 50% 0. 018*** CV – 4. 320 P 75 -P 25 P 99 -P 1 64, 998*** 259, 586* (0. 008) (0. 163) (0. 831) (0. 010) (0. 004) (0. 005) (3. 007) (15, 484) (128, 255) Mean of y 0. 802 6. 609 20. 618 0. 189 0. 556 – 0. 015 6. 79 765, 926 5, 545, 335 Effect in % – 4. 36 – 9. 10 – 12. 70 – 5. 21 – – 63. 62 8. 49 4. 68 The direct mechanical effect on Gini: 6 percent reduction 62

Development of the Gini coefficient 2002 cohort inherits 2003 cohort inherits 2004 cohort inherits 63

Why do inheritances reduce wealth inequality? ‒ Relatively more important for the less wealthy! Figure: Inheritance by wealth deciles Relatively more important in the bottom Absolutely more important in the top 64
: – Ineq. effect")
Sensitivity analysis • Different inequality measures (CV, Top shares, Percentile ratios): – Ineq. effect decreases, but dispersion increases • Adjusting for (potential) undervaluation of assets (e. g. , tax -assessed values of housing, consumer durables) • Restricting analysis to children-heirs • Adding estimated (unobserved) gifts: Larger effect • Expectations on pre-inheritance wealth accumulation 65

What was the role of the Swedish inheritance tax? • Progressive tax: 0, 10, 20, and 30%. – But, the average, effective tax rate was rarely above 20 percent • Finding: The tax may actually have contributed to increased wealth inequality among heirs! Caveats: 1. A more progressive tax may yield a different result 2. Does not account for redistribution of inheritance tax revenues 3. Does not account for popular sentiments towards equalization 66

How can a progressive inheritance tax increase wealth inequality? Figure: Inheritance tax payments by wealth decile 67

Role of inheritance taxation • Sweden's inheritance tax quite modest in the 2000 s – Top marginal tax rate at 30 percent – Very large discounts on inherited business equity (family firms) Distribution of inheritances gross and net of inheritance tax Mean Gross inheritance Net inheritance P 99 P 90 P 50 P 25 P 1 Gini 82, 872 889, 826 212, 927 14, 873 0 0 0. 789 73, 558 750, 107 195, 628 14, 864 0 0 0. 774 68
- Slides: 68