We will begin shortly In the meanwhile please

We will begin shortly. In the meanwhile please: 1. Mute your microphones. 2. Open the chat room. If you have any questions post those in the chatroom.

Class course collaboration Help each other learn https: //mgto. org/psyc 30522020 coursesummary Slack https: //hku 2020 psyc 3052. slack. com Why do this? 1. Group coordination > single writeups. 2. I will read it, correct problems, and add content. 3. Ask me questions on materials with comments. 4. I give bonuses at end of the semester to top contributors. 2

RRR Assessment Task: Peer review Help each other improve! PSYC 3052 A: https: //airtable. com/shrh. TY 8 ZDODwh. Efce PSYC 3052 B: https: //airtable. com/shr. Acus. NXc. S 6 sw. Acr PSYC 2071: https: //airtable. com/shrex 6 Mhl 2 Jb. Iuw 8 E 3
 http: //giladfeldman. org gfeldman@hku. hk Twitter: @giladfeldman")
Objectivity/Factfulness Reasons for optimism Fili (Gilad Feldman) http: //giladfeldman. org gfeldman@hku. hk Twitter: @giladfeldman Mailing list: https: //mgto. org/giladmailinglist

We'll start with. . . General knowledge quiz! Mentimeter

6 https: //www. gapminder. org/factfulness-book/

https: //www. gapminder. org/ignorance-test/ https: //www. gapminder. org/answers/ Correct answers: 1: C, 2: B, 3: C, 4: C, 5: C, 6: B, 7: C, 8: A, 9: C, 10: A, 11: C, 12: C, 13: A The questions come from Gapminder Test 2017, that 12 000 people in 14 countries took. If you want to learn more about the test, read about it here.

How is the world doing? Video

Let's see for ourselves Income & Life Expectancy

Slides credit • David Alcock – Geography Teacher, Bradford Grammar School • Hans Rosling • Gapminder www. gapminder. org 10

Life expectancy average … is the lifespan a newborn can expect … is short when child deaths are common
 100 Sweden 81 years 80 60 50 years Burundi 40 1")
Life expectancy (years) 100 Sweden 81 years 80 60 50 years Burundi 40 1 Population (millions) 100 20 1000 0 200 $ 20 000 $ Income person (comparable dollars per year)
 100 80 60 Burundi 50 years Burundi 40 1 Population (millions)")
Life expectancy (years) 100 80 60 Burundi 50 years Burundi 40 1 Population (millions) 100 20 C a n y o u 1000 g e t 0 o 200 l d i n 2000 B u r u n 20 d 000 i ? $ $ $ Income person (comparable dollars per year)
 Life expectancy 100 80 60 Burundi 2007 50 years 40 20 2007")
Age (years) Life expectancy 100 80 60 Burundi 2007 50 years 40 20 2007 Burundi 1 Population (millions) 1000 0 200 $ 20 000 $ Income person (comparable dollars per year)
 Life expectancy 100 Burundi Look at the expected 2007 life of five")
Age (years) Life expectancy 100 Burundi Look at the expected 2007 life of five newborn 80 60 50 years 40 20 2007 Burundians… Burundi 1 Population (millions) 1000 0 200 $ 20 000 $ Income person (comparable dollars per year)
 80 Burundi 2007 How long will 60 they live… 40 …if")
100 Age (years) 80 Burundi 2007 How long will 60 they live… 40 …if conditions remain as in Burundi in 2007 during their whole lifetime? 20 0 Pierre Liz Jean Ann Sarah
 80 Burundi 2007 72 84 57 60 36 40 20 0")
100 Age (years) 80 Burundi 2007 72 84 57 60 36 40 20 0 1 Pierre Liz Jean Ann Sarah
 80 2007 adult 60 40 old Burundi child So yes, 2")
100 Age (years) 80 2007 adult 60 40 old Burundi child So yes, 2 of 5 get old in Burundi 1 Pierre 57 36 20 0 72 84 Liz Jean Ann Sarah
 Burundi Calculate the mean… This is the Life 2007 80 1+36+57+72+84")
100 Age (years) Burundi Calculate the mean… This is the Life 2007 80 1+36+57+72+84 Expectancy = 50 5 57 60 50 years 72 84 36 40 20 0 1 Pierre Liz Jean Ann Sarah
 100 Burundi 81 years 80 2007 31 years 60 50 years")
Life expectancy (years) 100 Burundi 81 years 80 2007 31 years 60 50 years 72 57 Burundi 36 40 1 Population (millions) 100 20 0 Sweden 84 1 200 $ 1000 2000 $ 20 000 $ Income person (comparable dollars per year)
 100 Sweden 81 years 80 60 40 20 1 Population (millions)")
Life expectancy (years) 100 Sweden 81 years 80 60 40 20 1 Population (millions) 1000 Do all Swedes $ 1 l i v e 200 3 y e 2000 a r$ s l o 20 n 000 g$e r person t h a n. Income t h eper B u r u(comparable n d idollars a nper syear)? 0
 Life expectancy 100 Sweden 81 years 80 60 40 Sweden 2007 Look")
Age (years) Life expectancy 100 Sweden 81 years 80 60 40 Sweden 2007 Look at the expected Population life of five newborn (millions) 100 20 Swedes… 1000 0 200 $ 2000 $ 1 20 000 $ Income person (comparable dollars per year)
 80 Sweden 2007 How long will they live… 60 …if conditions")
100 Age (years) 80 Sweden 2007 How long will they live… 60 …if conditions remain as in Sweden in 2007 during their whole lifetime? 40 20 0 Per Lisa Jan Anton Sara
 80 60 Sweden 2007 63 77 40 88 84 93 4")
100 Age (years) 80 60 Sweden 2007 63 77 40 88 84 93 4 old 20 1 adult 0 Per Lisa Jan Anton Sara
 81 years 80 60 Sweden 2007 63 40 77 84 88")
100 Age (years) 81 years 80 60 Sweden 2007 63 40 77 84 88 93 Calculate the mean… 63+77+84+88+93 =81 5 20 0 Per Lisa Jan Anton Sara
 100 Sweden 81 years 80 Sweden 2007 60 40 1 Population")
Life expectancy (years) 100 Sweden 81 years 80 Sweden 2007 60 40 1 Population (millions) 100 20 1000 0 200 $ 20 000 $ Income person (comparable dollars per year)

Let’s compare Sweden Burundi
 100 Sweden 81 years 80 60 50 years Burundi 40 1")
Life expectancy (years) 100 Sweden 81 years 80 60 50 years Burundi 40 1 Population (millions) 100 20 1000 0 200 $ 20 000 $ Income person (comparable dollars per year)
 80 60 50 40 20 0")
100 2007 81 Age (years) 80 60 50 40 20 0

100 “To live long” in Sweden 2007 is almost the same as 80 Age (years) “to live long” in Burundi 60 40 20 0 But “dying young” Sweden So, in no, very different allis. Burundians do not live 31 from “dying young” in Burundi years shorter than Swedes

Life expectancy … is an average -Most Burundians get older than 50 -Some die in childhood … is low when childdeaths are common -It is low in Burundi not because all die a bit earlier -But because some die much younger

32

33 https: //www. gapminder. org/ignorance-test/results/question-3/

Share of the world population living in absolute poverty Share of the world living in absolute poverty Rosling: “Bad and better” 1820 2015
 across time in different countries")
Let's see for ourselves Income person (GDP/capita) across time in different countries

36 https: //www. gapminder. org/ignorance-test/results/question-4/

37 https: //www. gapminder. org/ignorance-test/results/question-8/

38 https: //www. gapminder. org/ignorance-test/results/question-10/

What is the problem? Ignorance, and media Example: Vaccinations

• https: //ourworldindata. org/wp-content/uploads/2017/01/Two-centuries-World-as-100 -

Since 1950, the world has become more… Peaceful Democratic Healthy Well nourished Educated Connected Gender equal Tolerant

Since 1950. . . 0
 • How many nuclear weapons have")
Zero, since 1950. . . (2017 "simplified" version) • How many nuclear weapons have been used in conflict? Zero. • How many western European countries have fought each other? Zero. • How many major developed countries have fought each other? Zero. • How many developed countries have expanded their territories by conquering another country? Zero. • How many states have disappeared through conquest? Zero. 43
. . . 44")
And in figures (only some of the story). . . 44

Reasons for misperceptions & ignorance on global progress • Misperception and ignorance Heuristics (psychological biases) Peers Parents Mass media Politics: progressophobia and ritualised denunciation of government • Demographics • Education • • •

A manifesto for how to deal with misperceptions about ‘progress’ Inspired by Bobby Duffy, Psychologist, Kings College London

1. Things are not as bad as we think – and most things are getting better • • Ignorance test Schemes of work on Factfulness / rules of thumb Infographics on walls Documentaries & TED talks from Gapminder website
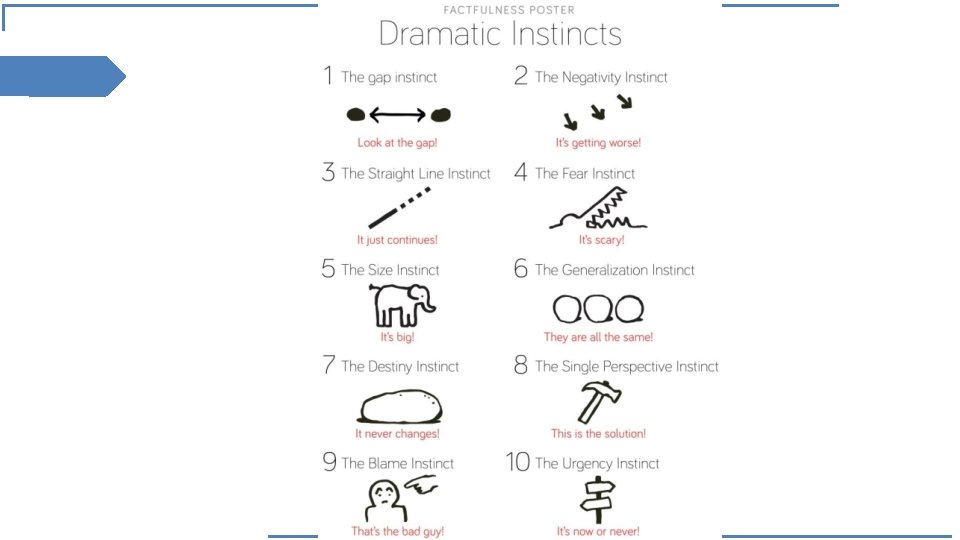

The Gap Instinct Talking about two separate groups paints polarization. Reality is often not polarized at all. Majority is in the middle, instead of gap. Address the gap instinct, understand the majority. • Don't compare averages. Check the distribution! There is probably no gap at all. • Don't compare extremes. Some at top, some at bottom, can be unfair. Majority is in between, rather than gap. • Top view. Looking down & generalizing distorts reality/views. 49 https: //www. gapminder. org/factfulnes

50

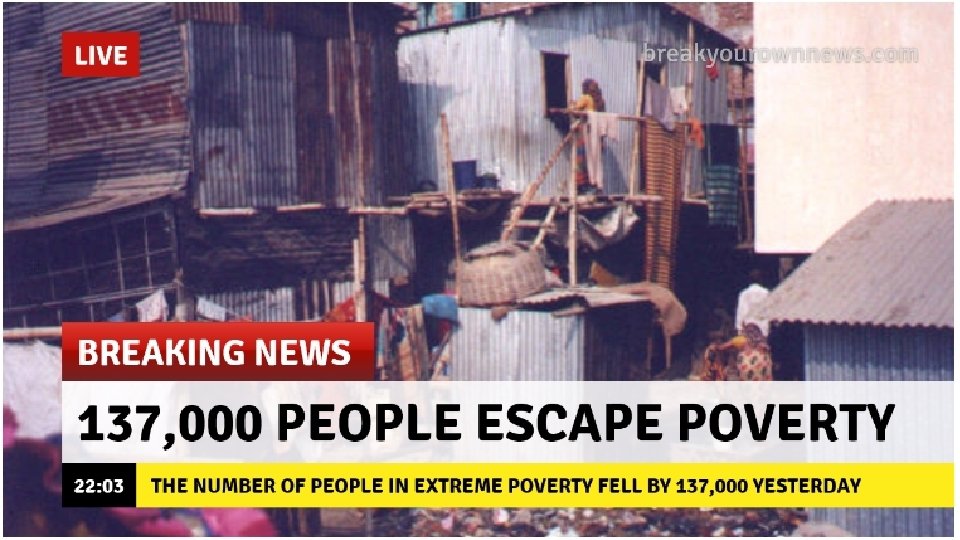
Negativity Instinct: Bad stronger than Good 51 We remember negative news. Positive news aren't contemplated or discussed. Systematically too-negative impression of world around us, which is very stressful. Control negativity instinct, expect bad news. • Getting better, still bad. Level (e. g. , bad) versus direction of change (e. g. , better). Things can be both get better and still be bad. • Good news is not considered news. Good news almost never reported. News almost always bad. • Gradual improvement is not news. Overlook the spikes and focus on trend. Gradually improving, with periodic dips. • Beware of nostalgic rosy pasts. Nations often https: //www. gapminder. org/factfulness/neg glorify their histories,

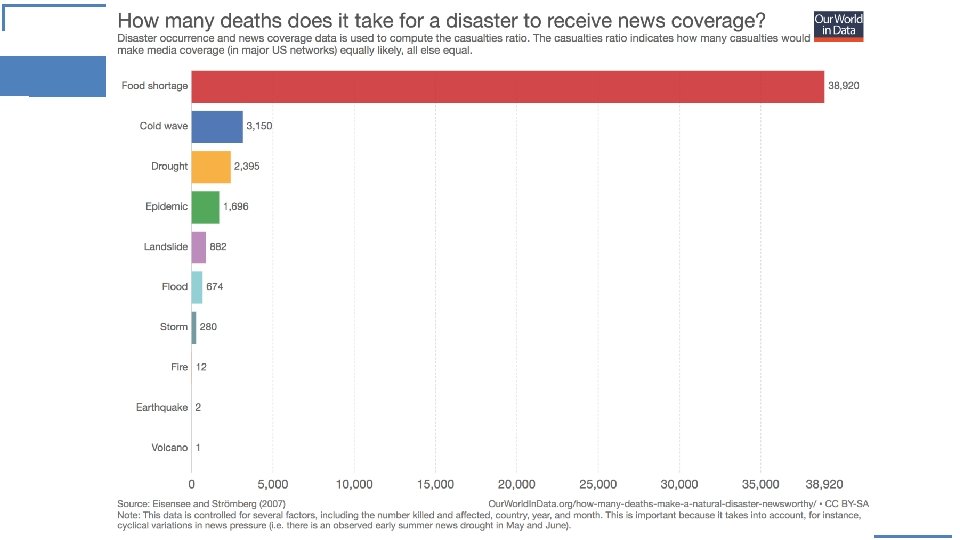
Media coverage 52

Bad is stronger than Good VIDEO http: //assets. csom. umn. edu/assets/7151

54 Generalization Instinct • Categories can be misleading. Avoid generalizing incorrectly. • Address generalization instinct, question your categories. • Differences within groups. Especially large groups, split into smaller precise categories. • Differences across groups. Do not generalize from one group to another. • Beware of “the majority. ” Majority just means more than half. Is 51 percent = 99 percent? • Beware of vivid examples. Easier to recall but often exception rather than rule. • People are not idiots. Be curious and humble, don't assume you know better. https: //www. gapminder. org/factfulness/genera

2. Cultivate scepticism, but not cynicism Question our information Encourage our students to do so Deep interrogation of images, graphs, texts – e. g. layers of inference Layers of inference framework – Source: Margaret Roberts / GA

3. See things from others’ points of view Decision-making and issues-based exercises https: //www. gapminder. org/dollar-street/matrix Dollar Street Diaries, video footage VIDEO

4. Consider our use of extreme examples Context is key Graphs Proportional symbols Visualising scale Embodying scale Use of ‘headline creators’

5. Refer to trends

My main message to you • Base yourself on facts and science • Beware of your biases, examples: – e. g. , availability heuristic > unrealistic optimism – losses > gains • The world is, overall, getting better, not worse. 61

62 The great realization VIDEO
 www. ourworldindata. org (Max Roser")
Further reading Factfulness by Hans Rosling et al (2018) www. ourworldindata. org (Max Roser et al) Enlightenment Now by Steven Pinker (2018) The Perils of Perception by Bobby Duffy (2018)
- Slides: 63