
We provide information www statistik at We provide


- Slides: 18
We provide information www. statistik. at
We provide information Data collection and modeling of Austria's wood energy use a never ending story Wolfgang Bittermann 24. 3. 2005 © STATISTIK AUSTRIA www. statistik. at S T A T I S T I K A U S T R I A
The share of forest based fuels in Austria‘s energy consumption 2003 8. 9% of Gross energy consumption and 9. 2% of final energy consumption are forest based 15, 2% of the overall heat for district heating and 42, 9% of heat for district heating from heat only plants and Only 0. 003% of the overall electricity (including hydropower with 59, 4%) but 9. 7% of CHP electricity are produced from wood fuels S T A T I S T I K A U S T R I A
Final energy consumption 2003 S T A T I S T I K A U S T R I A
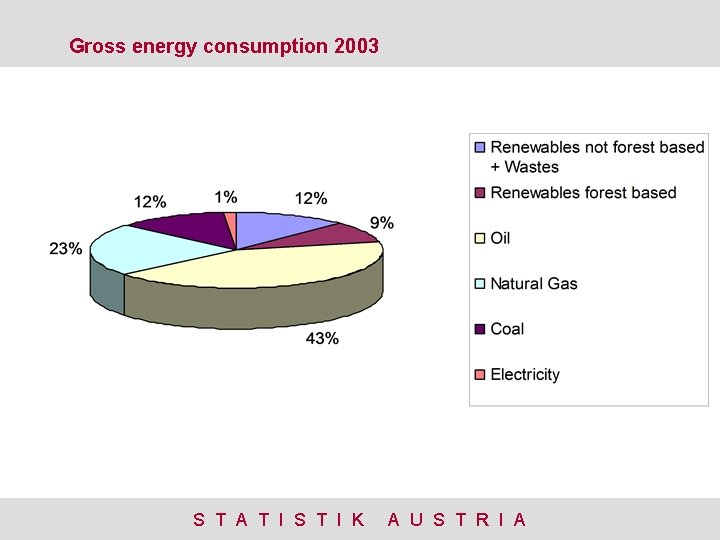
Gross energy consumption 2003 S T A T I S T I K A U S T R I A
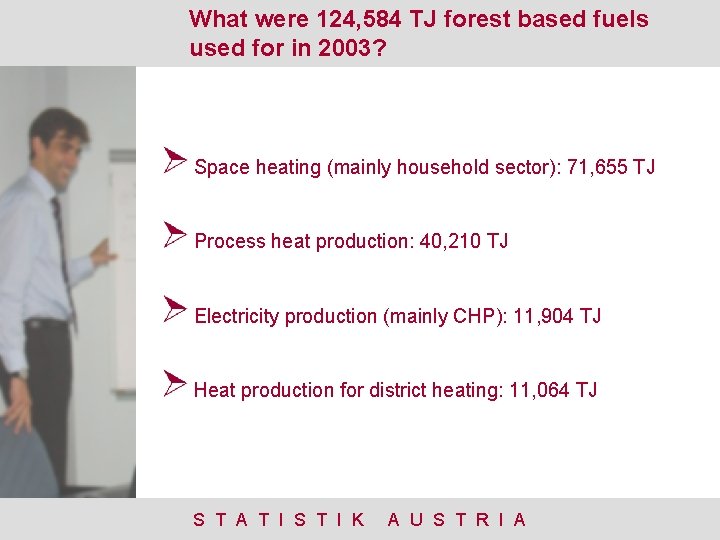
What were 124, 584 TJ forest based fuels used for in 2003? Space heating (mainly household sector): 71, 655 TJ Process heat production: 40, 210 TJ Electricity production (mainly CHP): 11, 904 TJ Heat production for district heating: 11, 064 TJ S T A T I S T I K A U S T R I A
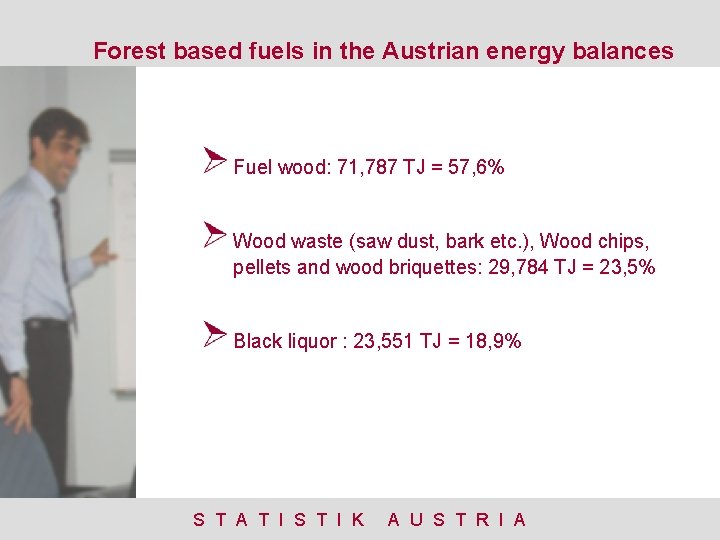
Forest based fuels in the Austrian energy balances Fuel wood: 71, 787 TJ = 57, 6% Wood waste (saw dust, bark etc. ), Wood chips, pellets and wood briquettes: 29, 784 TJ = 23, 5% Black liquor : 23, 551 TJ = 18, 9% S T A T I S T I K A U S T R I A
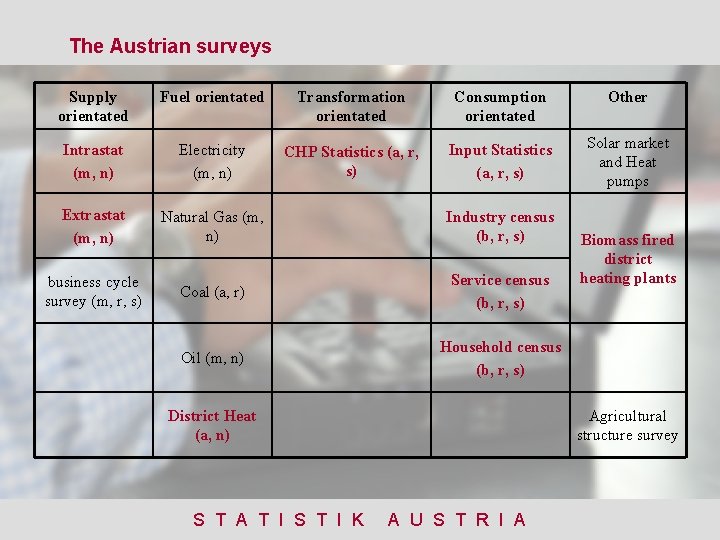
Where do the data come from? 6 surveys for consumption 2 surveys for supply 1 survey on installed plant capacity 3 model based calculations S T A T I S T I K A U S T R I A
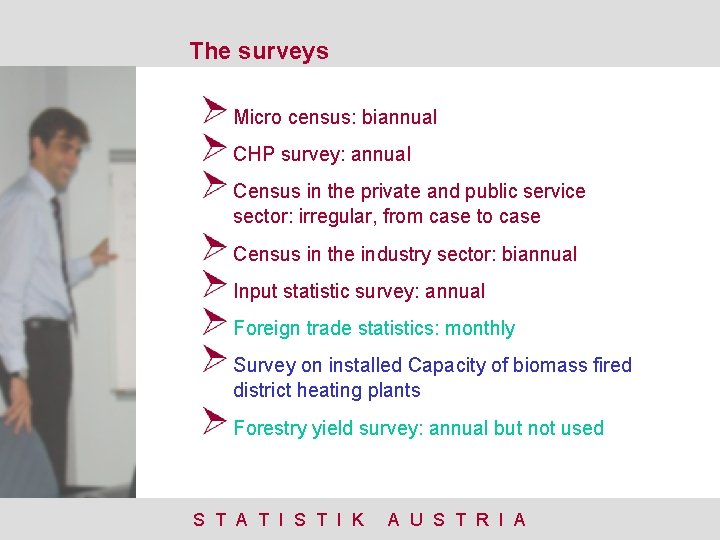
The surveys Micro census: biannual CHP survey: annual Census in the private and public service sector: irregular, from case to case Census in the industry sector: biannual Input statistic survey: annual Foreign trade statistics: monthly Survey on installed Capacity of biomass fired district heating plants Forestry yield survey: annual but not used S T A T I S T I K A U S T R I A
The Models Ø Extrapolation of forest fuel input for space heating for years after the last survey with heating degree days and after the next survey recalculation of the years between the two surveys with heating degree days and progressive averages. Ø Split of the CHP survey data into CHP transformation, electricity only transformation and final energy consumption by following the Eurostat CHP guidelines. Ø Calculation of fuel input into and heat output from biomass fired district heating plants. S T A T I S T I K A U S T R I A
Heat from biomass fired district heating plants 1 Ø Model assumptions 1. Fuel mix used in these plants is rather constant 2. The efficiency of the transformation remains rather constant too. 3. Heat production is correlated with installed capacity and temperature. Ø Model input 1. Annual survey of installed capacity 2. Continuous calculation of heating degree days. 3. Fuel input by fuel type into biomass fired district heating plants and corresponding heat production on plant level 1997. S T A T I S T I K A U S T R I A
Heat from biomass fired district heating plants 2 Ø Modeling steps 1. Calculation fuel input in TJ by installed MW and heating degree day for 1997. 2. Calculation of the typical fuel mix for 1997 3. Calculation of actual heat production with the formula: Heat(TJ)= Installed MW * Actual Degree Days *0, 7658 4. Calculation of actual fuel input by type with the 1997 fuel mix relations and efficiencies. S T A T I S T I K A U S T R I A
The main problems No specific survey exists for renewable fuels like they do for fossil fuels (oil, gas, coal) The production data as well as foreign trade data for wood fuels are fragmentarily, missing or are not differentiated into wood products for energy and non energy use. No stock information No exact information on non energy use of wood products e. g. for the manufacture of plywood, laminboard, particle board, fibre board and other boards and panels. S T A T I S T I K A U S T R I A
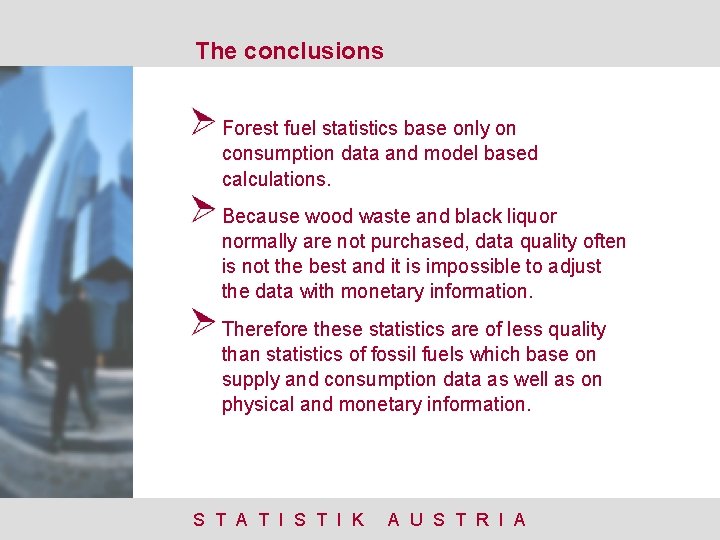
The conclusions Forest fuel statistics base only on consumption data and model based calculations. Because wood waste and black liquor normally are not purchased, data quality often is not the best and it is impossible to adjust the data with monetary information. Therefore these statistics are of less quality than statistics of fossil fuels which base on supply and consumption data as well as on physical and monetary information. S T A T I S T I K A U S T R I A
The conclusions But on the other hand the consistency of time series based on surveys tells us that these statistics give a good information on the development although the absolute amount cannot be verified in all cases. S T A T I S T I K A U S T R I A
The Austrian surveys Supply orientated Fuel orientated Transformation orientated Consumption orientated Other Intrastat (m, n) Electricity (m, n) CHP Statistics (a, r, s) Input Statistics (a, r, s) Solar market and Heat pumps Extrastat (m, n) Natural Gas (m, n) Industry census (b, r, s) business cycle survey (m, r, s) Coal (a, r) Service census (b, r, s) Oil (m, n) Household census (b, r, s) District Heat (a, n) S T A T I S T I K Biomass fired district heating plants Agricultural structure survey A U S T R I A
S T A T I S T I K A U S T R I A
Thank you for your attention www. statistik. at S T A T I S T I K A U S T R I A