We propose a method which can be used

We propose a method which can be used to reduce high dimensional data sets into simplicial complexes with far fewer points which can capture topological and geometric information at a specified resolution.

Building blocks for a simplicial complex 0 -simplex = vertex = v 1 -simplex = edge = {v 1, v 2} v 1 e v 2 Note that the boundary of this edge is v 2 + v 1 2 -simplex = triangle = {v 1, v 2, v 3} v 2 Note that the boundary of this triangle is the cycle e 1 e 2 e 1 + e 2 + e 3 v 1 v 3 e 3 = {v 1, v 2} + {v 2, v 3} + {v 1, v 3}

http: //www. math. wsu. edu/math/faculty/bkrishna/Abs. Alg. Topo_PSB 2016/Slides_Topology. pdf

Distance Matrix Eigenvector, Mean Centered Distance Matrix Order of eigenvector: 1 20 intervals, 80% Overlap

Create overlapping bins: http: //www. nature. com/srep/2013/130207/srep 01236/full/srep 01236. html

Create overlapping bins: http: //www. nature. com/srep/2013/130207/srep 01236/full/srep 01236. html

We propose a method which can be used to reduce high dimensional data sets into simplicial complexes with far fewer points which can capture topological and geometric information at a specified resolution. Resolution means ? ? Which choice refers to resolution?

The idea is to provide another tool for a generalized notion of coordinatization for high dimensional data sets. Coordinatization can of course refer to a choice of real valued coordinate functions on a data set,

Goal f: D S 1 which “preserves” the structure of the data. circle courtesy of knotplot. com

circle courtesy of knotplot. com

The idea is to provide another tool for a generalized notion of coordinatization for high dimensional data sets. Coordinatization can of course refer to a choice of real valued coordinate functions on a data set, The graph/simplicial complex created by Mapper can be thought of as a partial coordinization of the data set. BUT keep in mind that the output is an abstract graph/simplicial complex

The idea is to provide another tool for a generalized notion of coordinatization for high dimensional data sets. Coordinatization can of course refer to a choice of real valued coordinate functions on a data set, but other notions of geometric representation (e. g. , the Reeb graph [Ree 46]) are often useful and reflect interesting information more directly.

http: //www. nature. com/srep/2013/130207/srep 01236/full/srep 01236. html https: //en. wikipedia. org/wiki/Reeb_graph

Our construction is more general than the Reeb graph and can also represent higher dimensional objects, such as spheres, tori, etc. In the simplest case one can imagine reducing high dimensional data sets to a graph which has nodes corresponding to clusters in the data.

We begin by introducing a few general properties of Mapper. Our method is based on topological ideas, by which we roughly mean that it preserves a notion of nearness, but can distort large scale distances. This is often a desirable property, because while distance functions often encode a notion of similarity or nearness, the large scale distances often carry little meaning.

http: //images. gmanews. tv/webpics/2016/10/Untitled_2 016_10_05_15_45_40. png http: //2. bp. blogspot. com/SGw. Fw. Bj. Fn. Bs/Th. Bq. TV 1 TVUI/AAAAARw/F 1 ft. H B 0 te. JE/s 1600/coffee+cup+as+donut. png

http: //2. bp. blogspot. com/SGw. Fw. Bj. Fn. Bs/Th. Bq. TV 1 TVUI/AAAAARw/ F 1 ft. HB 0 te. JE/s 1600/coffee+cup+as+donut. png http: //images. gmanews. tv/webpics/2016/10/Untitled_2016_10_05_15_45_40. png https: //www. geekalerts. com/u/Donut-Mug. jpg torus = donut http: //www. prevogel. fr/156 -thickbox_default/donut-chocolat-surgel%C 3%A 9 -vandermoortele. jpg Not a donut (ie not a torus) = http: //www. yellowoctopus. com. au/media/catalog/product/y/e/yellow-octopus-donutmug. jpg https: //en. wikipedia. org/wiki/Euler_characteristic
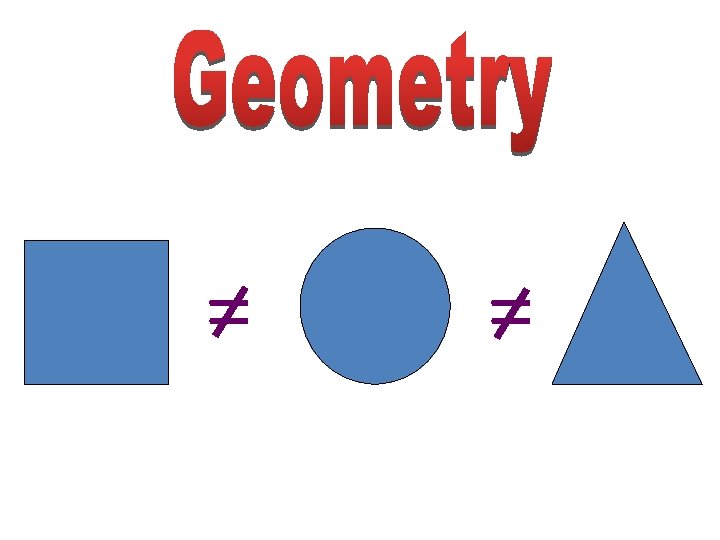
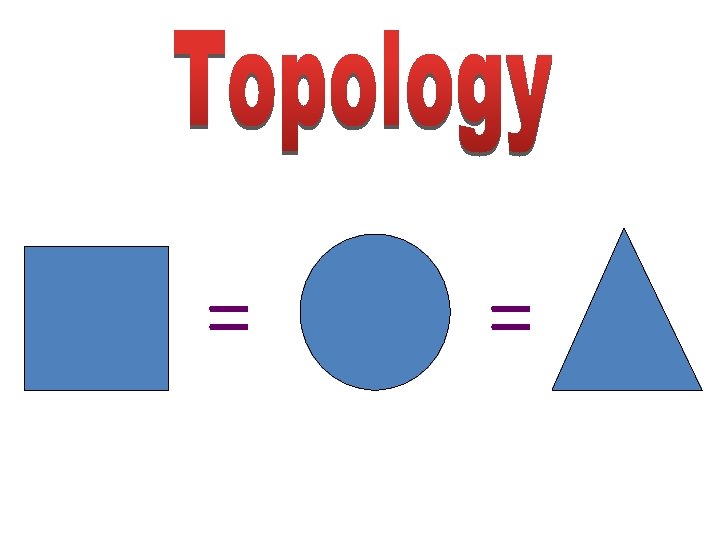
: Three key ideas of topology that make extracting of patterns")
Topological Data Analysis (TDA): Three key ideas of topology that make extracting of patterns via shape possible. 2. ) invariant under “small” deformations. • less sensitive to noise Figure from http: //comptop. stanford. edu/u/preprints/mapper. PBG. pdf http: //www. nature. com/srep/2013/130207/srep 01236/full/srep 01236. html Topological Methods for the Analysis of High Dimensional Data Sets and 3 D Object Recognition, Singh, Mémoli, Carlsson

Filter Function The method begins with a data set X and a real valued function f : X →R, to produce a graph. This function can be a function which reflects geometric properties of the data set, such as the result of a density estimator, or can be a user defined function, which reflects properties of the data being studied. In the first case, one is attempting to obtain information about the qualitative properties of the data set itself, and in the second case one is trying to understand how these properties interact with interesting functions on

Filter Function The method begins with a data set X and a real valued function f : X →R, to produce a graph. This function can be a function which reflects geometric properties of the data set, such as the result of a density estimator, or In the first case, one is attempting to obtain information about the qualitative properties of the data set itself, Are there Flares? Topology? Blobs? # of components?

Filter Function The method begins with aa data set XX and aa real valued The function ff : : XX →R, to to produce aa graph. function Or this function can be be aa user defined function, which Or reflects properties of of the data being studied. reflects in the second case one isis trying to to understand how these in properties interact with interesting functions on on the data properties set.

1. Introduction The purpose of this paper is to introduce a new method for the qualitative analysis, simplification and visualization of high dimensional data sets, as well as the qualitative analysis of functions on these data sets. Ex: 1. ) f(x) = ||x|| 2. ) g(x 1, …, xn-1) = xn 3. ) DSGA decomposition of the original tumor vector into the Normal component its linear models fit onto the Healthy State Model and the Disease component vector of residuals. http: //www. pnas. org/content/early/2011/04/07/1102826108

The functions determine the space to which we produce a map. The method can easily be modified to deal with maps to parameter spaces other than R, such as R 2 or the unit circle S 1 in the plane. In the first of these cases, one produces a two dimensional simplicial complex, together with a natural map from the data set to it. In the second case, one constructs a graph with a map from the graph to a circle.

Create overlapping bins: Oops!!! http: //www. nature. com/srep/2013/130207/srep 01236/full/srep 01236. html

Create overlapping bins: http: //www. nature. com/srep/2013/130207/srep 01236/full/srep 01236. html

The functions determine the space to which we produce a map. The method can easily be modified to deal with maps to parameter spaces other than R, such as R 2 or the unit circle S 1 in the plane. In the first of these cases, one produces a two dimensional simplicial complex, together with a natural map from the data set to it. In the second case, one constructs a graph with a map from the graph to a circle.

Distance Matrix Eigenvector, Mean Centered Distance Matrix Order of eigenvector: 1 20 intervals, 80% Overlap Oops!!!

The functions determine the space to which we produce a map. The method can easily be modified to deal with maps to parameter spaces other than R, such as R 2 or the unit circle S 1 in the plane. In the first of these cases, one produces a two dimensional simplicial complex, together with a natural map from the data set to it. In the second case, one constructs a graph with a map from the graph to a circle.

Filter function: eccentricity

In the case where the target parameter space is R, our construction amounts to a stochastic version of the Reeb graph (see [Ree 46]) associated with the filter function. If the covering of R is too coarse, we will be constructing an image of the Reeb graph of the function, while if it is fine enough we will recover the Reeb graph precisely. http: //www. nature. com/srep/2013/130207/srep 01236/full/srep 01236. html https: //en. wikipedia. org/wiki/Reeb_graph

The basic idea can be referred to as partial clustering, in that a key step is to apply standard clustering algorithms to subsets of the original data set, and then to understand the interaction of the partial clusters formed in this way with each other. That is, if U and V are subsets of the data set, and U ∩V is non-empty, then the clusters obtained from U and V respectively may have non-empty intersections, and these intersections are used in building a simplicial complex.

This construction produces a “multiresolution" or “multiscale“ image of the data set. One can actually construct a family of simplicial complexes (graphs in the case of a one-dimensional parameter space), which are viewed as images at varying levels of coarseness, and maps between them moving from a complex at one resolution to one of coarser resolution.

knn distance with k = 5, 50% overlap 3 intervals 5 intervals 100 intervals

knn distance with k = 50, 50% overlap 3 intervals 10 intervals 5 intervals 100 intervals

This fact allows one to assess the extent to which features are “real" as opposed to “artifacts", since features which persist over a range of values of the coarseness would be viewed as being less likely to be artifacts.

We do not attempt to obtain a fully accurate representation of a data set, but rather a low dimensional image which is easy to understand, and which can point to areas of interest. Note that it is implicit in the method that one fixes a parameter space, and its dimension will be an upper bound on the dimension of the simplicial complex one studies. As such, it is in a certain way analogous to the idea of a Postnikov tower or the coskeletal filtration in algebraic topology [Hat 02].
- Slides: 38