Watershed Management Plan Stakeholder Prioritization of Basins Introduction

Watershed Management Plan Stakeholder Prioritization of Basins

Introduction Plan for Water Resources by drainage area Ø 2006 GMP Amendments specify Plans by 2010 Ø They allow for a prioritization by 2008 Ø l l l Based on Growth Potential; Growth Impacts to Wetlands and; Growth Impacts to Listed Species Habitat.

Public Input to Plan Development Ø Stakeholder Groups l l l Public Noticed Meetings Technical Agency County Operating Departments Environmental Advisory Council – Will provide recommendations to the BCC October 3, 2007 Discuss Basin Priorities November 7, 2007 Recommend Basin Priorities

GIS Analysis Ø By Watershed Ø Method of scoring has minor impact to rank Ø Normalized factor scores to range of 0 - 1 Ø No weighting to factors Ø Resolve Boundary issues prior to modeling
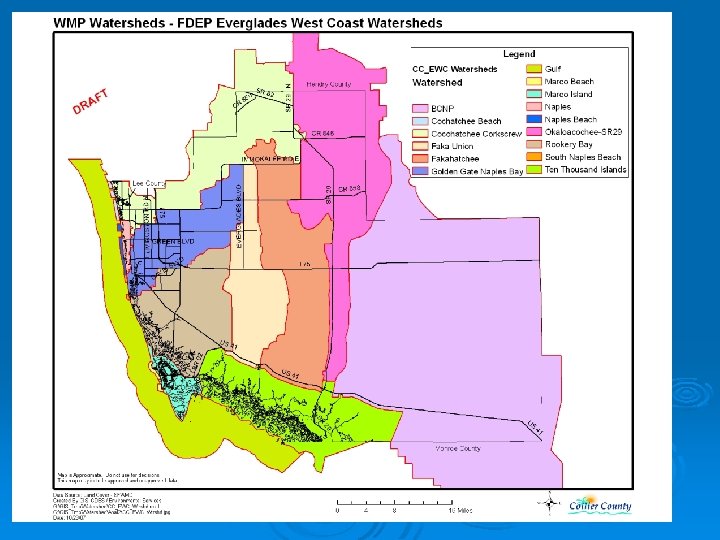

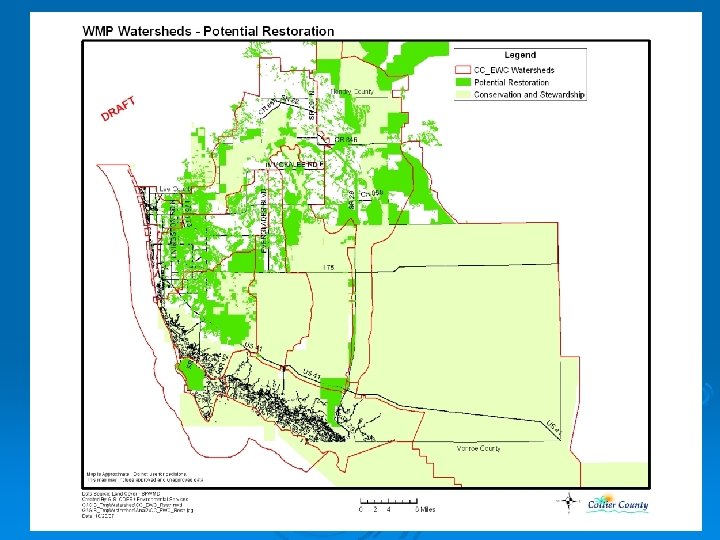
Growth Potential Ø Combined several factors Ø Removed Flowway Stewardship parcels Ø Undeveloped parcels Ø Potential density from FLU Ø SFWMD LUC for entire basin Ø SFWMD Native Habitat Ø Normalized the data
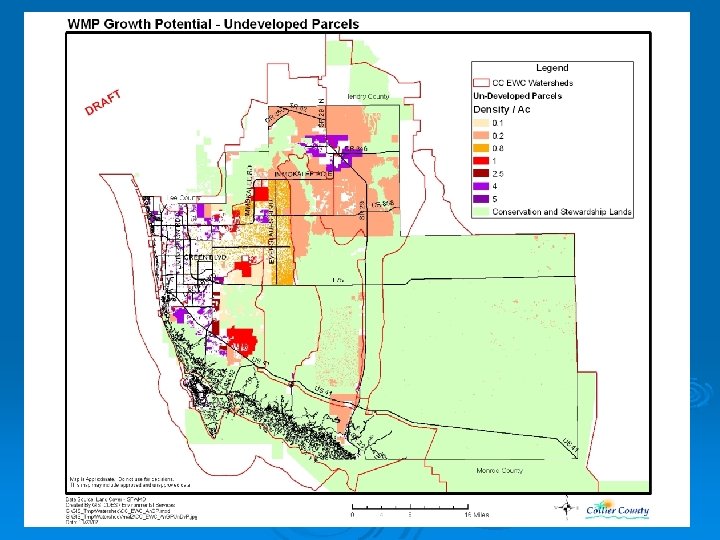


WMP Watershed Anaysis of Growth Potential Collier County Entire Basin Growth Potential Normalized Parcel Norm Dev LUC Norm Nat Hab Norm Total % Cnty Scr Units Scr % Score Scr Rank WATERSHED Acres Cocohatchee Corkscrew 145927 98634 0. 39 0. 77 43648. 7 0. 99 0. 63 0. 99 0. 26 0. 74 3. 49 1 Okaloacochee-SR 29 230822 153484 0. 51 1. 01 37162. 1 0. 84 0. 56 0. 89 0. 23 0. 66 3. 41 2 Rookery Bay 107675 99684 0. 33 0. 65 44194. 1 1. 00 0. 39 0. 62 0. 29 0. 82 3. 09 3 Golden Gate Naples Bay 87533 86442 0. 29 0. 57 35365. 1 0. 80 0. 46 0. 73 0. 35 0. 99 3. 09 4 Faka Union 86939 86937 0. 22 0. 43 12700. 6 0. 29 0. 31 0. 49 0. 24 0. 70 1. 90 5 150177 0. 29 0. 56 8724. 9 0. 20 0. 29 0. 46 0. 16 0. 45 1. 67 6 422 24 0. 25 0. 49 24. 2 0. 00 0. 01 0. 02 0. 00 0. 51 7 5001 4372 0. 01 0. 02 139. 2 0. 00 0. 09 0. 14 0. 09 0. 25 0. 41 8 134278 91651 0. 07 0. 13 2048. 0 0. 05 0. 08 0. 05 0. 13 0. 39 9 19534 10454 0. 08 0. 15 2554. 7 0. 06 0. 01 0. 02 0. 01 0. 04 0. 27 10 BCNP 705549 513717 0. 00 0. 01 436. 5 0. 01 0. 05 0. 07 0. 02 0. 06 0. 15 11 Gulf 142634 517 0. 07 0. 14 35. 7 0. 00 0. 14 12 Marco Beach 1201 107 0. 01 0. 02 4. 7 0. 00 0. 01 0. 02 0. 01 0. 03 0. 07 13 Cocohatchee Beach 1462 23 0. 01 0. 02 0. 8 0. 00 0. 02 14 Naples Beach 1527 1 0. 00 0. 00 15 Fakahatchee South Naples Beach Naples Ten Thousand Islands Marco Island Acres FLU

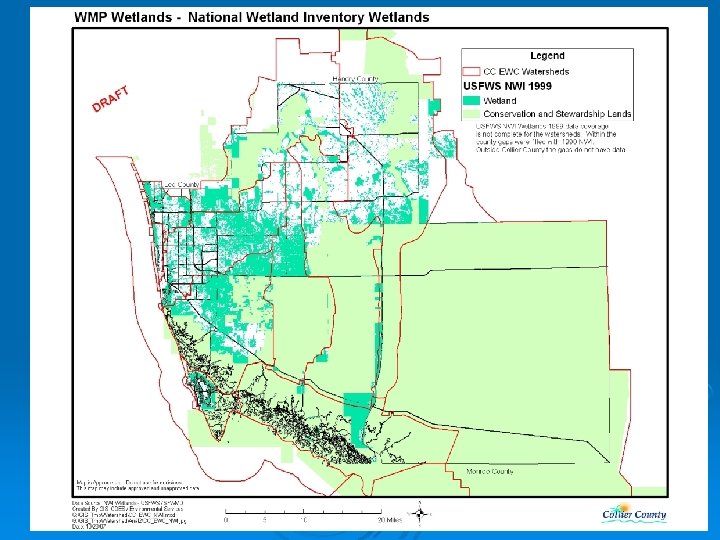
Wetlands with out Conservation Ø USFWS NWI was used to identify wetlands Ø Wetlands within Conservation were not counted Ø Lake Trafford Ranked 1 st with 100%

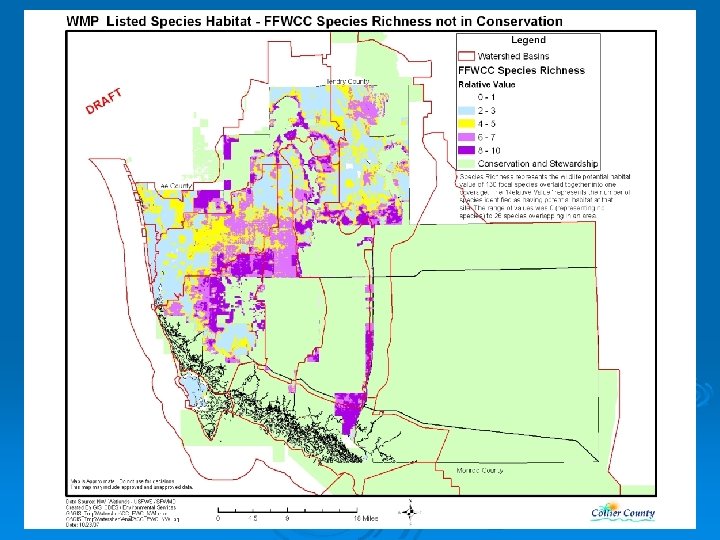
Listed Species Habitat with out Conservation Ø The 2000 FFWCC Species Richness was utilized to score habitat Ø Developed to value habitat to 130 focal species Ø Land cover is ranked from 0 – 10 based on the number of species it is expected to support

Summary Table of GIS Analysis with rankings WMP Watershed Prioritization Rankings WATERSHED Golden Gate Naples Bay Acres Wetland FFWCC WQ Restoration County Grwth. Pot NWI SP Rch Impard Acres Rank Rank Avg Overall Rank 87, 533 86, 442 4 1 1 3 1 2. 0 1 Rookery Bay 107, 675 99, 684 3 2 2 4 2 2. 6 2 Cocohatchee Corkscrew 145, 927 98, 634 1 6 3. 4 3 Okaloacochee-SR 29 230, 822 153, 484 2 8 5 7 5 5. 4 4 86, 939 86, 937 5 5 7 6 8 6. 2 5 Fakahatchee 150, 177 6 7 8 5 7 6. 6 6 Marco Island 19, 534 10, 454 10 4 9 8 4 7. 0 7 5, 001 4, 372 8 3 4 11 11 7. 4 8 134, 278 91, 651 9 9 10 10 9 9. 4 9 1, 201 107 13 11 6 14 3 9. 4 10 BCNP 705, 549 513, 717 11 13 15 2 10 10. 2 11 Gulf 142, 634 517 12 14 11 9 13 11. 8 12 422 24 7 10 13 15 15 12. 0 13 Cochatchee Beach 1, 462 23 14 15 12 13. 2 14 Naples Beach 1, 527 1 15 12 14 13. 4 15 Faka Union Naples Ten Thousand Islands Marco Beach South Naples Beach
- Slides: 15