Waterborne transport ports and waterways A review of

Waterborne transport, ports and waterways: A review of climate change drivers, impacts responses and mitigation (update of TG 3 2008) Smart Rivers 2017 conference Pittsburgh 18 -21 September 2017 Ron Cox PIANC Australia, PIANC PTGCC, PIANC Co. Com

Concerns, issues, practical adaptation Gold Coast, Australia – coastal settlement and infrastructure highly vulnerable to climate change
 • Common platform for")
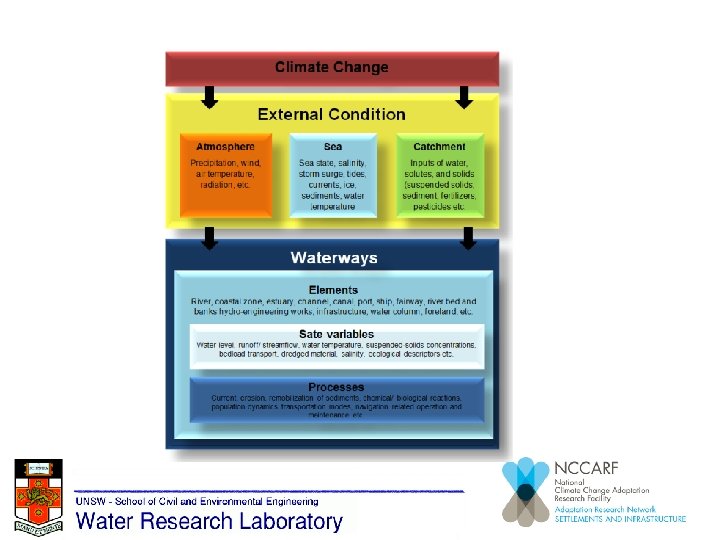
PIANC Task Group 3 Climate change and navigation Report (2008) • Common platform for all PIANC activities • Climate science based on IPCC AR 4 (2007) • Climate drivers : - Sea level rise, tides and surge; wind and wave action; ocean circulation and coastal hydrodynamics; ocean, coastal, estuarine and river morphology; intense storm events; water resources and quality in inland rivers; sea chemistry, environmentally protected areas; ice conditions and icing. • Reviewed climate change impacts on maritime and inland navigation infrastructure and operations • Potential adaptation and mitigation responses identified. • Navigation contributions to greenhouse gas (GHG) emissions discussed, along with opportunities for navigation to contribute both to overall decreases in anthropogenic GHG, and, through use of alternative fuels, to decreases in other pollutants.
 • • GCCMs getting better")
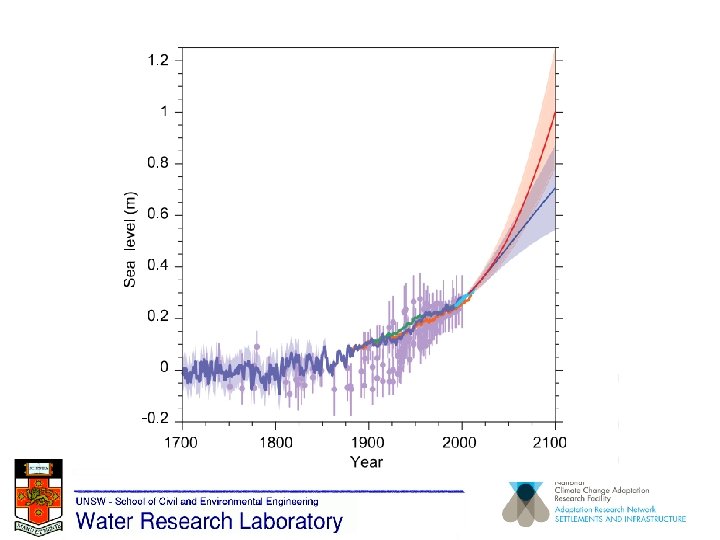
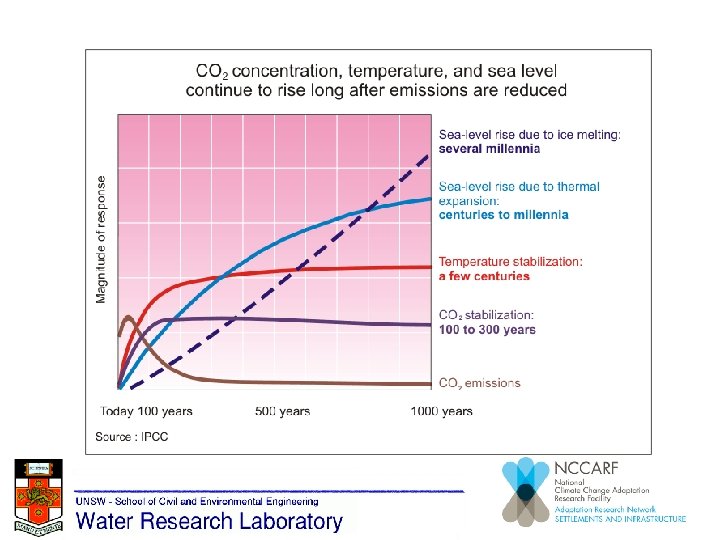
Update of Climate science with IPCC AR 5 (2014) • • GCCMs getting better with reduced uncertainty Higher resolution with spatial and temporal variability Changes from AR 4 are however not great Projections for 2100 suggest a global mean sea level rise of 0. 4 to 0. 8 m and a greater frequency and intensity of extreme weather events. • Even if emissions of greenhouse gases stop today, these changes would continue for many decades and in the case of the sea level for centuries. • Exaggeration of change – counterproductive • “Uncertainty” diminishes public acceptance
 Confidence terminology Degree of confidence in")
Standard terms - levels of confidence (IPCC, 2014) Confidence terminology Degree of confidence in being correct Very high confidence At least 9 out of 10 chance High confidence About 8 out of 10 chance Medium confidence About 5 out of 10 chance Low confidence (only used for areas of About 2 out of 10 chance major concern and where a risk-based perspective is justified) Very low confidence (only used for areas Less than 1 out of 10 chance of major concern and where a risk-based perspective is justified)

Standard terms used to define the likelihood of an outcome or result where this can be estimated probabilistically (IPCC, 2014) Likelihood terminology Virtually certain Extremely likely Very likely Likely More likely than not About as likely as not Unlikely Very unlikely Extremely unlikely Exceptionally unlikely Likelihood of the occurrence/ outcome > 99% probability > 95% probability > 90% probability > 66% probability > 50% probability 33 to 66% probability < 33% probability < 10% probability < 5% probability < 1% probability

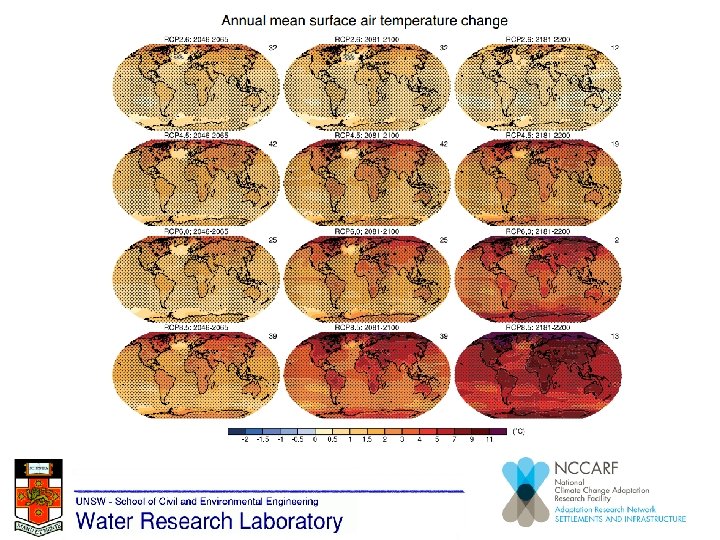
Increasing temperatures

Rising sea levels

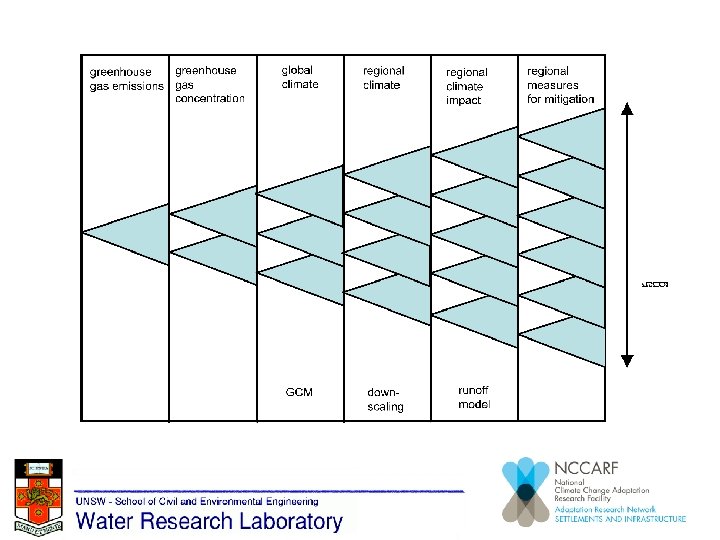
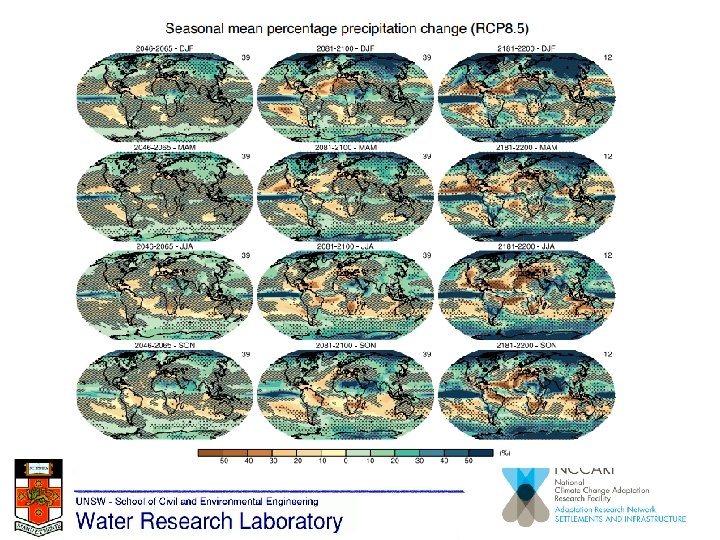
IPPC 2014 AR 5 - Representative Concentration Pathways (RCPs • AR 5 presents Representative Concentration Pathways (RCP’s) in place of the Special Report on Emissions Scenarios (SRES) projections published in earlier IPCC reports • The RCPs represent emissions target levels for 2100 and comprise of four scenarios which include; a mitigation scenario leading to a low forcing level (RCP 2. 6), two medium stabilisation scenarios (RCP 4. 5/RCP 6) and one high baseline emission scenario (RCP 8. 5). • The RCPs are represented as alternative emissions of global greenhouse gas and aerosol concentrations and are named after a possible range of radiative forcing values in the year 2100 relative to pre-industrial values • RCP 8. 5 represents a radiative forcing of 8. 5 Watts/m 2 and is often referred to as “business as usual”
 and temporal (seasonal) changes")
Uncertainty increases with complexity Spatial (regional) and temporal (seasonal) changes
 to (2070 -2100 b annual, c JFM, d")
Changing wave heights (1979 -2009 a) to (2070 -2100 b annual, c JFM, d JAS)

Changing wave direction >> shoreline alignments

Drivers and impacts on maritime navigation -examples Drivers Potential impact Increase in power and reach of storm surge, coastal flooding, spray zone and erosion patterns Change in magnitude and duration of storm surges and incidents of water over sea wall structures Wave attack at a higher water level reducing the energy loss of breaking Degradation, failure and replacement Changed dredging requirements x x x Low land flooding x x Increased vulnerability of structures x x Changes in frequency, duration and intensity of storms Permanent loss of sand offshore and onshore x x Degradation of structures x x Loss of viable industrial land (port enlargements) Retreat of coastal landscapes Problems in manoeuvring x x Reduced regularity of the port x x Reduced capacity of natural systems to recover Degradation of materials over time Exposure of decks of wharfs and jetties (corrosion) x x Change in the sea level range (and other sea state parameters) Port Coast Vessel
 identified the top 20 port cities with exposed assets under")
Hanson et al. (2011) identified the top 20 port cities with exposed assets under future climate (2070) and socioeconomic change scenarios

Responses of navigation to possible future climate change - examples Area of intervention Maritime infrastructure design Response (measures) Redevelopment of wharf fendering (to barrier ships at dock) Increase of quay levels, sea wall structures and connected area behind to overcome increased frequency of overtopping and low land flooding Lowest point in buildings placed at a higher level Revision of ship tunnel dimensions Relocation or strengthening of less protected marinas for pleasure boats Stronger and higher salt water erosion resistant bridges needed Overtopping and stability of breakwaters: crest height and armour unit block size increased; possible reorientation Restrictions on existing port developments, and limitations on location of new ports In the absence of site‑specific guidance, a sensible allowance for sea level rise is 5 mm/yr to 2100 A sensible response to possible future wave condition change is to check that design and operability are not seriously affected by a blanket 10 % increase in offshore wave heights (plus 5% increase in wave periods to maintain the same wave steepness): Defra (2006)

Range of responses of navigation to possible future climate change - examples Vessel operation More submerged reefs that need to be marked for avoidance Relocation of navigation fairways to less exposed areas; increased need for protected transportation channels Increased waiting time requiring larger areas for anchoring of vessels (vacant area is often very limited) Vessel design Use of different fuel or less fuel; reduced emissions Higher waves may require stronger ship design Ecological Relocation of fish farming plants to less exposed areas Changed designation of environmentally protected areas

Vessels Extreme conditions: more extreme floods Operational control Water supply: increased precipitation Locks, dams, infrastructure Drivers Lakes, rivers, channels Drivers and impacts to inland navigation - examples Increased water level and velocity Changes in sedimentation processes (bank failure, local scour, locations of aggradation and degradation) x x x x Manoeuvrability Increased loads on structures Decreased development land area available Reduced regularity of the port Reduced capacity of natural systems to recover x x x x x x Impacts Water supply: Decreased water level and velocity Reduced regularity of the port decreased precipitation

Responses of inland navigation to climate change impacts - examples Area of intervention Waterway design and maintenance Waterway operation Response (measures) Creation of water storage facilities Deepening of channels instead of widening Managing water flow Additional information (Upstream) reservoirs needed for flood mitigation could also be used to improve navigation Store water in times of high water flow, release water in times of low flow Improving forecast of water level Better early information to optimise vessel capacity and reduce uncertainty Improved queuing procedures Decision support systems and automation of queuing Implementation of River Information Services (RIS) RIS in general support safe and efficient navigation

Mitigation – historical growth in CO 2 across transport sector

Dealing with uncertainty ! r. cox@unsw. edu. au

Case study - Climate projections impacting port and key infrastructure – Cook Islands • • Rising sea levels Increasing temperatures – more extreme heat stress days Rainfall - regional and seasonal changes Rainfall - longer dry BUT higher intensity in storms Storm intensity increase - more extreme winds and waves Cyclones – little change in frequency but more intense El Nino- La Nina cycle affects rainfall and cyclones
 Upgrade – dredging, wharfs and buildings for SLR High")
Avatiu Port, 2013 (Photo: CIPA) Upgrade – dredging, wharfs and buildings for SLR High relief indicative of high rainfall/runoff and flooding with cyclone
, Wave Bore Impacting Banana Court Shops, Avarua CBD (Image: Coco Photo)")
TC Sally (1987), Wave Bore Impacting Banana Court Shops, Avarua CBD (Image: Coco Photo) Water level =2. 5 m MSL with 1 m wave bores

Key elements of port business and operations Demand, Trade Levels and Patterns Navigation and Berthing Vehicle Movements Inside Port Goods Handling Goods Storage Environmental Performance Inland Connected Infrastructure Social Performance Insurance

First Pass Vulnerability Assessment Part A Vulnerability of the key assets or operation areas • Water-Based (breakwaters, channel, navigation, tugboat) • Interface (wharves, slipway, fishing and recreation. . ) • Land-based (cranes, forklifts, trucks, storage sheds and stacks) • Connected Infrastructure (roads, fuel, power, communications, water, food, goods, waste services) were assessed against the defined extreme climatic events of • High Wind, • High Rainfall, • High Waves, • Temperature, • Sea Level Rise and • Cyclonic Events
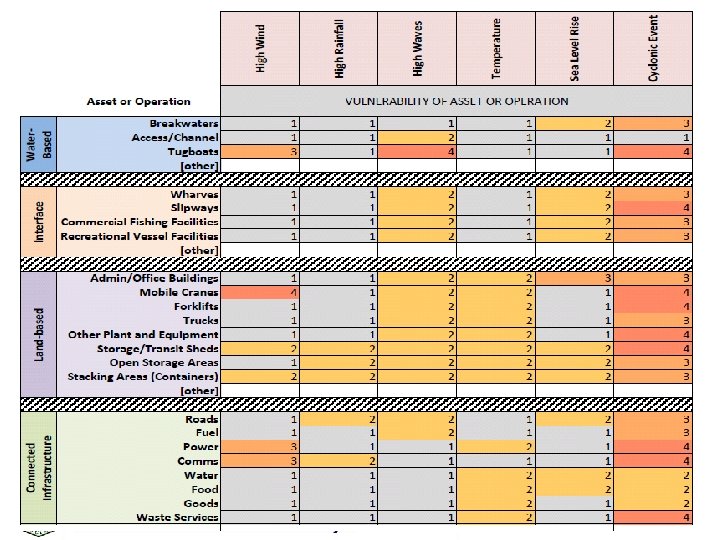

First Pass Vulnerability Assessment Part B • sought a greater appreciation for the role played by connected infrastructure. • A four-point rating scale was used to rate how important each piece of connected infrastructure was to maintaining port operations. • Rating was then sought for the converse - the importance of port operations for the continued operation of each identified piece of connected infrastructure.
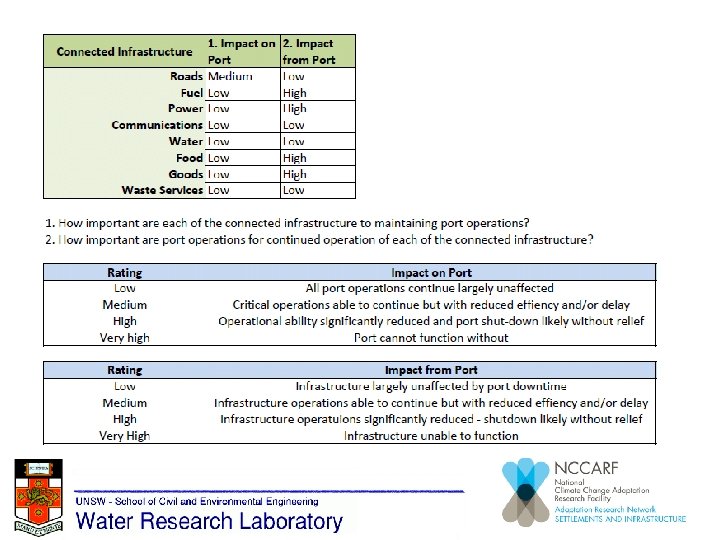

Results and key findings • Cyclones create highest risk • The port practice of removing all assets (water and land based) from the port region in face of an approaching cyclone limit the risk and for a 20 Year TC Sally event operations resume within a few days. • The recent upgrades to the port (with allowance for SLR) have assisted in limiting damage and risk • The port relies upon the road and bridge system but can operate without water, power and communications • In contrast the fuel, power, airport, food and goods and thus tourism and the economy rely heavily upon the port.
 • Formed 1971 as Group within")
National Committee on Coastal and Ocean Engineering (NCCOE) • Formed 1971 as Group within Civil College of Engineers Australia • Recognised climate change as a major issue for coastal, ocean and port engineering and planning with first workshops in the early 1980 s • First guidance document 1991

Coastal guidelines overview • Volume 1 - Guidelines for Responding to the Effects of Climate Change in Coastal and Ocean Engineering, originally published 1991 and updated 2004, 2012, 2017 • Volume 2 - Coastal Engineering Guidelines for working with the Australian Coast in an ecologically sustainable way, originally published 2004 and updated 2012, 2017. • Volume 3 - Climate Change Adaptation in Coastal Management and Planning, originally published 2012 and updated 2017

Engineers Australia Climate Change Adaptation Guidelines

Dealing with uncertainty ! r. cox@unsw. edu. au
- Slides: 40