Water Utilities and Drought Planning Indices Triggers Stages


")


 §")

 – Can disaggregate the demands –")


- Slides: 23
Water Utilities and Drought Planning: Indices, Triggers, Stages, and Response David Yates, David Purkey, Liz Mansfield CPASW 7 March 2008
The Water Utility Story Awwa. RF/NCAR • • Inland Empire Utility Agency, S. California Regional Utility Alliance in California, CABY Colorado Springs, CO Boston, MA NYC Durham, NC IEUA Palm Beach County, FL New York City, NY Portland, OR
Decision Analysis Approach
Water Utilities and Climate Information § Streamflow is the primary climate surrogate. § Planning is based on assumption of Stationarity § Should we assume “Stationarity is Dead”? Milly et al. 2008, Stationarity Is Dead: Whither Water Management? , Science
El Dorado Irrigation District Sac
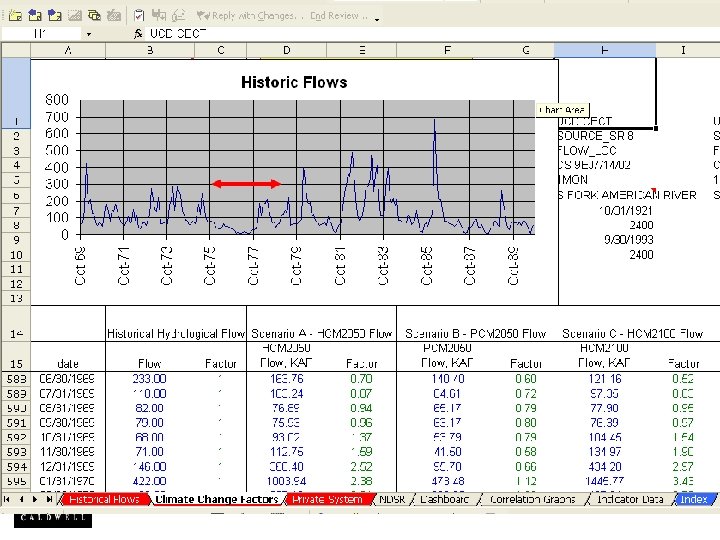
EID- Shared Vision Model n Drought Plan Built On: – Model of 3 -year “worst-case” dry year sequence – Historic hydrology – Historic Demands Supply Demand
EID- Shared Vision Model n Drought Plan Built On: – Model of 3 -year “worst-case” dry year sequence – Historic hydrology – Historic Demands Streamflow Supply Per. Cap & Pop Demand Reliability
Shared Vision Model • Water supply scenarios, rights and restrictions under low flow conditions • Build in drought indices • Test drought triggers by various stage scenarios • Test various trigger plans, including current plans • User–friendly, transparent, dynamic and consensus-based
Drought Plan Indicators include: – Water Yr Type – ENSO – Reservoir levels – Streamflow – Define a Supply Remain Index n Indicators are modeled in the SVM
EID Drought Plan Triggers Month May June Sept Any EID SRI Trigger Plan Summary Table Last ENSO SRI month's stage <0. 6 0 Any <0. 35* Any <=0. 75 <0. 10 <0. 12 >0. 75 1, 2, 3 2 0, 1, 2 3 0, 1, 2, 3 This month's stage 1 Last month’s stage 3 2 3 0 SRI “tuned” to achieve reliability for the worst drought of record
Drought Plan Response Preliminary Drought Stage Definitions Water supply conditions Normal 0% Total Supply Reduction Slightly Restricted Water Supplies Up to 15% Total Supply Moderately Restricted Reduction Water Supplies Up to 30% Total Supply Severely Restricted Reduction. Water Supplies Up to 50% Total Supply Reduction Drought stage Drought Stage Zero Ongoing Conservation. Drought Stage 1 Drought Stage 2 Drought Stage 3
EID Drought Plan Triggers – Supply Remaining Index (SRI)
SVM “Dashboard” “The Plan” Supply Demand Reliability
Drought Stage 1 Actions § Voluntary community response § Total demand reduction goal of up to 15% (GDPUD treated water customers only) § GDPUD managed supply of up to 50% raw water cutbacks § Monitor indicators and demands § Monthly Drought Interagency Coordination Committee meetings (DICC) § Initiate public outreach
Drought Stage 2 Actions § Voluntary community response (EID has potential mandatory phase) § Total demand reduction goal of up to 30% (GDPUD treated water customers only) § GDPUD managed supply of up to 50% raw water cutbacks § Monitor indicators and demands weekly § Weekly Drought Interagency Coordination Committee meetings (DICC) § Intensify public outreach
Stage 3: Customer Response Needs n Mandatory community response n Total demand reduction goal of up to 50% (GDPUD treated water customers only) n GDPUD managed supply of up to 100% raw water cutbacks n Monitor indicators and demands weekly n Weekly Drought Interagency Coordination Committee meetings (DICC) n Intensify public outreach
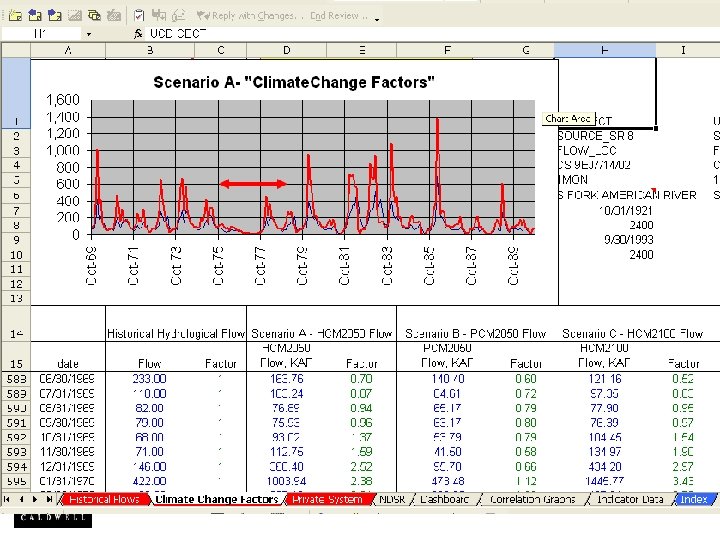
Adding Climate Information n Climate Driven DSS (WEAP) – Can disaggregate the demands – Look at Environmental conditions – Other competing Uses – Tradeoffs/ Benefits and Costs n Just starting to work with EID on advancing their drought plan – Michael Hanemann from UC Berkley (resource economist)
n Integrated watershed hydrology and water planning model n GIS-based, graphical drag & drop interface. n Physical simulation of water demands and supplies. n Additional simulation modeling: user-created variables and modeling equations. n Scenario management capabilities. n Seamless watershed hydrology, water quality and financial modules n Developed by the Stockholm Environment Institute, Boston’s USA’s office
El Dorado Irrigation District http: //weap 21. org
North Fork American at North Fork Dam
Middle Fork American at Foresthill