Water Supply System ENG MUSTAFA ABOU FOUL 1

Water Supply System ENG: MUSTAFA ABOU FOUL 1

Contents Water Supply System Sources of Potable Water Situation in Gaza Strip General Steps of Network Design Population forecasting 2
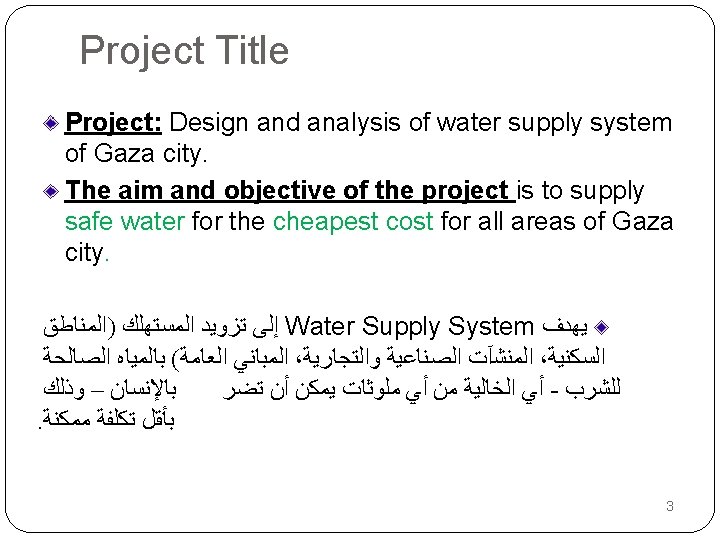

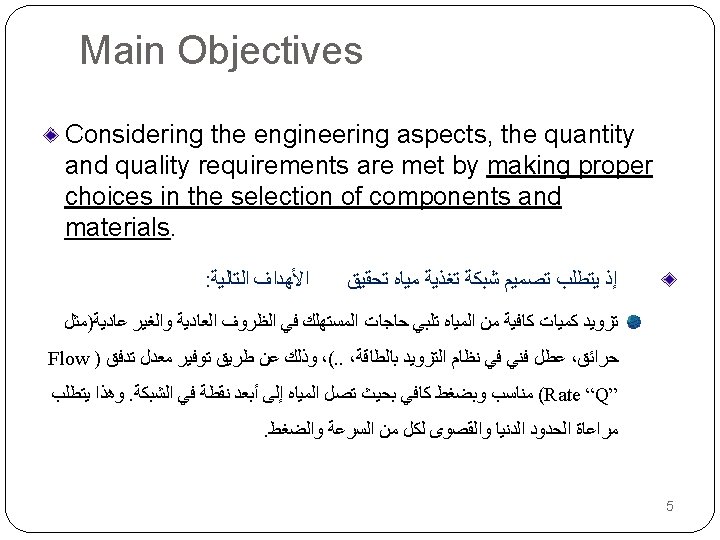
Main Objectives The main objectives of water transport and distribution systems are common: supply of adequate water quantities, maintaining the water quality achieved by the water treatment process Each of these objectives should be satisfied for all consumers at any moment and at acceptable cost. Speaking in hydraulic terms, sufficient quantity and quality of water can be maintained by adequate pressure and velocity. 4

 ﺷﻜﻞ 9")
Water Treatment (2) ﺷﻜﻞ 9
 may come from: Groundwater")
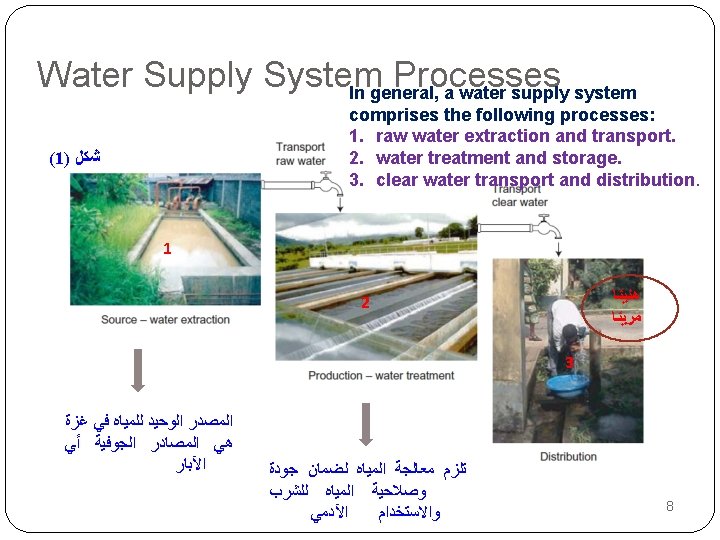
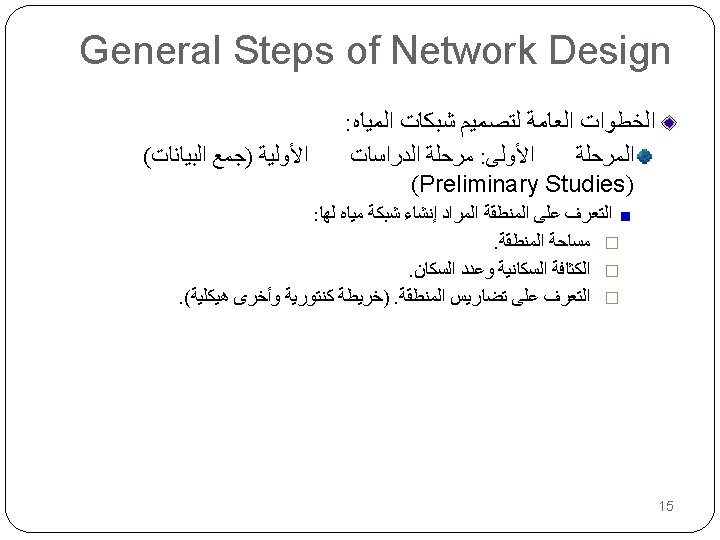
Sources of Potable Water Untreated water (also called raw water) may come from: Groundwater Sources such as wells. surface waters such as lakes, reservoirs, and rivers. The raw water is usually transported to a water treatment plant, where it is processed to produce treated water (also known as potable or finished water). 10


Lecture 1 Population forecasting

Design Period � Technical Lifetime : It represents the period during which it operates satisfactorily in a technical sense. � The suggested periods for the main distribution system components shown in the following table : 22 Component Period ( Years ) Transmission main 30 - 50 Distribution main 30 - 100 Reservoirs 20 - 80 Pumping station - facilities 20 - 80 Pumping station - equipment 15 - 30 Technical Concerns Economical Concerns

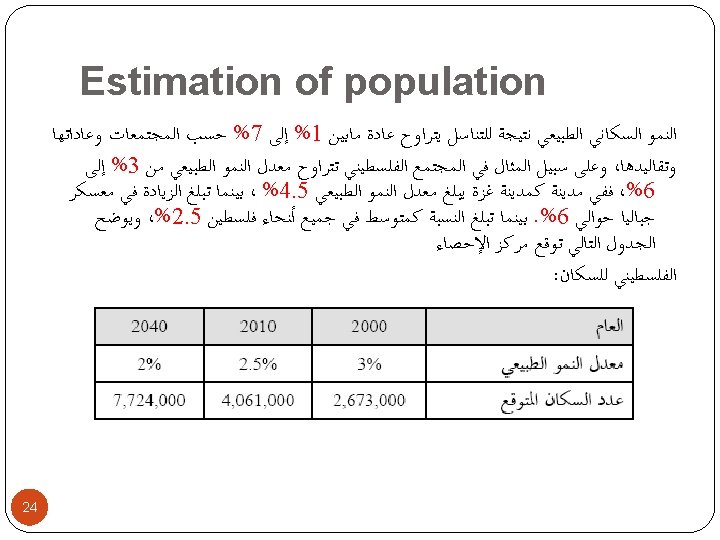
Estimation of design period 23

Population forecasting Arithmetic increase method ﺍﻟﻄﺮﻳﻘﺔ ﺍﻟﺮﻳﺎﺿﻴﺔ This method assume that the population density increase uniformly Population after time t Present population growth rate by each t unit This equation can be simplified to: 25

Uniform percentages Method ﻃﺮﻳﻘﺔ ﺫﺍﺕ ﺍﻟﻨﺴﺒﺔ ﺍﻟﻤﻨﺘﻈﻤﺔ population growth rate by each t unit • Predicted curves Method ﻃﺮﻳﻘﺔ ﺍﻟﻤﻨﺤﻨﻴﺎﺕ ﺍﻟﺘﻮﻗﻌﻴﺔ (curvilinear method) 26 population growth rate by each t unit

Example Estimate the population number after 30 year, if the initial population number is 100, 000. the population growth rate is 3% Method 1 Method 2 27 Method 3

Population Saturation and urban planning Ø Master Plane ü Land-Use ü General laws Although the population forecasting methods gives the population at the end of the design period, the maximum possible population is also estimated according to the number of apartment and stories per unit area and the maximum family members. The Saturation population can be determined using the Master plan for the area and its general laws. The minimum of the two values is taken in consideration when the network is designed. 28

Example A residential area 100, 000 m² and population of 4200 capita has the following Master Plan : 25 % of the total area is for Streets. 5 % of the total area is for green Areas. 70 % of the total area is for buildings. 60 % of the building area is for building. If the family living there consists of members and the average apartment area is 150 m², Calculate the Population needed for designing a water distribution system to serve that area for 25 years if you are given that the growth rate of the population = 3 %. 29
n Pt = 4200")
Cont. example 1. Population Forecasting : Pt = P 0 (1+k)n Pt = 4200 (1+0. 03)25 Pt = 8794 capita 2. Saturation Population : Total Building Area (m²) 0. 7 × 100, 000 = 70, 000 Building Area (m²) 0. 6 × 70, 000 = 42, 000 5 Stories Building Area 42, 000 × 5 = 210, 000 No. of Apartments 210, 000 / 150 =1400 Saturation Population 1, 400 × 5 = 7000 capita The Population = 7000 capita 30

Area Study Residential Area Public Area Commercial Area Agricultural Area Streets
 % Total Area 641 Duonm 100 Residential Area 519, 917")
Item Area (m 2) % Total Area 641 Duonm 100 Residential Area 519, 917 81 Public Area 19, 230 3 Commercial Area 25, 640 4 Agricultural Area 12, 820 2 Industrial Area 38, 460 6 Streets 25, 640 4
")
Population Density Calculation of total number of residents: 1. Normal Increase ( using equations) Hypothetical figures Example: Total Area of Southern Remal = 2, 754 Dounm - Total population in Southern Remal in 2002 = 17, 500 - Total population in Southern Remal in 2008 = 29, 300 Statistical Data

Continue. . �Population in Area under consideration:

Population Density 2. Saturation population Total Residential Area = 519, 917 m 2 Regular Buildings (5 floors or less) Towers (6 floors and more) 370, 122 149, 795 Avg. no. of floors 3 8 Avg. area of flats (m 2) 170 140 (370, 122/170) x 3 (149, 795/140) x 8 7 7 45, 721 59, 918 Area # of flats Avg. no. of persons/flat No. of residents Total number of population under saturation condition = 45, 721 + 59, 918 = 105, 639

Population Density Therefore, Population density= Population / Total Area = 99, 435 / 641, 000 = 0. 155 person/m 2

References Al-afifi, Ayman. “Lecture Notes”. Islamic University of Gaza, 2009. Khaleel, Alastal. “Lecture Notes”. Islamic University of Gaza, 2006. Mohammed Alhissy “Lecture Notes”. Islamic University of Gaza, 2010. Trifunovi, Nemanja. “Introduction to Urban Water Distribution”. Taylor&Francis Group, London 2006. 37
- Slides: 37