Water Resources Quality and Pollution Control Lecture 5


: 25% of the world’s population does")


 8")

: water shortage • Tajikistan")


 22")
, coming from animal and")


. Up to 1970")
 Environmental Objectives (Article 4): “Member States shall protect, enhance and")
- Slides: 44
Water Resources: Quality and Pollution Control Lecture 5 Ecological Data Evaluation GEN/PAD 2030. 2
OUTLINE • Water resources • Water Availability and Use • Water quality data evaluation • Water Management • Water Pollution • Pollution Control • Monitoring cycle in rivers and lakes • Freshwater quality monitoring
The Water Issue • “Water is the driving force in nature” Leonardo da Vinci • Water = material that makes life possible on Earth. • Water has remarkable physical properties: – Polar structure that defines the properties: • • Water expands when freezing (important!) High boiling point – liquid at room T Water can store heat – high latent heat Universal solvent: liquid at room T • Water quality is as important as its quantity. 3
Water Resources 70% of Earth is covered by water - oceans: ~97% of all the Earth’s water. ~3% of total water is freshwater, only a tiny fraction is available for use. Potable water is unpolluted fresh water, suitable for drinking. Most of freshwater is inaccessible: ice and glaciers 4
The Water Issue • World Health Organization (WHO): 25% of the world’s population does not have access to safe drinking water. • UN Water Statistics: 3. 4 mln deaths each year from water-related diseases: cholera, malaria, dysentery (2010) – they increased over the past decades. 5
Water Shortage UN defines area under water stress: if <1500 m 3 person per year water scarcity: < 1000 m 3 person per year severe water stress: < 500 m 3 person per year 6
Hydrologic Cycle • All water is locked into a constant recycling process called the hydrologic cycle. • Amount of water is fixed • 4 main processes in water cycle: 1) Evaporation: water from liquid to gas 2) Transpiration - process in which plants lose water via pores on their leaves 3) Condensation: warm, moist air rises, cools, condenses 4) Precipitation: rain, snow, hail • Reservoirs - places where water resides 7
Hydrologic Cycle (2) 8
Fresh Water sources • Rivers, Lakes and Streams • Lakes contain 100 times more water than all rivers. • Wetlands - Play a vital role in hydrologic cycle. • Includes swamps, marshes, flood plains • Have a high plant growth • Stabilizes soil, preventing erosion • Atmosphere - The smallest water reservoir. • Only 0. 001% of total water supply. • High turnover rate. 9
Water problems in Central Asia • Kazakhstan, Uzbekistan, Turkmenistan (down-stream): water shortage • Tajikistan and Kyrgyzstan (up-stream): rich in water 10
Central Asia: MAP 11
Ways to Increase Water Supplies • Building Dams, Canals and Reservoirs • Towing Icebergs • Desalination – Requires a lot of energy – Methods: distillation and reverse osmosis 12
Building Dams, Canals & Reservoirs Large water losses by evaporation Loss of forests, displacing people Reservoir used for recreation and fishing Can produce cheap electricity Habitat destruction Provides water for irrigation 13
Domestic Water Use Average person consumes per day: • In European countries - < 200 L/day • In the USA > 400 L/day • In Africa - < 30 L/day WHO: optimal water consumption -100 L per capita per day! it meets all consumption and hygiene needs. Domestic water use in Kazakhstan 167 L/day – urban resident 68 L/day – rural resident 14
Water Use Trends 15
Water losses • Public attitude is a major cause of water loss. – As long as water is considered limitless, inexpensive resource, conservation measures are difficult to introduce. • Conservation of water • Losses within the distribution system: • Leaking water pipes and mains: – In developed world losses up to ~ 20%. – Poorer countries lose ~50% of water to leaks. 16
Agricultural & Industrial Water Use • Agricultural Water Use – Irrigation is the major consumer of water in the world. • Aral Sea: irrigation is the main reason of environmental disaster. • Worldwide: most of water consumption for agricultural needs • Developed countries consume > 50% of water for industry (USA, Canada) 17
Water Use in the World 18
Family Water Use Urban domestic water uses 19
Domestic Conservation We could save as much as half of domestic water! Largest domestic use is toilet flushing Turn off the tap! 20
Water Pollution Water pollution – any physical, biological or chemical change in water quality that adversely affects living organisms Point source pollution – from drain pipes: easy to monitor and regulate Non-point source pollution - from farm fields, feedlots, construction sites : hard to control 21
Oxygen and pollution in water Supply /demand of oxygen in water (in ppm) 22
Water Pollution: Types • ORGANIC: including biological pollution (infectious agents), coming from animal and human waste. • 2 main sources of toxic organic chemicals in water : – Industrial and household wastes. – Pesticides from agricultural fields. • Organic matter decays in water pollution. • Biochemical oxygen demand (BOD) - amount of oxygen required to decay organic matter. If too much organic matter in water, all available oxygen will be used up INORGANIC pollution: metals, salts, acids/bases THERMAL pollution – change in water T effects water quality 23
Oxygen-Demand Water Quality Oxygen amount – indicator of water quality: IF Dissolved Oxygen Content. DOC > 6 ppm Water is clean, will support aquatic life. IF DOC < 2 ppm Water is dead, unable to support life, EXCEPT for detritivores & decomposers. IF 2 ppm < DOC < 6 ppm Water is polluted, aquatic life is limited 24
Municipal Sewage Treatment • > 500 pathogenic bacteria, viruses, parasites can travel from human or animal excrement via water. • Primary Treatment - Physical separation of large solids from the waste stream. • Secondary Treatment - Biological degradation of dissolved organic compounds. • Tertiary Treatment - Removal of plant nutrients (nitrates and phosphates) from secondary effluent. 25
Acid Rain, Acid Deposition • Acid rain is a worldwide problem. • Acid rain has p. H < 5. 6 • Acid rains have concentrations of acid ~1000 times higher than normal. • Harmful effects of acid rain: 1) Property and structural damage • Limestone degradation 2) Damage to forests • Acidic soil results in reduced nutrient absorption 3) Lake acidification food chain disruption • Acid deposition is the accumulation of potential acidforming particles on a surface. 26
Acid Rain, Acid Deposition 27
Acid Rain Impact 28
Water Purification • Desinfection of drinking water: • Kazakhstan and Russia: – Chlorination method: low cost, high unpleasant taste & smell – Kazakhstan: from chlorine gas to hypochlorite • USA and many European countries - Fluoridation: fluoride content must be < MAC = 1. 5 ppm of F in EU; no smell, no taste; more expensive than chlorination. Other desinfection methods: Irradiation: UV, solar Ozonation Water purification: Chlorination vs Fluoridation. . ? 29
WATER QUALITY: factors Water Quality Monitoring and Assessment Water Quality Monitoring: = collection of the relevant information on water quality Water Quality Assessment: = process of evaluation of the physical, chemical and biological nature of water 30
WATER RESOURCES in KAZAKHSTAN • Major rivers: Irtysh, Ural, Ile, Ishym, Nura, Tobol, Syr- Dariya, Karatal, Talgar, Shu • • Inland seas and lakes: Caspian Sea, Aral Sea, Balkhash lake • Water shortage: down-stream location • Poor Water quality • Reasons: industrial impact: oil-gas, heavy metals (Al. Pavlodar, Hg – Nura, Cu – Balkhash) • no control over water resources (down-stream) • lack of agreements on trans-boundary rivers. 31
Dependence of Kazakh water resources on neighboring countries
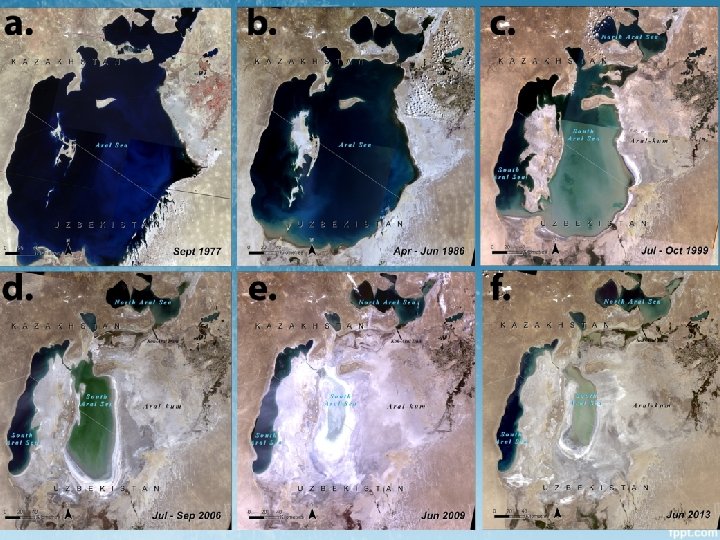
Case Study: The Aral Sea Disaster Aral Sea was once the world’s 4 th largest freshwater lake Figure 14 -17
Case Study: The Aral Sea Disaster • Using water from Aral Sea and its two feeder rivers Syr-Daria, Amu-Daria for irrigation is considered as major reason of its drying out. – Desertification: ~85% of the wetlands have been eliminated, sand-salt Aralkum desert (5. 5 mln ha) – Since 1961, salinity has tripled and the water has dropped by 22 m. – ~ 50% of the local bird and mammal species have disappeared. – Extinction of 20 of the 24 native fish species.
Air and Soil Pollution The large open seabed area is covered with pesticides. When wind blows, dust storms spread salt and toxic substances over hundreds km. It’s estimated that 75 mln tons of toxic dust are spread across Central Asia each year.
North Aral Sea case • In 1986 Aral Sea was split into northern and southern parts; • the northern part called Small Sea • Is it possible to restore Aral Sea? • World Bank: • Building 8 km Kok-Aral water dam revived Northern part: • accumulation of 29 km 3 water into the Small Sea • wetland ecosystems revived • fish population restored • water use for irrigation 37
Pollution Control • Water CODE of KAZAKHSTAN N 481, July 9, 2003 – to return water resources to usable conditions. • Set zero discharge for 126 priority toxic pollutants. • Water Quality regulation- two concepts: • Setting water quality standards for surface water. • Limiting effluent discharges into the water. • Non-point Pollution and Land Management • Less road salt to be used • Soil Conservation • Sewage Treatment • Water Remediation – process of water clean-up and repairing any damage caused by water. 38
Case study: Karagiye Depression “Kazakh Dubai” To create seaport and world class resort zone by filling depression with water via canal 39
Karagiye depression: 40 x 10 km size, 132 m depth, 30 km distance from Aktau
Case study: the European Union Water Framework Directive 41
Water Quality Management in the EU • 28 member states (2014). Up to 1970 s: especially aimed at economic expansion. 1972 -summit: more environmental awareness • Now every 5 years new Environment Action Program, each time with stricter goals. Evaluation in next summit; however no legally binding force. • Improving water quality by conventional or advanced wastewater treatment plants (P, N, for “sensitive” nature areas) • EU Water Framework Directive (EU-WFD) was implemented in the year 2000. Aim: good surface and groundwater quality in all member states, by the year 2015 42
Water Framework Directive (WFD) Environmental Objectives (Article 4): “Member States shall protect, enhance and restore all bodies of surface water … with the aim of achieving good surface water status at the latest 15 years after the date of entry into force of this directive (2015)“ • (International) River Basin approach • Good Ecological Status by 2015 • In every water body • Monitoring is a MUST • “One out, all out” • Programmes of measures 43