Water Quantity and Quality What is Water Pollution

, chemical (mercury), or biological (disease, sewage)")


")
 2. Oxygen-Demanding Waste Entamoeba histolytica Direct (microbes")
 2. Oxygen-Demanding Waste Treehole mosquito (carried La")


 2. Oxygen-Demanding Waste")
 and")
")


 4. Toxic Inorganic Materials 5. Persistent Organic Pollutants")


 4. Toxic Inorganic Materials 5. Persistent Organic Pollutants")


 4. Toxic Inorganic Materials 5. Persistent Organic Pollutants")


 Normal levels: 1 -50 NTU Drinking")


 Urban runoff")


- Slides: 41
Water Quantity and Quality
What is Water Pollution? any physical (temperature, oxygen), chemical (mercury), or biological (disease, sewage) change to water that adversely effects its use by living things
Cuyahoga River, Ohio Some river! Chocolatebrown, oily, bubbling with subsurface gases, it oozes rather than flows. "Anyone who falls into the Cuyahoga does not drown, " Cleveland's citizens joke grimly. "He decays. ” Time Magazine, August 1969 November 1952
Groundwater Pollution
Types of Water Pollution 1. Biological 2. Chemical 3. Physical Measured in: Percent (%) Parts per thousand (‰) Parts per million (ppm) Parts per billion (ppb)
Biological Water Pollution 1. Infectious Disease (Pathogens) 2. Oxygen-Demanding Waste Entamoeba histolytica Direct (microbes in water): Typhoid, cholera, dysentery, hepatitis…
Biological Water Pollution 1. Infectious Disease (Pathogens) 2. Oxygen-Demanding Waste Treehole mosquito (carried La Crosse ensephalitis) Indirect (Water breeding carriers): malaria, yellow fever, west nile virus…
Water Borne Disease
U. S. Water Borne Disease
Coliform Test Detection: Solutions: • Sewage treatment • Immunization
Biological Water Pollution 1. Infectious Disease (Pathogens) 2. Oxygen-Demanding Waste
Dissolved Oxygen Added by: turbulent water and photosynthesis Removed by: Increased temperature (exsolution) and respiration/decomposition Good: > 6 ppm (mosquitoes can survive in 1 ppm) (also measured in % of maximum - Good = 60 -80%)
Dissolved Carbon Dioxide Added by: respiration/decomposition & weathered rock Removed by: Increased temperature (exsolution) and photosynthesis Good: 1 -10 ppm (usually about 1 ppm)
Oxygen Sag
Measuring DO and other chemical properties
Chemical Water Pollution 3. Nutrients (Fertilizers) 4. Toxic Inorganic Materials 5. Persistent Organic Pollutants (POP’s) Nitrogen, phosphorous
Eutrophication Dissolved inorganic nitrogen in Baltic Sea & Blue Baby Syndrome
Nitrates • • • Typically: 0. 1 -4 ppm Unpolluted usually below 1 ppm Sewage pollution increase up to 20 ppm
Chemical Water Pollution 3. Nutrients (Fertilizers) 4. Toxic Inorganic Materials 5. Persistent Organic Pollutants (POP’s) 1. Heavy metals § mercury, lead, tin… 2. Super Toxic Elements § Arsenic, selenium… 3. Acids, salts, chlorine 4. Radioactive Isotopes
Arsenic in U. S. Waters
Some We Will Measure Copper • natural, fungicides, insecticides, copper pipes • can be lethal to some at 0. 1 ppb, algae – 1 -10 ppb, fish 500 ppb • water standard 0. 3 ppm Acidity (p. H) • 6. 5 -8. 2 normal (rainwater is usually a little acidic) • >9 – harmful to fish (inc. salmon) • <5. 5 releases metals in seds, bacteria die and organics don’t decay • <5 insects die and fish eggs don’t hatch • <4 lethal to adult salmon
Some We Will Measure Salinity • Saltwater 3. 5% • Freshwater 1 -500 ppm • usually >100 ppm is bad for freshwater organisms • >250 ppm tastes salty (max for drinking water) Total Dissolved Solids • (Ca, Mg, Hco 3, NH 4, NO 3, PO 4, SO 4, Na, Cl, Na, K) • from dissolved rock, fertilizer, urban runoff, irrigation, acid rainfall • “watchdog” – high numbers or rapid changes may indicate problem • typically 50 -250 ppm • Drinking water must be below 500 ppm
Chemical Water Pollution 3. Nutrients (Fertilizers) 4. Toxic Inorganic Materials 5. Persistent Organic Pollutants (POP’s)
Artificial Chemicals
The Dirty Dozen
Physical Water Pollution 6. Sediment 7. Thermal Pollution 8. Solid Waste Yellow River, China Chattahoochee River, GA
Measured in: NTU (Nephelometric • • Turbidity Units) Normal levels: 1 -50 NTU Drinking Water: 0. 5 -1 NTU Visible: >5 NTU Higher during storms
Physical Water Pollution 6. Sediment 7. Thermal Pollution 8. Solid Waste Causes: § industry § dams § removal of vegetation Optimum – Fish 5 -20°C (salmon <12°C)
Physical Water Pollution 6. Sediment 7. Thermal Pollution 8. Solid Waste
Pollution Sources: Point Source 1. 2. 3. 4. Sewage pipes Leaky gas tanks Industrial sites Injection wells
Pollution Sources: Nonpoint Source 1. 2. 3. 4. Agriculture (soil, fertilizer, pesticides) Urban runoff (from pavement) Construction sites Air Pollution
Controlling Water Quality What can we do?
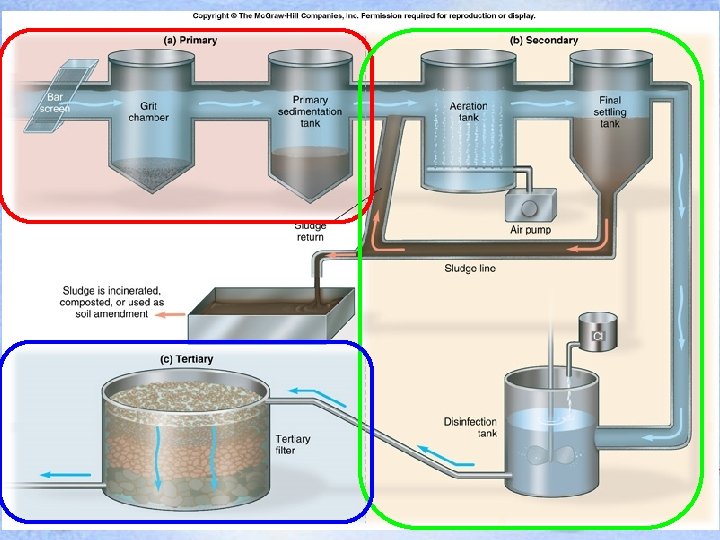
Solutions 1. Legislation 2. Source Reduction 3. Improved Land Use Practices 4. Remediation 5. Sewage Treatment
Clean Water Act 1972 1. 2. 3. 4. 5. Established water quality standards System for ID’ing point sources Pretreatment for industry Federal funding for sewage treatment Provided for enforcement ü Worked well for point sources ü Nonpoint sources still a problem
Solutions 1. Legislation 2. Source Reduction 3. Improved Land Use Practices 4. Remediation 5. Sewage Treatment 1. 2. 3. 4. 5. Remove lead from gasoline Reduce road salting Decrease erosion Banning phosphates in detergents Reduce fertilizer use, etc.
Solutions 1. Legislation 2. Source Reduction 3. Improved Land Use Practices 4. Remediation 5. Sewage Treatment 1. 2. 3. 4. Stormwater treatment Reduce clearcutting Preserve wetlands Better construction practices
Solutions 1. Legislation 2. Source Reduction 3. Improved Land Use Practices 4. Remediation 5. Sewage Treatment
Solutions 1. Legislation 2. Source Reduction 3. Improved Land Use Practices 4. Remediation 5. Sewage Treatment Water hyacinths absorb arsenic
Solutions 1. Legislation 2. Source Reduction 3. Improved Land Use Practices 4. Remediation 5. Sewage Treatment West Point Treatment Plant, Seattle
Sewage in King County