WATER PURIFICATION USING ULTRA VIOLET LIGHT EMITTING DIODES


- Slides: 37
WATER PURIFICATION USING ULTRA VIOLET LIGHT EMITTING DIODES A Concept Document for designing an efficient, robust and easy-to-use water purification system for the developing world. Team UV-LED (BVRIT)
CONTENTS Introduction Purpose of the Project Impurities in Water Drinking Water Standards The UVLED Water Purification System § Stages of Purification § Mechanical Design § Electrical Block Diagram § Maintenance References
INTRODUCTION Water is the most abundant natural resource on earth, covering more than 70% of the earth’s surface. However, only 2. 5% of it is freshwater. With rapidly expanding population and decreasing water content, the challenge to meet the drinking water requirement of the world arises. About 784 million people lack an access to safe drinking water and are falling prey to water borne diseases. Despite efforts from both governmental and private agencies to meet the increasing demand, the problem is persistent. One of the only solutions is development of an efficient, robust and easy to use house-hold-scale water purification system.
PURPOSE OF THE PROJECT To develop a cheap, energy efficient and easy-to-use water purification system, employing Ultra Violet Light Emitting diodes operating in the germicidal range and capable of inactivating bacteria, viruses, cysts and other water borne pathogens. The purifier is so fabricated as to be handled easily by the layman. This water purification system is mainly aimed at third world countries with people who have limited access to electrical power and fresh water supply.
CLIENT INFORMATION Dr. Dave Irvine Halliday, Prof. of Electrical Engineering at University of Calgary, Canada. Founder & CEO of VLE (Visionary Lighting & Energy). Co-Founder of LUTW (Light Up The World Found. )
IMPURITIES IN WATER Purity of water is affected by many factors, each contributing in its own way to making it unfit for drinking purposes. Broadly classifying, they are of two kinds: § Mechanical Impurities § Biological Impurities Mechanical Impurities include sand, dirt or other suspended solids which are easily removed by filtration and also include ions like fluorides, calcium, magnesium, sulfates etc. Biological Impurities are the major cause of water borne diseases and are myriad in variety, ranging from coliform bacteria to viruses, cysts and other pathogens.
INDICATORS OF WATER QUALITY There are several indicators of water quality that institutions like EPA, WHO and ISO laid down, but for our project, there are three key indicators that are taken into consideration given the equipment and facilities in hand. p. H: § This tells us about the acidity or basicity of a particular water sample. § Although p. H does not have any direct impact in water consumers, it is one of the most important water parameters. Total Dissolved Solids: § Total dissolved solids are defined as the combined content of all inorganic and organic substances contained in a liquid solution.
§ Total dissolved solids are generally discussed for fresh water systems and primarily attributed to agricultural and residential runoff. § It is also used as an indication of the aesthetic properties of water. Total Microbial Count: § Drinking water safety revolves around this single parameter. § It is the pathogens that are present in water that primarily affect the quality of drinking water. § When it comes to the case of microorganisms count, there are no preset standards. § However, several of bacterial and viral species are to be entirely absent for safety. § In any case, 99% and above is a thumb rule of sorts, in terms of removal of certain species.
DRINKING WATER STANDARDS p. H Standards: § Both WHO and Indian Standards suggest an acceptable p. H value of 6. 5 -8. 5 § Beyond this range, the water will affect the mucous membrane and/or the water supply system. Total Dissolved Solids: § WHO lays down 300 -600 mg/lit. as acceptable range while, Indian Standards recommend that it stays below 500 mg/lit. § Beyond this range, the palatability of water decreases and also causes gastro-intestinal irritation. Total Microbial Count: § As such, there are no standards laid down. However, its required that all microorganisms are eliminated.
THE UVLED WATER PURIFICATION SYSTEM • STAGES OF PURIFICATION • MECHANICAL DESIGN • ELECTRICAL BLOCK DIAGRAM
STAGES OF PURIFICATION Broadly speaking, there are two stages of water purification: § Pre-filtration § UV Disinfection Pre-filtration: The purpose of this stage is to make the raw water clear, or in other words, free from suspended solids and undesired ions (as mentioned previously). UV-Disinfection: This is the main stage, where in the microorganisms are exposed to Ultra Violet light and their DNAs are destroyed, rendering the bacteria incapacitate.
PRE-FILTRATION The first of the series of steps to make water pure is the filtration stage. In this stage, the total dissolved solids, defined as the combined content of organic and inorganic substances in either of molecular, ionized or colloidal forms, are trapped. The p. H is regulated and microorganisms are also destroyed but only to a certain extent. Water is passed through a packed bed of porous or adsorbing material where the solids suspended in water get either trapped or adsorbed respectively.
The three types of pre-filters proposed are § Ceramic § Activated Carbon § Combination of Activated and Ceramic Filters Ceramic Filter: § The ceramic candle is made of clay. § It functions on the principle of mechanical blocking. It traps the dissolved solids and pathogens that are greater than its pore diameter, usually about 0. 1 -10 microns in size. § The ceramic candles are usually lined with silver gel, which improves the candle’s efficiency to kill or incapacitate bacteria and also prevents algae to form around the candle.
Activated Carbon Filter: § Activated carbon is used in filtration due to its high adsorption capacity. § It serves well in adsorbing both organic and inorganic contaminants. The active carbon also absorbs compounds such as chlorine. § But the only disadvantage is that it needs to be replaced periodically to ensure proper functioning of the activated carbon. Combination of Ceramic and Activated Carbon Filter § The Combination of the two filters is achieved by impregnating the ceramic candles with a specific amount of activated carbon.
In our case, the dimensions of the ceramic candle are: § Height = 18 cm § Outer Diameter = 5 cm § Thickness = 1 cm The inner wall of the ceramic candle is lined with silver gel in a way that it does not leach away, to prevent formation of algae around the filter. However, the flow rate coming out of the combination filter is lower than either of the single filters.
TESTING METHODS FOLLOWED p. H Test: Calibration of the p. H meter: The calibration is done by using a standard buffer. A buffer solution is an aqueous solution consisting of a weak acid and its conjugate base or a weak base and its conjugate acid Procedure: The standard buffer powder sachet (p. H of 9. 0) is emptied into 20 ml of distilled water. After complete mixing, the solution is diluted to 100 ml. The temperature of the p. H meter is set to room temperature and the electrode is introduced into the buffer solution. The reading is set to 9. 0. Determining p. H of the Solution: The solution whose p. H is to be determined is taken and the calibrated electrode is dipped into the solution
TDS Measurement: The Total Dissolved solids content in water can be measured predominantly in two ways: Gravimetric analysis: By evaporating all the water present in the sample and correspondingly weighing the residues. Conductivity Measurement: Electrical conductivity of water is directly related to the dissolved (and hence ionized) solids present in water. Ions dissolved in water, enables it to conduct an electric current, which can be measured using a TDS meter. The procedure of measuring TDS has two steps involved: Calibration of the TDS meter: Calibration is done by dipping the TDS meter into a 20% Na. Cl solution (by weight) and setting the meter to 1500 ppm. Measurement of Sample TDS: The calibrated TDS meter is dipped into the solutions whose TDS is to be found. The stabilized readings are noted down.
Microbial Growth by Plate Count Method: The plate count method is one of the best ways of estimating the number of microbes present in the given sample of fluid. The other most frequently used method of determining the same is the Spectrophotometric or Turbidimetric analysis. The difference between the two procedures is that the plate count method reveals the number of live bacteria while the turbidimetric analysis reveals the total cell biomass present in the given sample. The standard plate count method consists of three steps: Collection of the Water Sample: The water which is to be tested for microorganisms is collected in 2 ml sample bottles and labeled conveniently. It is made sure that the sample bottles are sterile and free from contamination.
Preparation of Nutrient Agar: § § § § For the preparation of nutrient agar, we require the following: Beef/meat extract Peptone Sodium Chloride Agar Crystals Distilled Water Autoclave 0. 3% of Beef extract or meat extract, 0. 5% sodium chloride, 0. 5% peptone and 2% of agar crystals form the base of nutrient agar. Firstly distilled water is taken and peptone, sodium chloride and beef extract are added to it. After boiling and well mixing of components, the agar crystals are added and simultaneous mixing and heating is continued till desired viscosity is attained. Then, around 15 -20 ml of nutrient agar is transferred to boiling tubes, tightly plugged with cotton and sterilized in autoclave at 15 psi pressure and 121 0 C for 20 minutes for optimum sterilization.
Incubation: After sterilization, nutrient agar is allowed to cool. Nutrient agar solidifies at 45 0 C, before solidification the cotton is unplugged and 1 ml of water sample is added to it aseptically, well mixed and transferred into petri dishes. After transferring into petri dishes, we wait for 15 minutes allowing the nutrient medium to solidify. Now the agar plated petri dishes are placed into BOD incubator at 37 0 C and incubated for 18 -24 hours. After incubation, number of colonies formed is counted on a colony counter. Each microbe forms a colony and the number of colonies gives number of bacteria in given sample of water. The micro bacterial count is measured in terms of no. of Colony Forming Units per milliliter.
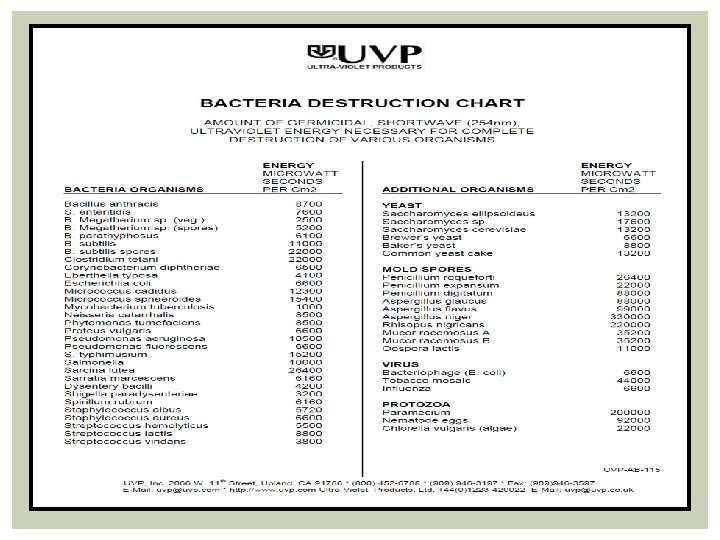
ULTRA VIOLET DISINFECTION The use of Ultra Violet rays for disinfection of water is by no means a new phenomenon. But the present day purifiers use UV lamps instead of UV LEDs for this purpose. The Ultra Violet Light penetrates and permanently alters the DNA of the microorganisms in a process called Thymine Dimerization. The microorganisms are then inactivated or rendered incapable of reproducing and thus harmless. One of the major advantages is that this is a non-chemical process and does not produce any by-products as such.
The region in the Spectrum that is absorbed by these microorganisms is UV-C and this wavelength does not reach the earth’s surface. We can also see by the above graph that the sweet spot for disinfection lies around 265 nm mark.
However, this is not entirely true, since even water absorbs some amount of energy that comes through UV rays. Thus, the right wavelength for maximum disinfection of microorganisms is 275 nm.
Perhaps the most important term while dealing with Ultra Violet disinfection of water is “Dosage”. This is given by the product of intensity and time, and is expressed in terms of (mille Joules per square centimeter). UV Dosage = Intensity*Time (mil. Joule/cm 2) From the above graphs, the optimum dosage for a 4 -log (99%) reduction of E. Coli. , the most dangerous form of bacterial parasites, is 9 m. J/cm 2 However viruses, cysts and other pathogens require much heavier dosages than 9 m. J in order to attain a 4 -log reduction. Thus, we can alter both optical intensity and residence time, in order to optimize the functioning of the purifier. Here, the UV Dosage is fixed as 20 m. J/cm 2
UVLED and its Specifications
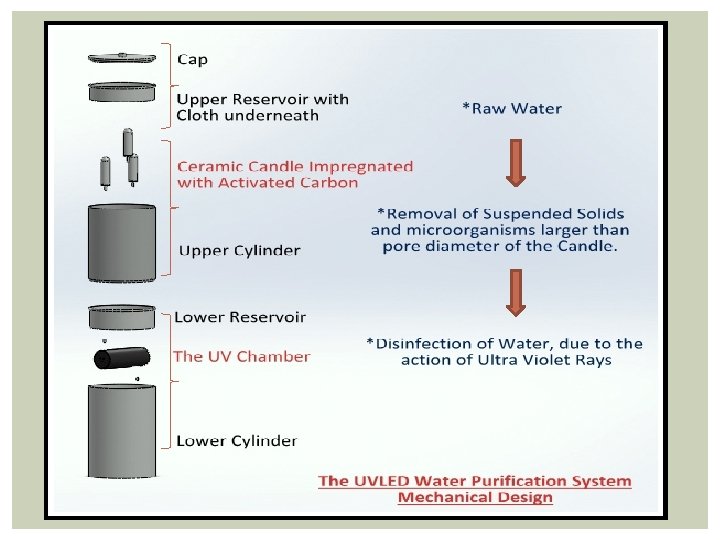
MECHANICAL DESIGN Raw Water Cloth or a Sieve to Filter Large dust Particles in Raw Water Reservoir for Holding Water Combination of Ceramic and Activated Carbon filter for Pre. Treatment of Water Entering UV Chamber Disinfection of Water using Ultra Violet LEDs Pure Water Schematic Diagram of UVLED Water Purifier
Design Factors which were considered: 1. For the Upper, Lower Cylinders and Reservoirs: § Material should be completely water resistant. § Should be able to bear minimum wear and tear of everyday life. § Should be cost effective and durable. § Thus, the best choices are High Density Polyethylene, Polyvinyl Chloride or Poly Propylene. 2. For the UV Chamber: § The material should be completely insoluble in water. § The material should not absorb UV light. § Should be cost effective and long lasting. § Thus, the inside of the UV chamber is coated with Aluminum oxide, which is completely insoluble in water and the chamber can be made from either Aluminum or Stainless Steel. § Both Aluminum and Stainless Steel are equally costly and since only a 2” dia. , one feet long pipe is required, it is preferred to use an Aluminum tube such that the oxide coating is easily applied and held.
85 cm The Thickness of Upper and Lower Cylinders, and reservoirs is 10 mm. The Outer Diameter of both the cylinders is 32 cm. The inner diameter of UV Chamber (Aluminum pipe) is 1. 5” The Aluminum Oxide coat and the thickness of the cylinder together comes up to 2” outer diameter. 30 c m *The space provided for the electrical casing and electronics mounting is not shown here.
Pre-Filtered Water Entering From the Lower Reservoir Water Level Sensor Control Valve, Inlet Crude Schematic of UV Chamber 2” OD Al. Pipe Quartz Window LEDs Pure, Disinfected Water The residence time inside the Chamber, of capacity 300 ml with a cross sectional area 11. 4 cm 2 and height 25 cm is comes out to be 76 seconds. However, since practical observations are not done, a safety factor of 100% is added, making it 152 seconds or roughly two and a half minutes for purification of 300 ml of water.
ELECTRICAL BLOCK DIAGRAM Power Switch and Fuse 12 V DC Rechargeable Battery Photovoltaic Array (DC) Logic Circuit for Valve Functioning UVLED Power Supply System Functioning Indicators
START Open Top Valve Level Sensor LOGIC SCHEMATIC FOR UVLED WATER PURIFIER Pure Water If Level Sensor state is 1 Close Top Valve Tset Value for UV On. Off is 152 seconds. Tset Value for Valve On-Off is 90 seconds. Turn on UV LEDs Open Bottom Valve Time == Tset Turn off UV LEDs Close Bottom Valve
Logic Circuit for Valve Opening and Closing coupled with Timer
MAINTENANCE Even after including easy maintenance of the purifier into consideration, there are certain chores the end users must do in order to safeguard the functioning of the purifier. Firstly, the ceramic candles are to be taken out and scrubbed gently on the outer surface so as to remove the cake formation on the top of the surface. They must then be placed in a hot water bath in order for reviving the pores and also the adsorption efficiency of activated carbon powder. For these purposes, the design is made such that all parts are easily assembled and dissembled.
REFERENCES http: //water. org/water-crisis/water-facts/water/ http: //www. cawst. org/en/resources/biosand-filter Scaling up Household Water Treatment among Low Income Populations by Thomas F. Clasen, London School of Hygiene & Tropical Medicine. (WHO/HSE/WSH/09. 02) http: //water. epa. gov/drink/contaminants/index. cfm http: //www. namoi. cma. nsw. gov. au/factsheet_water_quality_par ameters. pdf Heterotrophic Plate Counts and Drinking-water Safety, Published on behalf of the World Health Organization. http: //en. wikipedia. org http: //dspace. mit. edu/bitstream/handle/1721. 1/31120/6116247 4. pdf
http: //www. biotech. univ. gda. pl/odl/doc/numbers. pdf http: //www. hpa. org. uk/cdph/issues/CDPHVol 3/no 1/review. pdf http: //inst. bact. wisc. edu/inst/index. php? module=book&func=displa yarticle&art_id=273 http: //www. cliffsnotes. com/study_guide/Water-Quality. Tests. topic. Article. Id-8524, article. Id-8510. html http: //www. lrsm. upenn. edu/~frenchrh/download/9802 alokk. pdf http: //www. rapidmicrobiology. com/test-methods/Water. Testing. php