Water Pollution Chapter 21 Chapter 21 l Identify


 l")


 is a set of standard test parameters used to")
 l p. H l Temperature Change (ΔT) l Fecal")


 at 20°C Good 8– 9 Slightly polluted 6. 7– 8")


 l When organic matter decomposes, it is fed upon by")
 l When aquatic plants die, they are fed upon by")


 mayfly, sto Types of organisms")
 ions and OH- (hydroxyl) ions. The")


. l Fecal coliform")


 flow through sanitary sewers")


. l Phosphorus")


")
 Good (17 -22)")


 works with")


- Slides: 120
Water Pollution Chapter 21
Chapter 21 l Identify what pollutes water and the source of the pollution. l Identify the major pollution problems affecting our waterways including oceans, surface water and groundwater l Determine methods to “clean up” water l Describe state and federal water legislation
Vocabulary Words l Water pollution l point/non-point source l Biological Oxygen Demand (BOD) l Chemical Oxygen Demand (COD) l sludge l Safe Drinking Water Act l Clean Water Act l Oil Spill Prevention & Liability Act
Identifying Pollution l Which of the beakers on the front table contain polluted water? Chlorine, specific conductance l Acid, p. H l Organic constituents, lab analysis l Sediment, visual identification l Surfactants, visual identification l
We All Live Downstream l “Today, everybody is downstream from somebody else, ” William Ruckelshaus What does that mean? l How does that affect your water quality? l l Questions will be recorded in your books and turned in at the end of class l http: //media. oregonstate. edu/ramgen/db ase/0000167/downstream. rm
Water Pollution l Water pollution is any chemical, biological or physical change in water quality that has a harmful effect on living organisms or makes water unsuitable for desired uses. Who decides if water is “harmful”? l What does “harmful” mean? l Which “living organisms” matter? l
l “All substances are poisons, there is none which is not a poison. The right dose differentiates a poison and a remedy. ” Paracelsus (1493 -1541)
Toxicology l The study of the interaction between chemical agents and biological systems. l Toxicity is the relative ability of a substance to cause adverse effects in living organisms.
Definitions of “harmful” l Toxic refers to a parameter, constituent to pollutant that has an LD 50; in other words, it has been known to kill organisms (usually humans) l Hazardous refers to a compound which causes acute or chronic health problems, including, but not limited to, death.
The point is. . . l If the chemicals and biological agents that we use and produce as waste products were not “harmful” in some way to some population, there would be no point in studying water pollution.
The source of it all l Point source: pollution that comes from a specific location Sludge from a copper mine. Industrial discharge
Other Sources l Non-point source: pollution that occurs from multiple sources with no single polluter identified.
Who are the polluters? l The major source of 41 -48% water pollution is agriculture according to the EPA. l Connect the dots from population growth, food production, water use and water pollution. l Industrial l Municipal l Mining Facilities
What is water polluted with? l Disease-causing agents l Oxygen demanding waste l Plant nutrients (NO 3 -, PO 43 -) l Organic chemicals (solvents, petroleum) l Inorganic chemicals (Fe, Pb, NH 3) l Sediment l Heat
What are they polluting?
What else are they polluting?
Effects of Pollution l The two major effects of water pollution are: exposure to infectious agents from contaminated drinking water; and, l not having enough water for effective sanitation. l
Waterborne Diseases
What is “clean” or “safe”? l The definition of clean or safe water is very dependent on it’s use and the laws that affect the source and discharge of the water. l Example: p. H RCRA: 2 > S. U. > 12. 5 l SDWA: 6. 5 > S. U. > 8. 5 l HMTA: those substances which cause visible destruction to skin tissue l
The Water l Drinking Water: Safe Drinking Water Act l Surface Water: Clean Water Act l Groundwater: CWA, RCRA as Solid Waste, CERCLA for clean-up
Surface Water l Surface Water is polluted by: human activity l industrial activity l power plants l
Freshwater Sources
Water Quality l There are two classes of water quality standards: biological l chemical l
Chemical Water Quality Index (WQI) is a set of standard test parameters used to compare water quality all around the country. l An numerical WQI is assigned based on the results of nine (9) separate parameters
WQI Parameters Dissolved Oxygen (DO) l p. H l Temperature Change (ΔT) l Fecal Coliform l Biochemical Oxygen Demand (BOD) l Nitrates l Total Phosphates l Total Dissolved Solids (TDS) l Turbidity or Total Suspended Solids (TSS) l
Q Value l Measurements of each parameter are taken and recorded and then are converted into a “Q value”
Water Quality Factor Weights l The “Q” value for each parameter is determined and multiplied by a weighting factor: Dissolved oxygen l Fecal coliform l p. H l Biochemical oxygen demand l Temperature change l Total phosphate l Nitrates l Turbidity l Total solids l 0. 17 0. 16 0. 11 0. 10 0. 08 0. 07
Final calculation l The weighted “Q values” are added for all of the parameters and compared to a water quality index scale
The Scale l Water Quality Index Scale 91 - 100 : Excellent Water Quality l 71 - 90 : Good Water Quality l 51 - 70 : Medium or Average Quality l 26 - 50 : Fair Water Quality l 0 - 25 : Poor Water Quality l
Dissolved Oxygen l Oxygen gas is not very soluble in water. l As the temperature of a liquid increases, the solubilities of gases in that liquid decrease. l T , Solubility
Gas Solubility l We can use the Second Law of Thermodynamics to explain why. l Heating a solution of a gas enables the particles of gas to move more freely between the solution and the gas phase. l The Second Law predicts that they will shift to the more disordered, more highly dispersed, and therefore, more probably gas state.
Where does DO come from? l Most of the DO in surface water comes from contact with the atmosphere. Splashing and flowing water traps oxygen l Photosynthetic organisms also produce oxygen l
DO Test l The test for DO determines the availability of oxygen for aquatic life l A high concentration of DO indicates high water quality
Water Quality DO (ppm) at 20°C Good 8– 9 Slightly polluted 6. 7– 8 Moderately polluted Heavily polluted Gravely polluted 4. 5– 6. 7 Below 4. 5 Below 4 Fig. 21 -3, p. 496
Reference http: //www. indiana. edu/~bradwood/eagles/waterquality. htm
Physical Influences on Dissolved Oxygen l Water temperature and the volume of water moving down a river (discharge) affect dissolved oxygen levels. Gases, like oxygen, dissolve more easily in cooler water than in warmer water. In temperate areas, rivers respond to changes in air temperature by cooling or warming.
Climate and DO l River discharge is related to the climate of an area. During dry periods, flow may be severely reduced, and air and water temperatures are often higher. Both of these factors tend to reduce dissolved oxygen levels. Wet weather or melting snows increase flow, with a resulting greater mixing of atmospheric oxygen.
Human-Caused Changes in Dissolved Oxygen l The main factor contributing to changes in dissolved oxygen levels is the build- up of organic wastes. l Organic wastes consist of anything that was once part of a living plant or animal, including food, leaves, feces, etc. l Organic waste can enter rivers in sewage, urban and agricultural runoff, or in the discharge of food processing plants, meat packing houses, dairies, and other industrial sources.
Farming and Dissolved Oxygen l. A significant ingredient in urban and agricultural runoff are fertilizers that stimulate the growth of algae and other aquatic plants. As plants die, aerobic bacteria consume oxygen in the process of decomposition. Many kinds of bacteria also consume oxygen while decomposing sewage and other organic material in the river.
Changes in Aquatic Life l Depletions in dissolved oxygen cause major shifts in the kinds of aquatic organisms found in water bodies. l Species that cannot tolerate low levels of dissolved oxygen-mayfly nymphs, stonefly nymphs, caddisfly larvae, and beetle larvae-will be replaced by a few kinds of pollution-tolerant organisms, such as worms and fly larvae. l Nuisance algae and anaerobic organisms (that live without oxygen) may also become abundant in waters with low levels of dissolved oxygen.
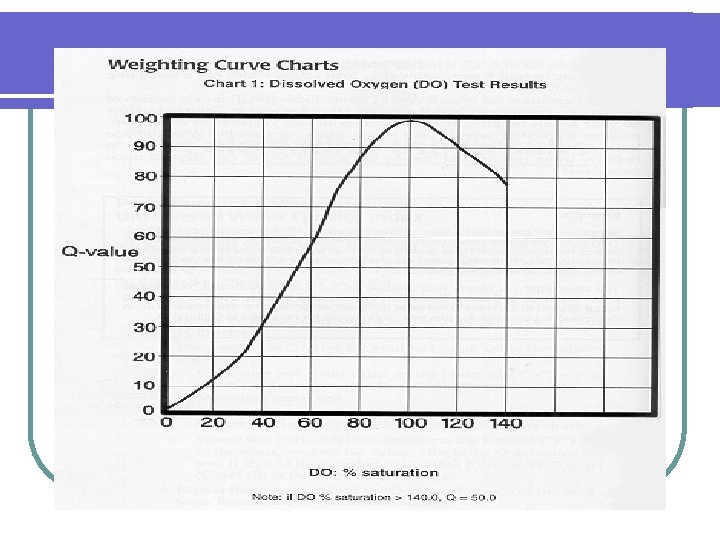
Calculating Percent Saturation l The percent saturation of water with dissolved oxygen at a given temperature is determined by pairing temperature of the water with the dissolved oxygen value, after first correcting your dissolved oxygen measurement for the effects of atmospheric pressure. This is done with the use of the correction table and the percent saturation chart.
Using the Conversion Charts l To calculate percent saturation, first correct your dissolved oxygen value (milligrams of oxygen per liter) for atmospheric pressure. Look at the correction chart. Using either your atmospheric pressure (as read from a barometer) or your local altitude (if a barometer is not available), read across to the right hand column to find the correction factor. Multiply your dissolved oxygen measurement by this factor to obtain a corrected value.
The Meaning of Percent Saturation l Rivers that consistently have a dissolved oxygen value of 90 percent or higher are considered healthy, unless the waters are supersaturated due to cultural eutrophication. l Rivers below 90 percent saturation may have large amounts of oxygen-demanding materials, i. e. organic wastes.
Biochemical Oxygen Demand (BOD) l When organic matter decomposes, it is fed upon by aerobic bacteria. In this process, organic matter is broken down and oxidized (combined with oxygen). Biochemical oxygen demand is a measure of the quantity of oxygen used by these microorganisms in the aerobic oxidation of organic matter.
Biochemical Oxygen Demand (BOD) l When aquatic plants die, they are fed upon by aerobic bacteria. The input of nutrients into a river, such as nitrates and phosphates, stimulates plant growth. Eventually, more plant growth leads to more plant decay. Nutrients, then, can be a prime contributor to high biochemical oxygen demand in rivers.
Sources of Organic Matter l There are natural sources of organic material which include organic matter entering lakes and rivers from swamps, bogs, and vegetation along the water, particularly leaf fall. l There also human sources of organic material. When these are identifiable points of discharge into rivers and lakes, they are called point sources.
Point Sources of Organic Matter l Point sources of organic pollution include: l pulp and paper mills; l meat-packing plants; l food processing industries; l wastewater treatment plants.
Non-point Sources of Organic Matter l Urban runoff of rain and melting snow that carries sewage from illegal sanitary sewer connections into storm drains; pet wastes from streets and sidewalks; nutrients from lawn fertilizers; leaves, grass clippings, and paper from residential areas; l Agricultural runoff that carries nutrients, like nitrogen and phosphates, from fields; l Runoff from animal feedlots that carries fecal material into rivers.
Changes in Aquatic Life l In rivers with high BOD levels, much of the available dissolved oxygen is consumed by aerobic bacteria, robbing other aquatic organisms of the oxygen they need to live. l Organisms that are more tolerant of lower dissolved oxygen may appear and become numerous, such as carp, midge larvae, and sewage worms. Organisms that are intolerant of low oxygen levels, such as caddisfly larvae, mayfly nymphs, and stonefly nymphs, will not survive.
Cause and Effect l As organic pollution increases, the ecologically stable and complex relationships present in waters containing a high diversity of organisms is replaced by a low diversity of pollution-tolerant organisms.
clean Clean Normanlisms water orga , bass, (Trout, perchnefly) mayfly, sto Types of organisms Dissolved oxygen (ppm) 8 ppm Biological oxygen demand ne Clean Zo Trash fish (carp, gar, leeches) sition Decompo Zone Fish absent, fungi, sludge worms, bacteria (anaerobic) Septic Zone r al clean wate m r o N Trash fish organismsbass, (carp, gar, (Trout, perch, ly) ef leeches) mayfly, ston 8 ppm ry Recove Zone ne Clean Zo Fig. 21 -4, p. 497
p. H l Water contains both H+ (hydrogen) ions and OH- (hydroxyl) ions. The p. H test measures the H+ ion concentration of liquids and substances.
Changes in p. H l It is important to remember that for every one unit change on the p. H scale, there is approximately a ten-fold change in how acidic or basic the sample is. l The average p. H of rainfall over much of the northeastern United States is 4. 3, or roughly ten times more acidic than normal rainfall of 5. 0 -5. 6. l Lakes of p. H 4 (acidic) are roughly 100 times more acidic than lakes of p. H 6.
Human-Caused Changes in p. H l In the U. S. , the p. H of natural water is usually between 6. 5 and 8. 5, although wide variations can occur. Increased amounts of nitrogen oxide (NOx) and sulfur dioxide (SO-2), primarily from automobile and coal-fired power plant emissions, are converted to nitric acid and sulfuric acid in the atmosphere.
Acid Neutralization l Acid rain is responsible for thousands of lakes in eastern Canada, northeastern United States, Sweden, and Finland becoming acidic. If limestone is present, the alkaline (basic) limestone neutralizes the effect the acids might have on lakes and streams. l The areas hardest hit by acid rain and snow are downwind of urban/industrial areas and do not have any limestone to reduce the acidity of the water.
Changes in Aquatic Life l Changes in the p. H value of water are important to many organisms. Most organisms have adapted to life in water of a specific p. H and may die if it changes even slightly. This happened to brook trout in some streams in the Northeast.
p. H Extremes l At extremely high or low p. H values (e. g. , 9. 6 or 4. 5) the water becomes unsuitable for most organisms. For example, immature stages of aquatic insects and young fish are extremely sensitive to p. H values below 5. l Very acidic waters can also cause heavy metals, such as copper and aluminum, to be released into the water.
Nitrates l Nitrogen is a much more abundant nutrient than phosphorus in nature. l Blue-green algae, the primary algae of algal blooms, are able to use N 2 and convert it into forms of nitrogen that plants can take up through their roots and use for growth: ammonia (NH 3) and nitrate (NO 3 -).
Nitrates l How do aquatic animals obtain the nitrogen they need to form proteins? l they either eat aquatic plants and convert plant proteins to specific animal proteins, l or, they eat other aquatic organisms which feed upon plants.
Nitrates l As aquatic plants and animals die, bacteria break down large protein molecules into ammonia. l Ammonia is then oxidized (combined with oxygen) by specialized bacteria to form nitrites (NO 2) and nitrates (NO-3). These bacteria get energy for metabolism from oxidation.
Nitrates l Excretions of aquatic organisms are very rich in ammonia, although the amount of nitrogen they add to waters is usually small. l Duck and geese, however, contribute a heavy load of nitrogen (from excrement) in areas where they are plentiful. algae into ammonia and nitrates.
Eutrophication l Eutrophication promotes more plant growth and decay, which in turn increases biochemical oxygen demand. l However, unlike phosphorus, nitrogen rarely limits plant growth, so plants are not as sensitive to increases in ammonia and nitrate levels.
Sources of Nitrates l Sewage is the main source of nitrates added by humans to rivers and lakes. l Septic systems are common in rural areas. l In properly functioning septic systems, soil particles remove nutrients like nitrates and phosphates before they reach groundwater.
Sources of Nitrates l When septic system drainfields are placed too close to the water table, nutrients and bacteria are able to percolate down into the groundwater where they may contaminate drinking water supplies. l Septic tanks must also be emptied periodically, to function properly.
Problems with Nitrate Contaminated Water l Water containing high nitrate levels can cause a serious condition called methemoglobinemia (met-hemo-glo-binemia), if it is used for infant milk formula. l This condition prevents the baby's blood from carrying oxygen; hence the nickname "blue baby" syndrome.
Water Temperature l The water temperature of a river is very important for water quality. l Many of the physical, biological, and chemical characteristics of a river are directly affected by temperature.
Temperature Influences l the amount of oxygen that can be dissolved in water; l the rate of photosynthesis by algae and larger aquatic plants; l the metabolic rates of aquatic organisms; l the sensitivity of organisms to toxic wastes, parasites, and diseases. l Remember, cool water can hold more oxygen than warm water, because gases are more easily dissolved in cool water.
Human-Caused Changes in Temperature l Thermal pollution is an increase in water temperature caused by adding relatively warm water to a body of water. l Industries, such as nuclear power plants, may cause thermal pollution by discharging water used to cool machinery. l Thermal pollution may also come from stormwater running off warmed urban surfaces, such as streets, sidewalks, and parking lots.
Human Temperature l People also affect water temperature by cutting down trees that help shade the river, exposing the water to direct sunlight. l Soil erosion can also contribute to warmer water temperatures. Soil erosion raises water temperatures because it increases the amount of suspended solids carried by the river, making the water cloudy (turbid). Cloudy water absorbs the sun's rays, causing water temperature to rise.
Changes in Aquatic Life l As water temperature rises, the rate of photosynthesis and plant growth also increases. l More plants grow and die. l As plants die, they are decomposed by bacteria that consume oxygen. l Therefore, when the rate of photosynthesis is increased, the need for oxygen in the water (BOD) is also increased.
Hot Animals l The metabolic rate of organisms also rises with increasing water temperatures, resulting in even greater oxygen demand. l The life cycles of aquatic insects tend to speed up in warm water. l Animals that feed on these insects can be negatively affected, particularly birds that depend on insects emerging at key periods during their migratory flights.
Temperature Adaptations l Most aquatic organisms have adapted to survive within a range of water temperatures. Some organisms prefer cooler water, such as trout, stonefly nymphs, while others thrive under warmer conditions, such as carp and dragonfly nymphs. l As the temperature of a river increases, cool water species will be replaced by warm water organisms.
Temperature and Toxicity l Temperature also affects aquatic life's sensitivity to toxic wastes, parasites, and disease. l Thermal pollution may cause fish to become more vulnerable to disease, either due to the stress of rising water temperatures or the resulting decrease in dissolved oxygen.
Turbidity l Turbidity is a measure of the relative clarity of water: the greater the turbidity, the murkier the water. l Turbidity increases as a result of suspended solids in the water that reduce the transmission of light. l Suspended solids are varied, ranging from clay, silt, and plankton, to industrial wastes and sewage.
Sources of Turbidity l High turbidity may be caused by soil erosion, waste discharge, urban runoff, abundant bottom feeders (such as carp) that stir up bottom sediments, or algal growth. l The presence of suspended solids may cause color changes in water, from nearly white to red-brown, or to green from algal blooms.
Changes in Aquatic Life l At higher levels of turbidity, water loses its ability to support a diversity of aquatic organisms. l Waters become warmer as suspended particles absorb heat from sunlight, causing oxygen levels to fall (warm water, less O 2). l Photosynthesis decreases because less light penetrates the water, causing further drops in oxygen levels. l The combination of warmer water, less light, and oxygen depletion makes it impossible for some forms of aquatic life to survive.
Suspended Solids l Suspended solids can clog fish gills, reduce growth rates, decrease resistance to disease, and prevent egg and larval development. l Particles of silt, clay, and organic materials can smother the eggs of fish and aquatic insects, as well as suffocate newly-hatched insect larvae. l Material that settles into the spaces between rocks makes these microhabitats unsuitable for mayfly nymphs, stonefly nymphs, caddisfly larvae, and other aquatic insects living there.
Fecal Coliform Bacteria l Fecal coliform bacteria are found in the feces of humans and other warmblooded animals. l These bacteria can enter rivers directly or from agricultural and storm runoff carrying wastes from birds and mammals, and from human sewage discharged into the water.
Pathogenic Organisms l Fecal coliform by themselves are not dangerous (pathogenic). l Fecal coliform bacteria naturally occur in the human digestive tract, and aid in the digestion of food. l In infected individuals, pathogenic organisms are found along with fecal coliform bacteria.
Presence of Both l If fecal coliform counts are high (over 200 colonies/100 ml of water sample) in the river, there is a greater chance that pathogenic organisms are also present. l Diseases and illness such as typhoid fever, hepatitis, gastroenteritis, dysentery, and ear infections can be contracted in waters with high fecal coliform counts.
What to monitor? l Pathogens are relatively scarce in water, making them difficult and timeconsuming to monitor directly. Instead, fecal coliform levels are monitored, because of the correlation between fecal coliform counts and the probability of contracting a disease from the water.
Municipal Monitoring l Sanitary wastes (from toilets, washers, and sinks) flow through sanitary sewers and are treated at the wastewater treatment plant. l Storm sewers carry rain and snow melt from streets, and discharge untreated water directly into rivers. l Heavy rains and melting snow wash animal wastes from sidewalks and streets and may wash fecal coliform into the storm sewers.
Standards
Phosphorus l Phosphorus is usually present in natural waters as phosphate. l Organic phosphate is a part of living plants and animals, their by-products, and their remains. l Inorganic phosphates are ions and are bonded to soil particles; there are some phosphates present in laundry detergents.
Phosphorus is essential l Phosphorus is a plant nutrient needed for growth, and a fundamental element in the metabolic reactions of plants and animals. l Plant growth is limited by the amount of phosphorus available. l In most waters, phosphorus functions as a "growth-limiting" factor because it is usually present in very low concentrations.
Phosphorus is scarce l The natural scarcity of phosphorus can be explained by its attraction to organic matter and soil particles. l Any unattached or “free" phosphorus, in the form of inorganic phosphates, is rapidly taken up by algae and larger aquatic plants. l Because algae only require small amounts of phosphorus to live, excess phosphorus causes extensive algal growth called "blooms. "
Eutrophication l Most of the eutrophication occurring today is human-caused (cultural eutrophication). l Phosphorus from natural sources generally becomes trapped in bottom sediments or is rapidly taken up by aquatic plants. Forest fires and fallout from volcanic eruptions are natural events that cause eutrophication.
Sources of Phosphorus l Phosphorus comes from several sources: human wastes, animal wastes, industrial wastes, and human disturbance of the land its vegetation. l Sewage effluent (out flow) should not contain more than 1 mg/ L phosphorus according to the U. S. EPA.
Sources of P l Storm sewers sometimes contain illegal connections to sanitary sewers. Sewage from these connections can be carried into waterways by rainfall and melting snow. l Phosphorus-containing animal wastes sometimes find their way into rivers and lakes in the runoff from feedlots and barnyards.
Erosion is a source l Soil erosion contributes phosphorus to rivers. l The removal of natural vegetation for farming or construction exposes soil to the eroding action of rain and melting snow. l Draining swamps and marshes for farmland or construction projects releases phosphorus that has remained dormant in years of accumulated organic deposits. l Drained wetlands no longer function as filters of silt and phosphorus, allowing more runoff -and phosphorus- to enter waterways.
Impacts of Cultural Eutrophication l The first symptom of cultural eutrophication is an algal bloom that colors the water a pea -soup green. l The advanced stages of cultural eutrophication can produce anaerobic conditions in which oxygen in the water is completely depleted. l These conditions usually occur near the bottom of a lake or impounded river stretch, and produce gases like hydrogen sulfide, unmistakable for its "rotten egg" smell.
Changes in Aquatic Life l Cultural eutrophication causes a shift in aquatic life to a fewer number of pollution tolerant species. l The species that can tolerate low dissolved oxygen levels include-carp, midge larvae, sewage worms (Tubifex), and others.
Reversing the Effects of Cultural Eutrophication l Aquatic ecosystems have the capacity to recover if the opportunity is provided by: l Reducing our use of lawn fertilizers; l Encouraging better farming practices; l l Preserving natural vegetation whenever possible, particularly near shorelines; preserving wetlands to absorb nutrients and maintain water levels; enacting strict ordinances to prevent soil erosion; Supporting measures (including taxes) to improve phosphorus removal by wastewater treatment plants and septic systems; treating storm sewer wastes if necessary; encouraging homeowners along lakes and streams to invest in community sewer systems;
Biological Monitoring l You can determine the toxicity of an effluent or water sample to determine the LD 50 Ceriodaphnia dubia l Daphnia pulex l Pimephales promelas l l Stream monitoring: collect samples of organisms and collect data regarding identification and numbers
Save Our Streams l http: //www. vasos. org/pages/gettingstarte d. html l http: //www. vasos. org/pages/documents/ vasosstandardoperatingprocedures. pdf
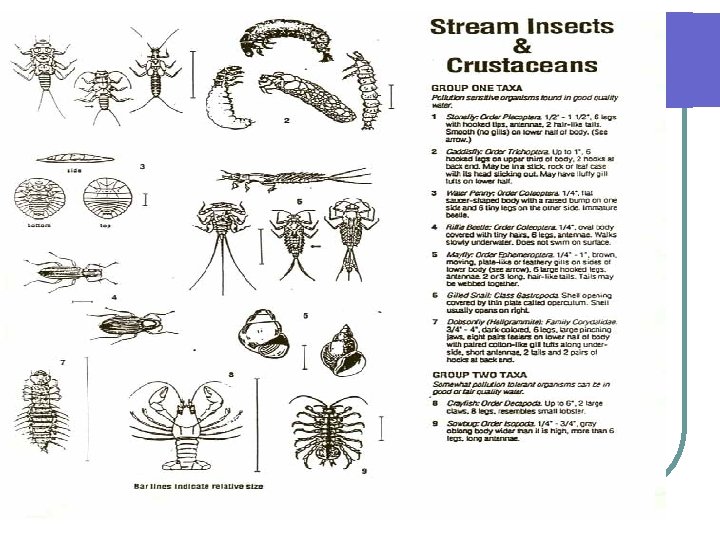
Using Insects to Study Stream Health l. A sample of stream insects, or “macroinvertebrates” is collected, identified and counted. l http: //www. vasos. org/Modified. Bug. IDCar doct 2004. pdf
Sensitive Insects # Types x 3 l caddisfly larva l hellgrammite l mayfly nymph l gilled snails l riffle beetle adult l stonefly nymph l water penny larva
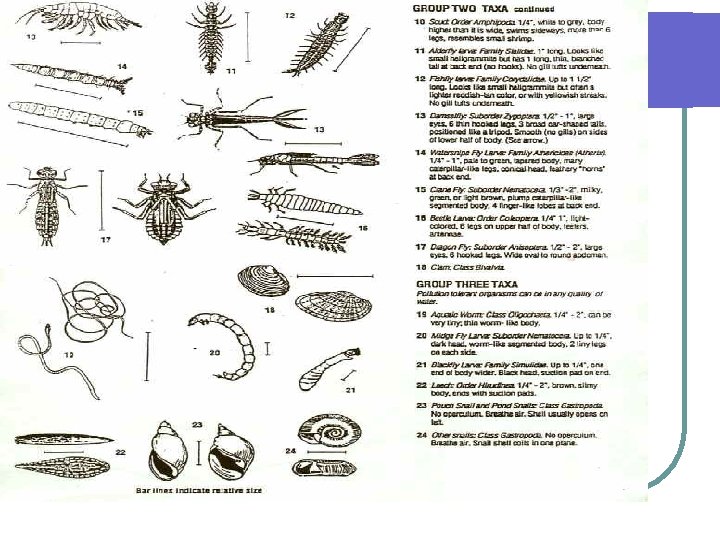
Somewhat Sensitive Insects # Types x 2 l l l l beetle larva clams crane fly larva crayfish damselfly nymph dragonfly nymph scuds sowbugs fishfly larva l alderfly larva l blackfly larva l atherix l
Very Tolerant Organisms # Types x 1 l aquatic worms l pouch (& other) snails l leeches l midge larva
The Quality Rating Scale l WATER QUALITY RATING l Excellent (>22) Good (17 -22) Fair (11 -16) Poor (<11)
What about groundwater? l Groundwater pollution caused by human activities usually falls into one of two categories: point-source pollution and nonpoint-source pollution. l Point-source contamination originates from a single tank, disposal site, or facility. Industrial waste disposal sites, accidental spills, leaking gasoline storage tanks, and dumps or landfills are examples of point sources.
Non-point Source Groundwater Contamination l Chemicals used in agriculture, such as fertilizers, pesticides, and herbicides are examples of nonpoint-source pollution because they are spread out across wide areas. l Runoff from urban areas is a nonpoint source of pollution. l Because nonpoint-source substances are used over large areas, they collectively can have a larger impact on the general quality of water in an aquifer than do point sources,
Leaking tank Aqu ife r Water table Bedr ock Groundwater flow Free gasoline dissolves in Gasoline groundwater leakage plume (dissolved (liquid phase) Migrating vapor phase Contaminant plume moves with the groundwater Water well Fig. 21 -8, p. 502
Contamination can move! l Groundwater tends to move very slowly and with little turbulence, dilution, or mixing. l Therefore, once contaminants reach groundwater, they tend to form a concentrated plume that flows along with groundwater. l Despite the slow movement of contamination through an aquifer, groundwater pollution often goes undetected for years, and as a result can spread over a large area. One chlorinated solvent plume in Arizona, for instance, is 0. 8 kilometers (0. 5 miles) wide and several km long!
Groundwater Migration l Groundwater migration models use hydrology, geology and soil science to predict the flow of the aquifer and the subsequent contamination. Methods are very complex. l Computer based models are used to predict the potential reach of the contaminated plume. l
Groundwater Laws l The two major federal laws that focus on remediating groundwater contamination include the Resource Conservation and Recovery Act (RCRA) and the Comprehensive Environmental Response, Compensation, and Liability Act (CERCLA), also known as Superfund.
Groundwater Laws: RCRA and CERCLA l RCRA regulates storage, transportation, treatment, and disposal of solid and hazardous wastes, and emphasizes prevention of releases through management standards in addition to other waste management activities. l CERCLA regulates the cleanup of abandoned waste sites or operating facilities that have contaminated soil or groundwater. CERCLA was amended in 1986 to include provisions authorizing citizens to sue violators of the law.
Groundwater Clean-up l The EPA decides who is responsible for the clean-up process and monitors progress. Containment l Removal l Bioremediation l Treatment l
Ocean Pollution l 80 percent of pollution to the marine environment comes from land-based sources, such as runoff pollution. Runoff pollution includes many small sources, like septic tanks, cars, trucks and boats, plus larger sources, such as farms, ranches and forest areas.
NOAA’s Role l The Commerce Department's National Oceanic and Atmospheric Administration (NOAA) works with the Environmental Protection Agency, Department of Agriculture and other federal and state agencies to develop ways to control runoff pollution. l NOAA's Coastal Zone Management Program is helping to create special non-point source pollution control plans for each participating coastal state. When runoff pollution does cause problems, NOAA scientists help track down the exact causes and find solutions.
Industry Nitrogen oxides from autos and smokestacks, toxic chemicals, and heavy metals in effluents flow into bays and estuaries. Cities Toxic metals and oil from streets and parking lots pollute waters; Urban sprawl Bacteria and viruses from sewers and septic tanks contaminate shellfish beds Construction sites Sediments are washed into waterways, choking fish and plants, clouding waters, and blocking sunlight. Farms Runoff of pesticides, manure, and fertilizers adds toxins and excess nitrogen and phosphorus. Closed shellfish beds Closed beach Oxygen-depleted zone Red tides Excess nitrogen causes explosive growth of toxicmicroscopic algae, poisoning fish and marine mammals. Toxic sediments Chemicals and toxic metals contaminate shellfish beds, kill spawning fish, and accumulate in the tissues of bottom feeders. Oxygen-depleted zone Sedimentation and algae overgrowth reduce sunlight, kill beneficial sea grasses, use up oxygen, and degrade habitat. Healthy zone Clear, oxygen-rich waters promote growth of plankton and sea grasses, and support fish. Fig. 21 -10, p. 505
The Law l The Ocean Dumping Act has two basic aims: to regulate intentional ocean disposal of materials, and to authorize related research. l Title I of the Marine Protection, Research, and Sanctuaries Act of 1972, contains permit and enforcement provisions for ocean dumping. l Research provisions are contained in Title II, concerning general and ocean disposal research; l Title IV, which established a regional marine research program; and l Title V, which addresses coastal water quality monitoring. l The third title of the MPRSA, authorizes the establishment of marine sanctuaries.
Solutions l Dilution l is NOT the solution to pollution! Even though it rhymes!
Solutions Water Pollution • Prevent groundwater contamination • Reduce nonpoint runoff • Reuse treated wastewater for irrigation • Find substitutes for toxic pollutants • Work with nature to treat sewage • Practice four R's of resource use (refuse, reduce, recycle, reuse) • Reduce air pollution • Reduce poverty • Reduce birth rates Fig. 21 -18, p. 517
Solutions Groundwater Pollution Prevention Find substitutes for toxic chemicals Keep toxic chemicals out of the environment Install monitoring wells near landfills and underground tanks Require leak detectors on underground tanks Ban hazardous waste disposal in landfills and injection wells Store harmful liquids in aboveground tanks with leak detection and collection systems Cleanup Pump to surface, clean, and return to aquifer (very expensive) Inject microorganisms to clean up contamination (less expensive but still costly) Pump nanoparticles of inorganic compounds to remove pollutants (may be the cheapest, easiest, and most effective method but is still being developed) Fig. 21 -9, p. 504
Solutions Coastal Water Pollution Prevention Reduce input of toxic pollutants Cleanup Improve oil-spill cleanup capabilities Separate sewage and storm lines Ban dumping of wastes and sewage by maritime and cruise ships in coastal waters Ban ocean dumping of sludge and hazardous dredged material Sprinkle nanoparticles over an oil or sewage spill to dissolve the oil or sewage without creating harmful by-products (still under development) Protect sensitive areas from development, oil drilling, and oil shipping Require at least secondary treatment of coastal sewage Regulate coastal development Recycle used oil Use wetlands, solar-aquatic, or other methods to treat sewage Require double hulls for oil tankers Fig. 21 -14, p. 509
What Can You Do? Water Pollution • Fertilize garden and yard plants with manure or compost instead of commercial inorganic fertilizer. • Minimize your use of pesticides. • Do not apply fertilizer or pesticides near a body of water. • Grow or buy organic foods. • Do not drink bottled water unless tests show that your tap water is contaminated. Merely refill and reuse plastic bottles with tap water. • Compost your food wastes. • Do not use water fresheners in toilets. • Do not flush unwanted medicines down the toilet. • Do not pour pesticides, paints, solvents, oil, antifreeze, or other products containing harmful chemicals down the drain or onto the ground. Fig. 21 -19, p. 517