WATER MONITORING 101 Presented by Hoosier Riverwatch With

WATER MONITORING 101 Presented by: Hoosier Riverwatch With thanks to Empower Results

AGENDA • Watersheds 101 • Water Monitoring 101 • Importance of study design and site selection • Volunteer Monitoring • Activity

WATERSHED INTRO

WHAT IS A WATERSHED?

TOPOGRAPHY IS THE KEY WATERSHED DELINEATOR

WATERSHEDS SCALE 8 -digit HUC 11 -digit HUC 14 -digit HUC

STREAM ORDER

RIVER CONTINUUM CONCEPT Headwaters Streams heavily shaded, leaf litter is important shredders / collectors are abundant Mid-order Streams less shaded, algae more important grazers abundant Large Rivers not shaded, phytoplankton present collectors important

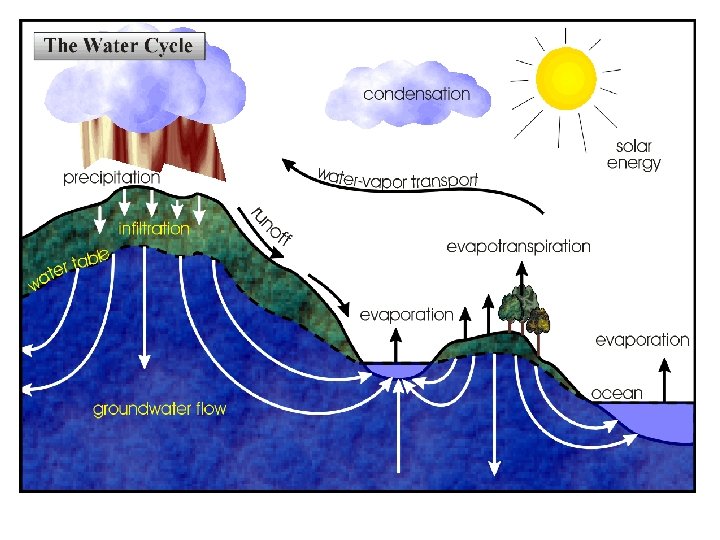
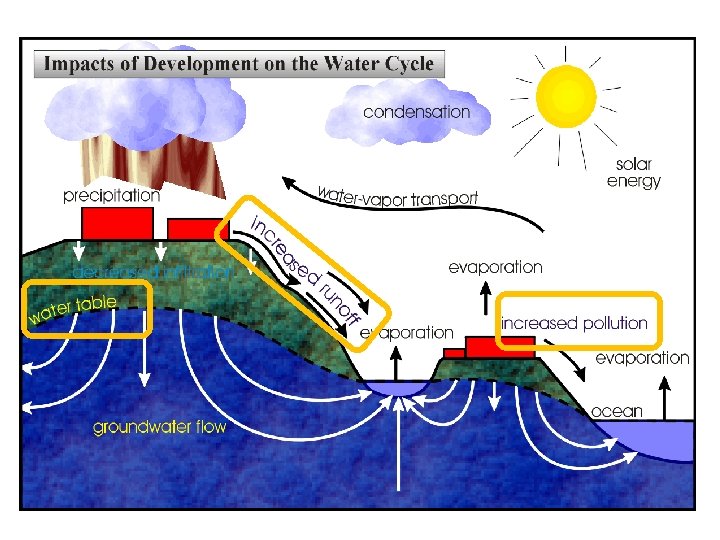
WHAT IS THE CONNECTION BETWEEN LAND USE AND WATER QUALITY?
 • Waters of U. S.")
WATER QUALITY • Regulated through Clean Water Act (1972) • Waters of U. S. must be “fishable and swimmable” by 1983 • Eliminate all pollution discharge to waters by 1985 Cuyahoga River, June 22 1969 http: //blog. cleveland. com/metro/2009/06/cuyahoga_river_fire_40_years_a. html

THERE IS NO SINGLE DEFINITION OF CLEAN WATER. The Clean Water Act defines clean water according to how we use it.

HOW DO WE USE WATER? • Beneficial uses: Drinking water Agriculture Industry Recreation Fisheries and other aquatic life Aesthetics

HOW DO YOU KNOW IF YOU HAVE CLEAN WATER? Water quality testing targets the pollutants that impact different beneficial uses.

POINT SOURCE POLLUTION • 25% of pollution in the U. S. • Direct discharge from industry, sewage treatment plants, etc. • Easier to identify due to “end of pipe”

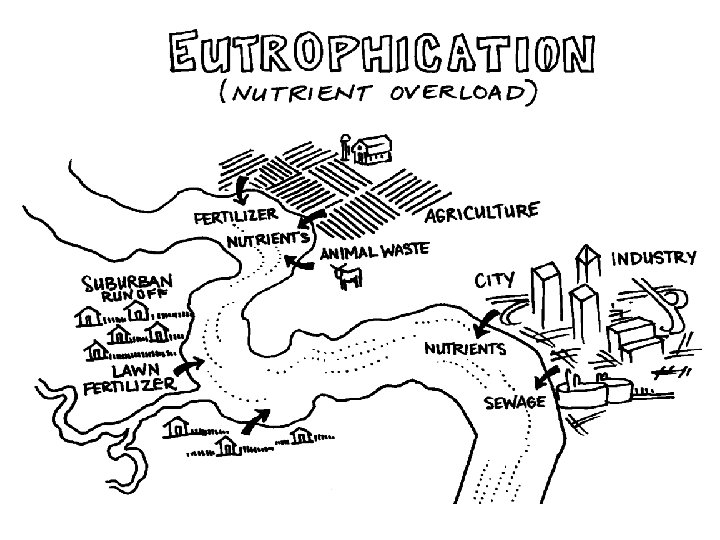
NONPOINT SOURCE POLLUTION • 75% of Pollution in the US • General runoff of water contaminated by poor land use, homes, streets, air, etc. • Difficult to identify

WHY DO WE WANT TO IMPROVE WATER QUALITY? • Maintain the natural habitat for wildlife, native plants, and your community • Support designated uses of waterbody Fishable Swimmable • Protect and maintain cultural significance • Protect drinking water (public health) • Esthetically pleasing

WHAT MEASURES ARE PART OF WATER QUALITY EVALUATIONS? Biological Chemical Physical Water Quality

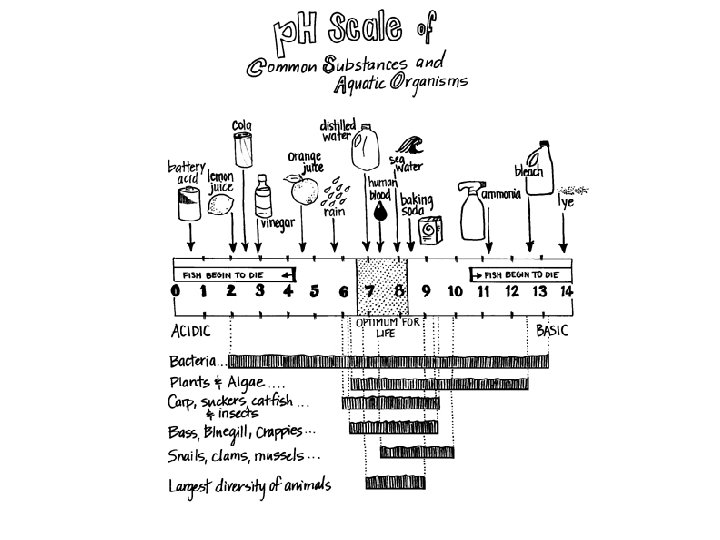
CHEMICAL ASSESSMENT • Dissolved Oxygen • E. coli and general coliforms • p. H • Biochemical Oxygen Demand 5 -day • Water Temperature Change • Phosphates • Nitrates and Nitrites • Turbidity/Transparency
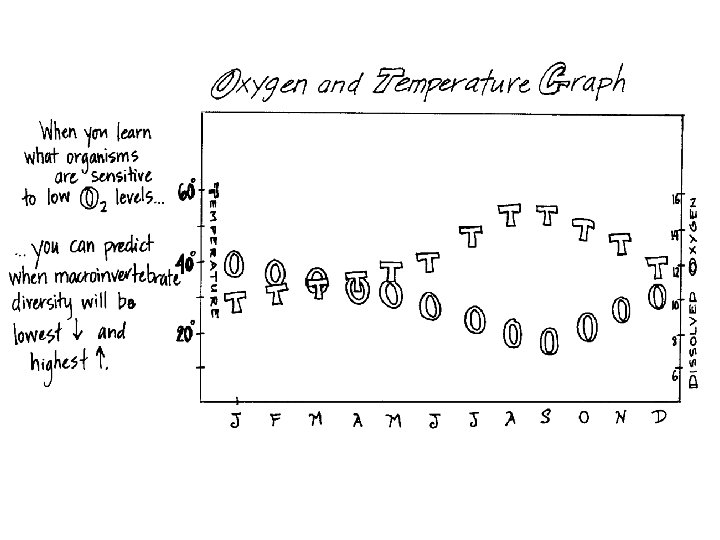

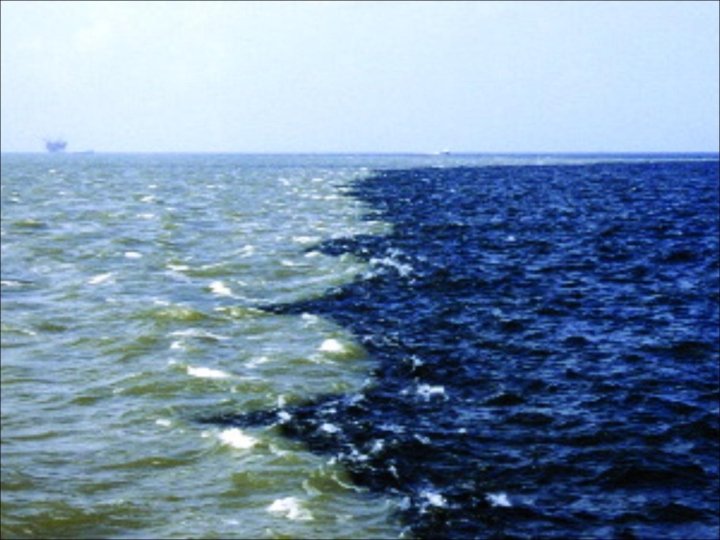
Temp BOD Gulf of Mexico’s “dead zone”

PHYSICAL ASSESSMENT – LET’S TALK HABITAT… Some critters aren’t suited for certain situations and know when to get out!

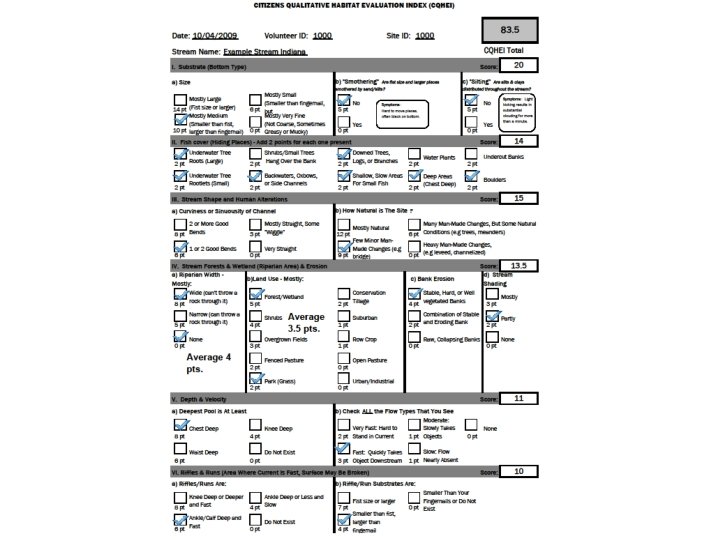
CITIZENS QUALITATIVE HABITAT EVALUATION INDEX • The following all contribute to habitat and combine to give a final score: Substrate Fish Cover Stream shape and human alterations Riparian area and local land use Depth/Velocity Riffles/Runs

HABITAT EVALUATIONS

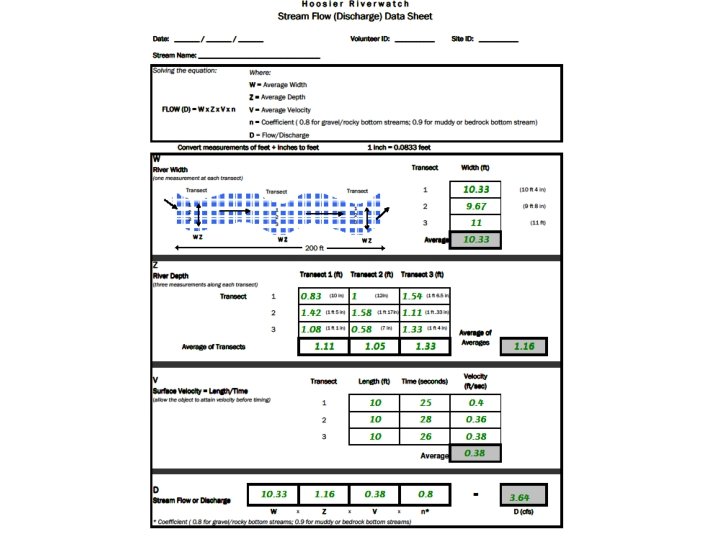
THE ROLE OF FLOW… • Helps provide clues to interpret water quality data • Channelization • Amount of impervious surfaces • Affect on pollutant loads & erosion • If pollutant increases in high flow, then guess NPS because concentration increases with runoff • If pollutant decreases with high flow, then guess PS because it is being diluted

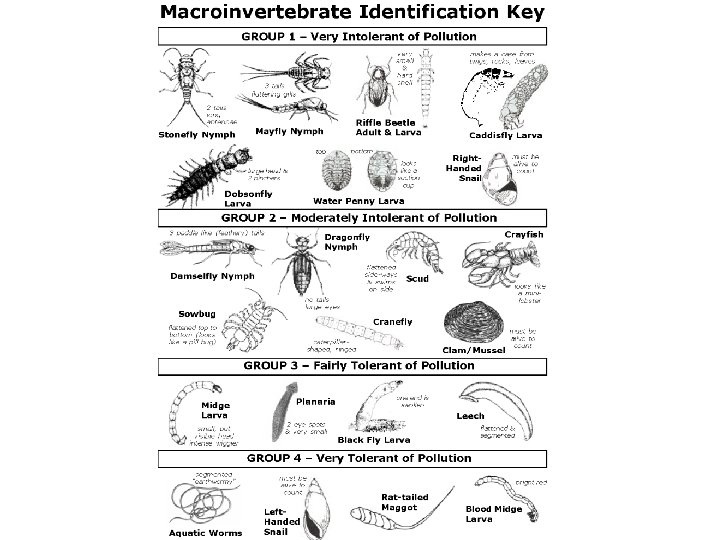
BIOLOGICAL ASSESSMENT BENTHIC MACROINVERTEBRATES: WHY DO WE MONITOR THEM? • Chemistry – just a snapshot in time • Macroinvertebrates: • Not very mobile Spend extended period in the water Have different levels of tolerance to pollution Macroinvertebrates provide idea of water quality over extended period of time

5 W’S OF WATER QUALITY MONITORING

5 W’S • Why • What • Where • When • Who

WHY WE MONITOR • Identify pollutants and sources • Establish baseline data • Document changes and trends • Measure effectiveness • Inform stakeholders • Assess use attainment • Provide information and data to support modeling • Characterize watershed

MONITORING CHALLENGES • Failure to evaluate data regularly • Lack of collateral information • Poor institutional integration • No planned study design

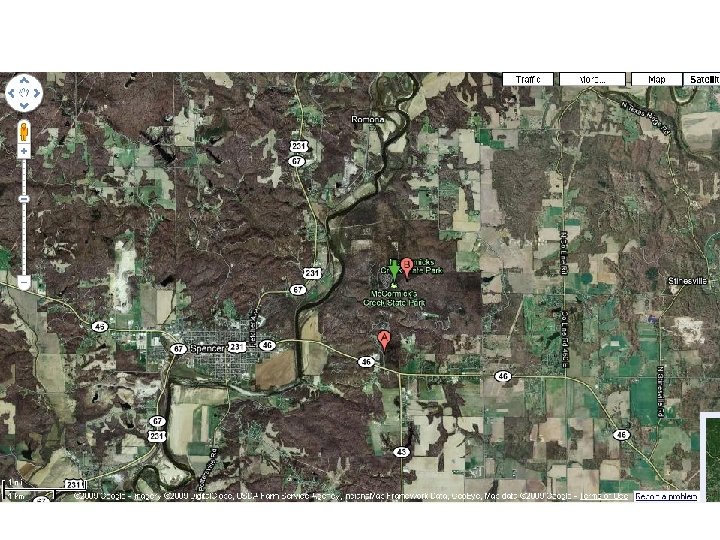
WATERSHED INVENTORY • • Research Maps and Aerial Photos Reports & Surveys Field Inventory What are the Land Uses? In-stream Conditions Color Odor Appearance

WHAT WE MONITOR • • Determine sampling goals/objectives Environmental Community Educational What chemical and/or field samples are taken depends on objective and budget If interested in algae blooms; sample for nutrients and collect representative algae samples for id

WHERE TO MONITOR? • • Based on sampling goals/objectives Upstream / downstream At bottom of watershed Multiple sites Physical location • Safety • distance/convenience and access/property rights roadside parking, rocky inclines, high flow conditions, bacteria consideration Best habitat available should be characteristic of stream reach, yet should aim to ‘level the playing field’ between sites

WHEN TO MONITOR • Based on sampling goals/objectives • Before and After • Monitoring before and after a large rain Useful for determining types of pollutants washed into stream after rain and reveal changes that occurs as result of new land use Change Over Time Monitoring the same site twice each year for period of 5 years Useful in identifying trends and picking up unusual situations
 • Federal Agencies • Universities EPA • Counties USGS")
WHO MONITORS (OTHER DATA SOURCES) • Federal Agencies • Universities EPA • Counties USGS • Municipalities Forest Service • Tribes NOAA • Regulated Communities Fish and Wildlife • Advocacy Organization • States IDEM DNR Health Department Drinking Water Agencies Nature Conservancy • Sporting Organizations • Watershed Organizations • Schools, 4 -H

UPPER WHITE RIVER WATERSHED

WHY WORK WITH VOLUNTEER MONITORS • Source of credible data • More comprehensive data • Greater monitoring frequency • Larger # of sites monitored • Local knowledge • Enhances local stewardship • Gain support for your efforts • Cost effective (not cost free)

CHARACTERISTICS OF SUCCESSFUL VOLUNTEER MONITORING PROGRAMS • Well-organized • Sound scientific basis • Report results • Strong institutional support • Make a difference

QUALITY ASSURANCE/QUALITY CONTROL • Quality Assurance is a broad plan for maintaining quality in all aspects of a program • Quality Control methods are established to control errors Follow protocol Repeated Measurements Modified from a presentation given by Linda Green, Rhode Island Watershed Watch

ACTIVITY

X • Place x on high and low points HW • Place arrow pointing in direction of flow • Mark waterfall • Label CON MR FALLS DR X Headwater Confluence Midriver Falls Downriver

LOOK AT YOUR SITE

GROUPS • Headwaters • Confluence • Midriver • Falls • Downriver

HEADWATERS

HEADWATERS

GROUPS • Seasons January – Blue April – Green July – Yellow October - Orange

JANUARY

JANUARY

SUMMARY

UPCOMING WORKSHOPS • www. dnr. in. gov/nrec • Healthy Water Healthy People • March 4, Ft. Harrison SP Indianapolis, IN Hoosier Riverwatch April 9, Indianapolis and South Bend April 16, Jasper and Lake County April 23, Gene Stratton Porter April 30, Lake County

TAKE HOME THOUGHTS • Everything is connected • Use long-term thinking • Look for the big picture and relationships • Focus on object observations, not on blame • Consider how pre-existing and popular opinions inform decisions • Gather all the data that you can

QUESTIONS?
- Slides: 60