WATER HARVESTING Rabi H Mohtar Purdue University West

WATER HARVESTING Rabi H. Mohtar Purdue University West Lafayette, Indiana, USA

Dryland Agriculture of South Tunisia Southeastern Tunisia receive mean annual § rainfall less than 200 mm. Rainfed farming is supported mainly by the water harvesting techniques. If: rain < 250 mm irrigation is necessary for § crop production Problem is characterizing the existing WHS § and assess the impact of these systems on the rural communities

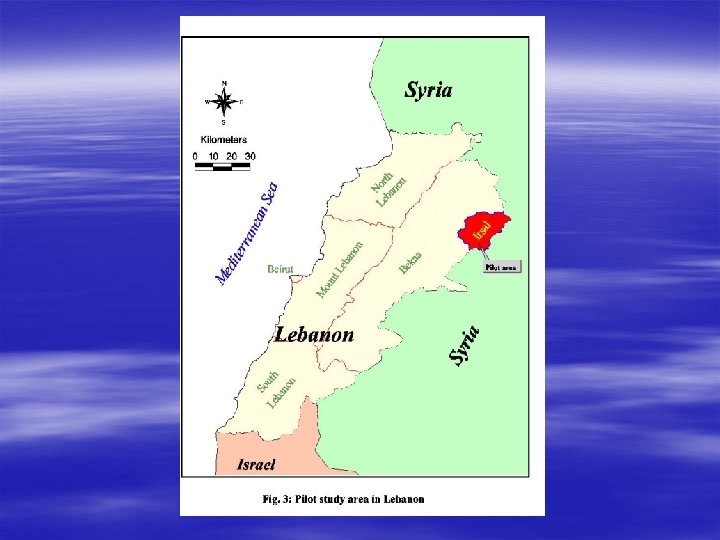
Water Harvesting in the Dry Upland Areas of Lebanon Rainfall less than 200 mm per year § Poor farming communities § Alternate crops such as cherries is being grown as § an economical crop but it requires additional water Problem is reservoir siting to provide supplemental § irrigation
 runoff water harvesting")
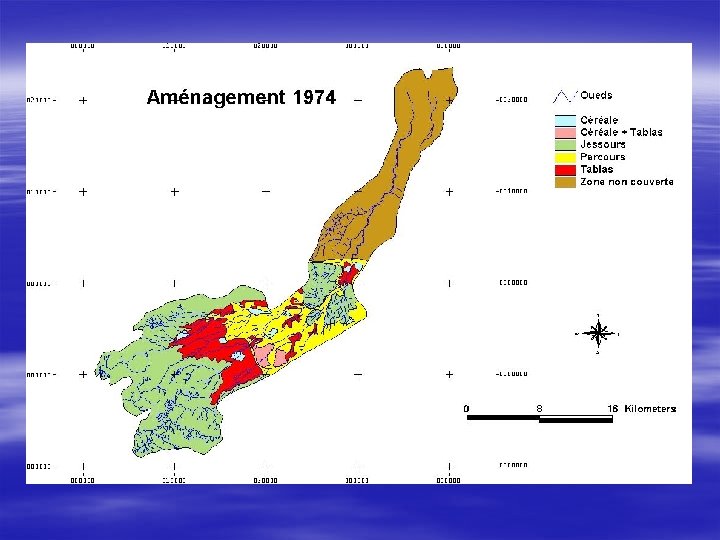
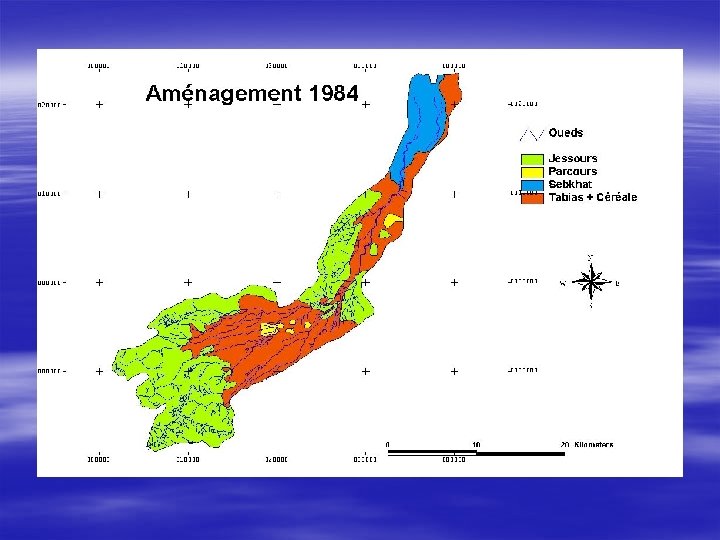
Water Harvesting Classification Water harvesting techniques are classified into: § 1) runoff water harvesting that makes use of runoff as it is collected, eliminating the storage requirement, like "jessour"; 2) floodwater harvesting and spreading or spate irrigation with diversion dikes called "mgoud"; and 3) runoff water collection and storage in reservoirs of variable capacities for drinking, animal watering and irrigation purposes.

Jessours in the Matmata moutains. A hydraulic unit made of three components: the catchment area, the terrace and the dyke. The jessours are used to bank the runoff from the mountain chain.
 is a")
Tabias newly installed in the piemonts areas. The dyke (tabia, sed, katra) is a barrier destined to block the sediments and runoff waters. Its body is made of earth equipped with a central and/or lateral spillway and one or two abutments (ktef), assuring the evacuation of the excess water. It has a trapezoidal shape (length: 15 -50 m, width: 1 -4 m, height: 2 -5 m). The tabias are now widely used in the piedmont areas where the fruit trees (mainly olive and almond) groves are gaining larges areas at the expense of grazing lands.

Flood spreading constructions

Recharge well in combination with a small gabion check dam. small check dams or spreading structures for diverting runoff waters. In some cases, recharge wells are used also in combination with gabion units for aquifer recharge. Recharge well

Terraces for afforestation in Matmata. constructed on steep slopes. They are formed of small retaining walls made of rocks to slow down the flow of water and control erosion.

Feskia or Cisterns used for drinking and animal watering. a cistern is a hole dug in the ground with a gypsum or concrete coating to avoid vertical and lateral infiltration

Gabion structures We distinguish two groups: § Gabion with recharge well § Gabion without recharge well

Gabion with recharge well Based on the functioning of these structures, it is suggested to adapt the reservoir system, which exists already in the model. However, the parameters have to be modified: § RES_K (Hydraulic Conductivity of the reservoir bottom): Since the reservoir is meant for long term storage of water, RES_K is very low (varies between 0 mm/hr (Min) et 1 mm/hr (Max) ). However, our structures have an opposite role, to enhance the infiltration of water into the soil and the aquifers. So, the permeability has to be largely higher than 1 mm/hr.

§ Changing the lower limits Reservoir Gabion Volume of water needed to fill the reservoir 15. 104 m 3 -. . . Volume: 0 - 2000 m 3 Initial reservoir volume V. Init. : 0 m 3 10. 104 m 3 -. . Initial sediment concentration 1 mg/l - … Sedimedents: 0 mg/l (dry sate) § Monthly outflow data (lachures, pompage…): The data is presented in the form of a table of two rows and 12 columns (Min and Max daily outflow data for the month)…. For the gabion, it is suggested to establish a direct relationships with the rainfall Resv = f(pluie). That is when there is sufficient rainfall the reservoir will be full and the water should be infiltrated and/or evaporated within few days (1 to 4 days).

§ The number of gabion units to be inserted The Reservoir system limits the number to one unit by sub basin However and for our case, these units are normally installed along the river beds with variable spacing (minimum 200 m). = Multiplying the number of units § Structures dimension The dimensions are variables Use average values.

Gabion unit structure

§ Functioning mode The units are installed in a gradoni form along the river (wadi). The outflow passes to the unit downstream …. Depending on the rainfall shower (intensity, volume, spatial coverage), one to many units will be considered. Oued 1 4 Rainfall Flow direction 1 2 3 4

Gabion without recharge well § The same remarks are to be taken into consideration with only one parameter: The hydraulic conductivity is much lower. For example, the average hydraulic conductivity at oued Hallouf gabion unit is 180 mm/hr.

Jessours § These structures are encountered in the mountains. They could be inserted as points (X, Y, "Z") (table dbf) The average infiltration rate of the jesser of Amrich is 120 mm/hr). Digue en terre Jesr déversoirs (menfess)

Tabias The tabias are techniques encountered in piedmont and flat areas. § They are supplied in two ways: 1. Direct interception of runoff 2. Flood spreading

Tabias: Direct interception Direction d'écoulement The system is supplied directly from the adjacent impluvium. Canal d'évacuation au niveau du sol Bassin de retenu Banquette latérale Direction d'écoulement Banquette principle Evacuation des trop-pleins par seuil en pierres Direction d'écoulement

Tabias: Flood spreading Légende: 1 Oued hallouf 2 affluent de l'oued hallouf 3 canal central des oueds 4 banquette de diversion 5 sens de l'écoulement dévié 6 tabias plantées d'oliviers 7 canaux d'arrivée d'eau (mgoud) 8 déversoirs principaux 9 déversoirs secondaires The system is located next to a wadi and the flood is directed via a diversion dike (mgoud). Note: When the diversion dike is made of earth it acts as fusible; it breaks down when the flood is violent to prevent damages on the cultivated lands. 2 1 3 4 7 5 9 8 8 6 7 5 9 6 8 8 7 9 8 8 Tabias on Oued Hallouf

GIS Database Satellite Imagery Topography Soil Permeability Land Cover DEM Precipitation Subwatersheds / Streamnetwork AHP RSI / Potential Site Ranking WMS Potential Runoff Fig. 1: General flow chart of the developed methodology.

Level 1 Level 2 Level 3 Level 4 Goal Major Decision Criteria Sub-Criteria Attribute Classes high medium low Potential Surface Runoff Potential Storage RSI Topographic Characteristics high medium low Soil Characteristics favorable unfavorable high Land Cover Fig. 2: Decision Hierarchy Structure. medium low


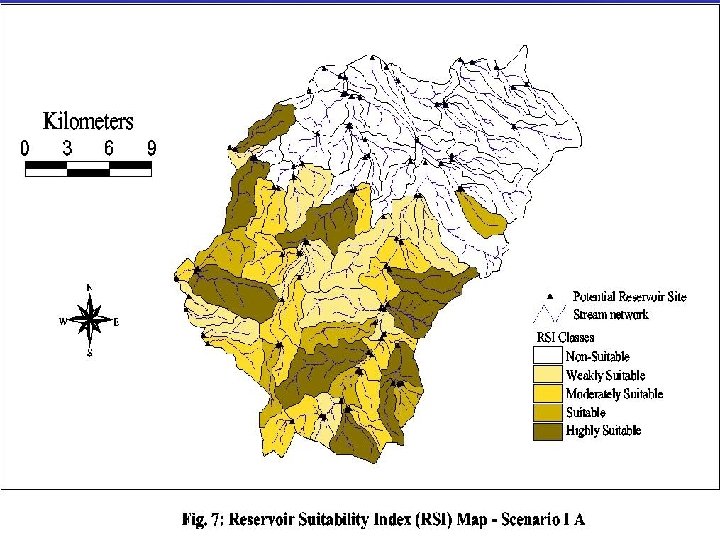
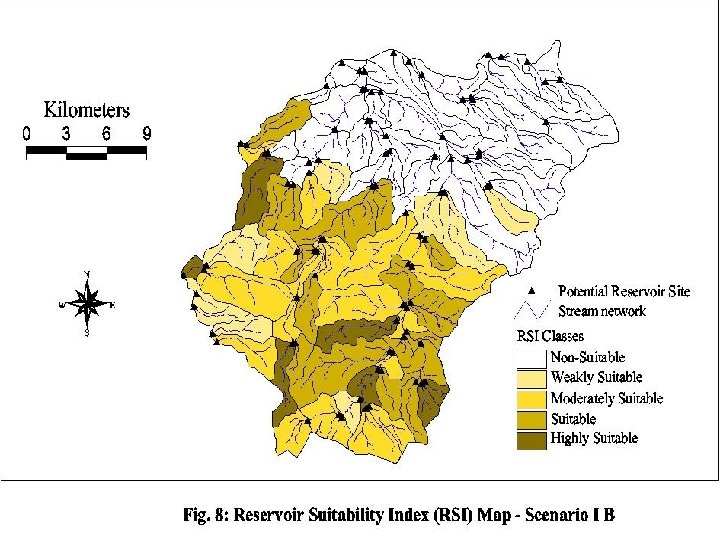
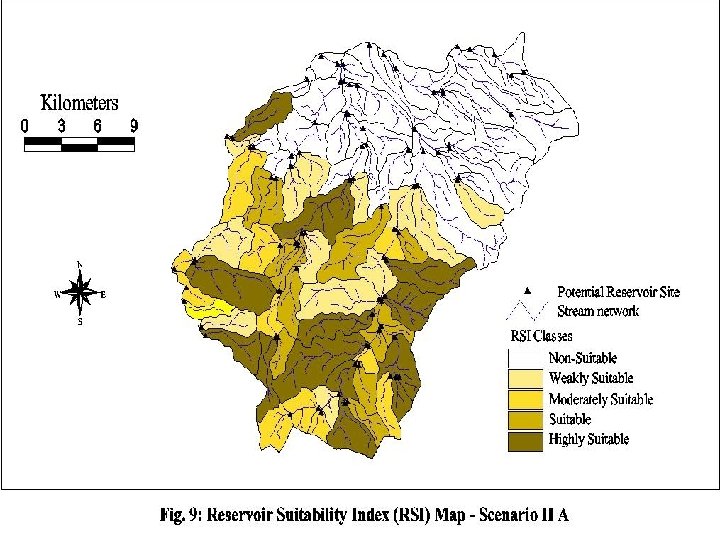
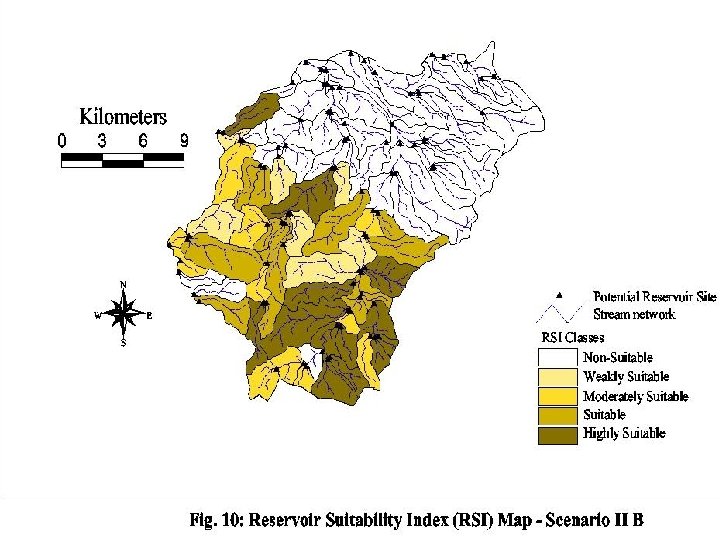
Scenario I - Potential Storage; high RW - Land cover; low RW SCENARIOS Scenario II - Land Cover; high RW - Potential Storage; low RW Sub-scenario I-A - Potential Surf. Runoff; high RW - Topography ; low RW Sub-scenario I-B - Topography ; high RW - Potential Surf. Runoff; low RW Sub-scenario II-A - Potential Surf. Runoff; high RW - Topography ; low RW Sub-scenario II-B - Topography ; high RW - Potential Surf. Runoff; low RW Fig. 6: Main scenarios and sub-scenarios of the study

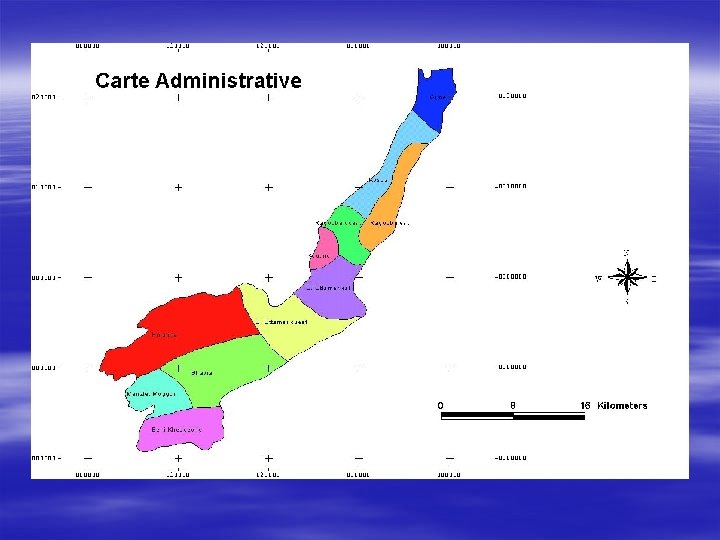
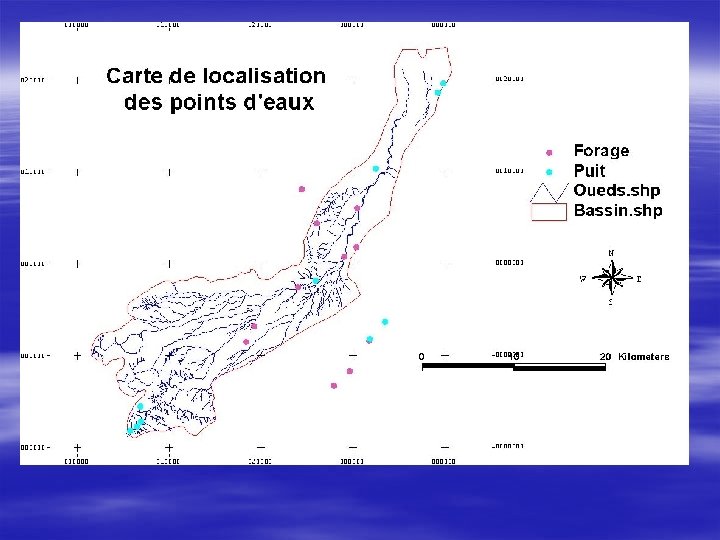
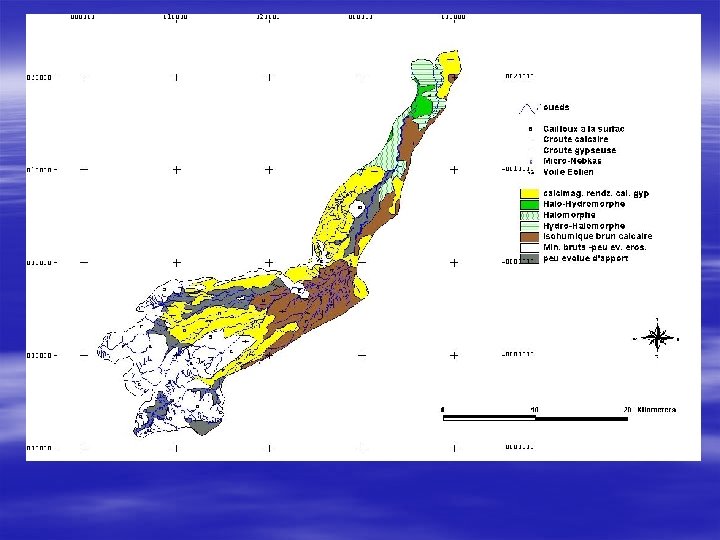
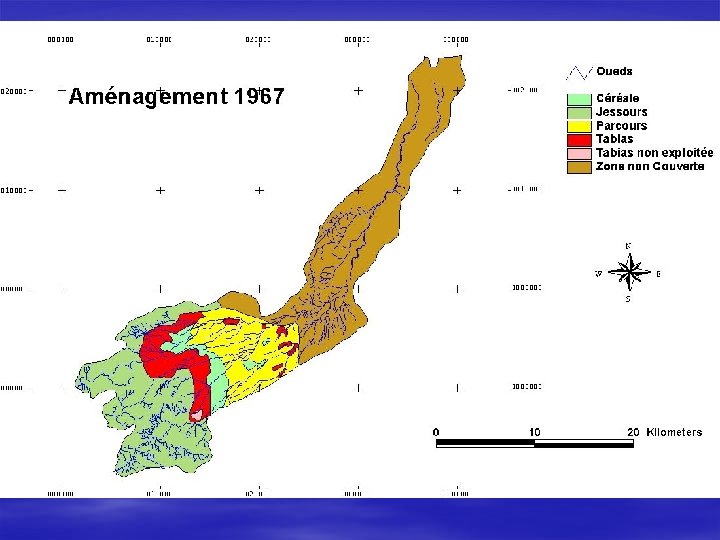
Waterhsed of Oued Oum Zessar South Tunisia
 Oum Zessar 367 348, 46 Annual rainfall (mm) 180 Mean")
Charactersitics Area (km 2) Oum Zessar 367 348, 46 Annual rainfall (mm) 180 Mean annual temperature (°C) 20 Altitude (m) 0 -690 Population (inhabitants) 24188 N

Applications of SWAT to the watershed of Oum Zessar
 § DEM Mask (Watershed of")
Required Arc. View themes § Elevation map Grid (DEM) § DEM Mask (Watershed of oum Zessar) § Land use map Grid § Soil map Grid § Weather (temperature, precipitation, Solar Radiation, Wind Speed, and Relative Humidity) Weather Generator if not available

Delineate watershed and subbasins

DEM grid

Mask grid = Watershed of oued oum Zessar

Subbasin delineation

Reservoirs are added to the watershed

Landuse definition

Soil theme

Load weather data: - Rainfall data - Temperature data - Weather simulation data (US data base)

SIMULATION View Results

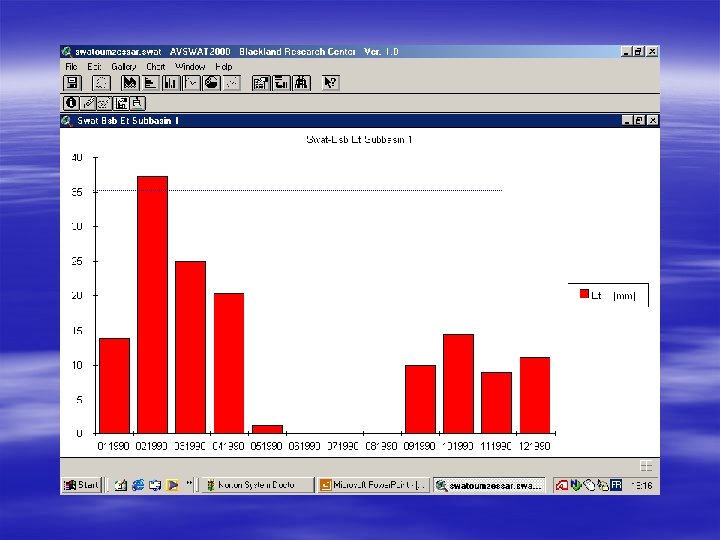
To graph and map results, we click Map-chart and we select the subbasin, variables and the times (months) …

SUBBASIN OUTPUT Watershed of Oued Oum Zessar
")
Evapotranspiration (mm)
")
Potential Evapotranspiration (mm)
")
Soil water content (mm)
")
Sediment yield (t/ha)
")
Water yield (mm)
")
Surface Runoff contribution to streamflow (mm)

Water that percolates past the zone

SUBBASIN OUTPUT Subbasins 1, 9 and 20

SWAT 1 9 20
- Slides: 64