Warmup What should you do if you see


- Slides: 28
Warm-up What should you do if you see a fire in the lab?
Unit 1 a: The scientific method Or, never say, “I have a theory!”
The scientific method Pattern of logical investigation involving stating a problem, forming a hypothesis, researching and gathering information, testing a hypothesis, analyzing data, drawing conclusions. A way of thinking Not restricted to science Can’t use the scientific method for everything
hypothesis A testable, possible explanation for a problem using what is known and what is observed. An untestable hypothesis = a BAD hypothesis Example: “I think this electronic box on the wall controls the room temperature”
Good or Bad hypothesis? Love is the most important thing in the universe. Love is claimed by most people to be the most important thing in the universe. Chocolate is the best tasting substance in the world. People exposed to chocolate in their culture are more likely to enjoy it. Bananas outperform Gatorade as a recovery food/drink after a marathon. Before the universe existed, there was a giant walrus whose consciousness was the only thing that existed.
experiment Organized procedure for testing a hypothesis; tests the effect of one thing on another under controlled conditions
variable Quantity that can have more one value. Can change in an experiment. Examples: thermostat settings, room temperature, humidity, etc. OFF 65° 85°
Dependent variable Factor that changes as a result of changes in other variables Example: room 72° the temperature of the
Independent variable Factor that, as it changes, affects the measure of another variable Usually what you manipulate Example: thermostat setting
Graphing variables Use “DRY MIX” to remember M: Manipulated R: Responds I: Independent Y: Y-axis X: X-axis Actual temperature D: Dependent Set temperature
constant In an experiment, the variable that does not change Example: humidity, size of room. Size of AC unit. Room 1 Room 2
control Standard used for comparison of test results in an experiment. Example: Room 1 room with no thermostat. Room 2
bias Occurs when a scientist’s expectations change how the results of an experiment are measured or viewed. Example: scientist subconsciously ignores or exaggerates data
model Used to represent an idea object, or event that is too big, too small, too complex, or too dangerous to observe or test directly. Example: a circuit diagram of thermostat or a computer simulation of a thermostat controlling the temp.
Scientific theory Explanation of things or events based on knowledge gained from many observations, investigations, and experiments. A theory is NOT a hunch!!! Explains the how or the why.
Scientific law Statement about what happens in nature that seems to be always true under certain conditions; does not explain why or how something happens. Examples: the law of gravity versus theory of gravity.
Theories Laws DO NOT become laws! are not “better” than theories
How to make your data speak, and how to read it
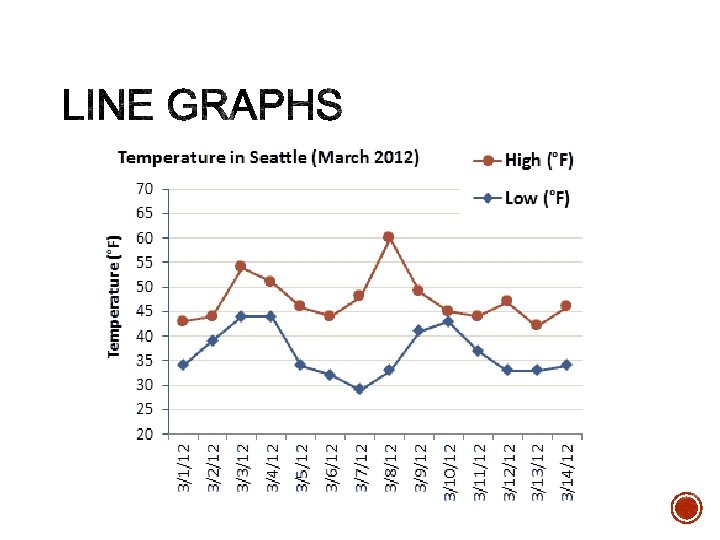
Remember “DRY MIX”: X-axis: maniupulated, independent Y-axis: responding, dependent, what is measured
§ Data points are connected by lines § Used for many data points of continuous data (often time) on the x-axis
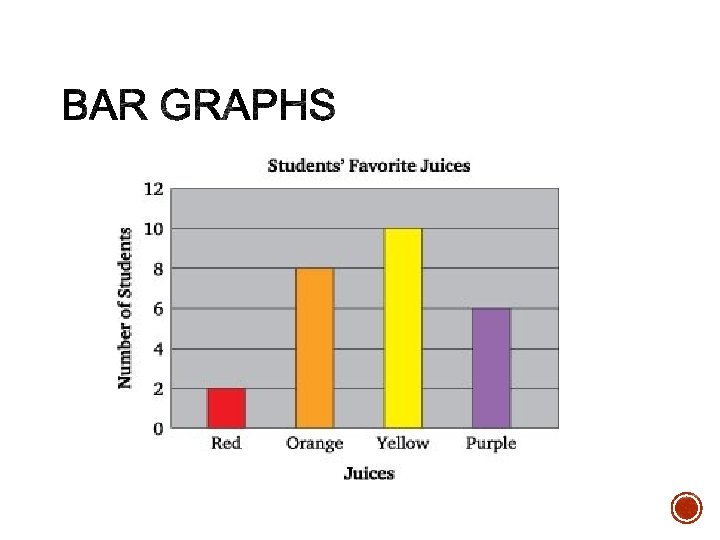
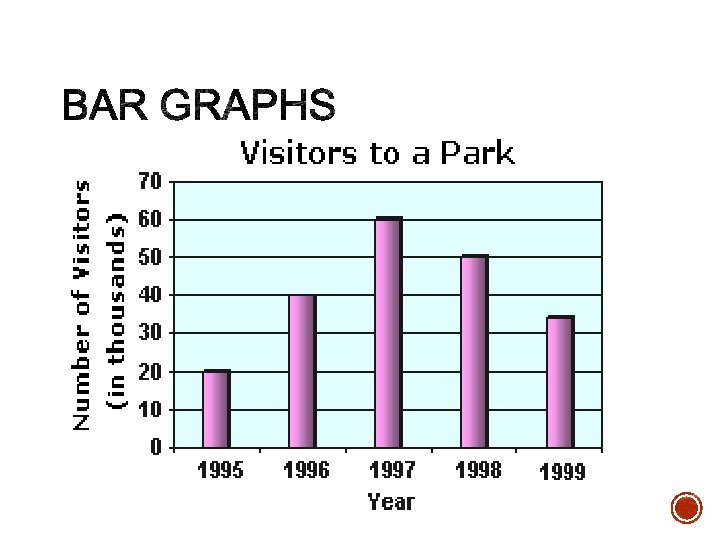
§ data point magnitude on y-axis represented as vertical bar/line § Used for plotting non-continuous data, or continuous data with few data points, on x-axis, such as ice cream flavors, brands of shoes, color of light, seasons of year § Sometimes a bar graph or a line graph could be used to represent the same data
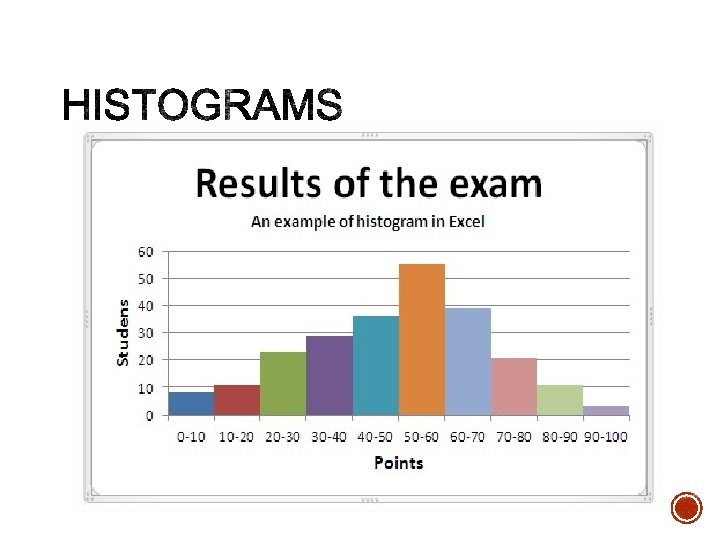
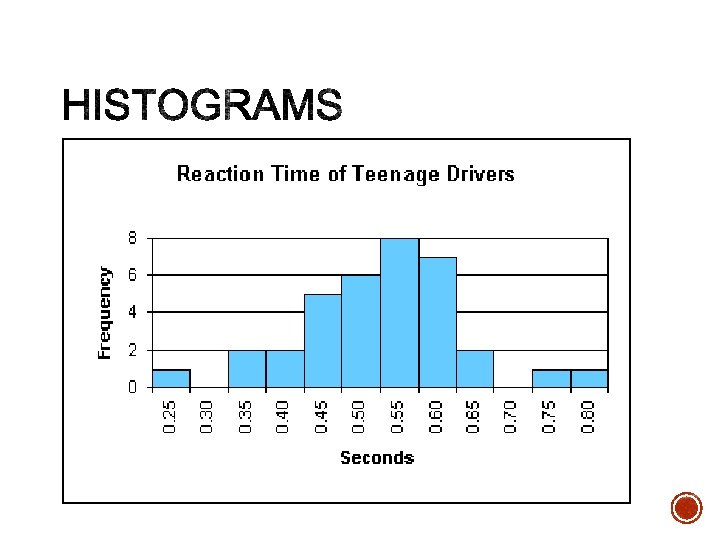
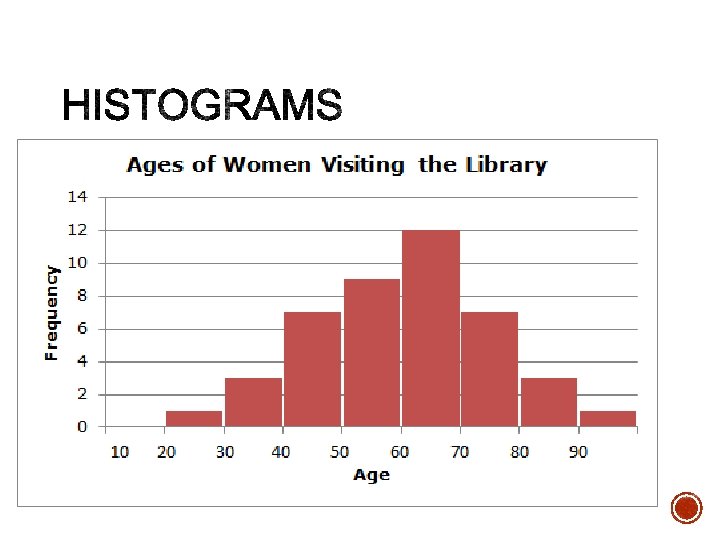
§ special line/bar graphs where y-axis represents the frequency of a measure (how common something is) § Frequency can be represented as number, fraction, percentage, proportion § Usually dependent variable values are put on the y-axis, but here the frequency of values (or a range of values) is placed on the y-axis. [“DRY MIX “does NOT apply] § Typically there is no space between the bars § Examples: IQ chart, height of people in population, grades on an exam, lifespan, “bell curve”