Warmup Instructions Write the question Write your reply


 should be on the xaxis and the temperature (the")


- Slides: 16
Warm-up Instructions: Write the question. Write your reply right below it. Be sure to write in complete sentences. This is science and communication is EXTREMELY important! Question: Did you find the graphing packet challenging or easy? Please explain your answer.
Objectives • Review Theory vs Law • Graphing!
Theories • A THEORY is an explanation based on the results of many investigations • Examples of theories: Atomic Theory Cell Theory A theory can be Newton’s Theory of Gravitation disproved, or can Big Bang Theory change, but a theory is NOT just a guess
• A LAW is a statement about what will happen under certain conditions – from observations! – A law does not explain why or how – A theory can explain a law Examples of laws: "why" Newton’s Laws of "how" Motion
Graphing! Power. Point from Mr. Baker
Objectives • Review Theory vs Law • Graphing!
Graphs • A GRAPH is a visual display of information or data • The most common types are line, bar, and circle (or pie)
Line Graphs • Line graphs show a relationship where the dependent variable changes due to a change in the independent variable • Use the x-axis for the independent variable and the y-axis for the dependent variable
The date (the independent variable) should be on the xaxis and the temperature (the dependent variable) should be on the yaxis Patient temperature Date Temperature (C) 9/1 39. 7 9/2 40. 0 9/3 38. 4 9/4 39. 3 9/5 39. 4 9/6 38. 4 9/7 37. 5 9/8 37. 3
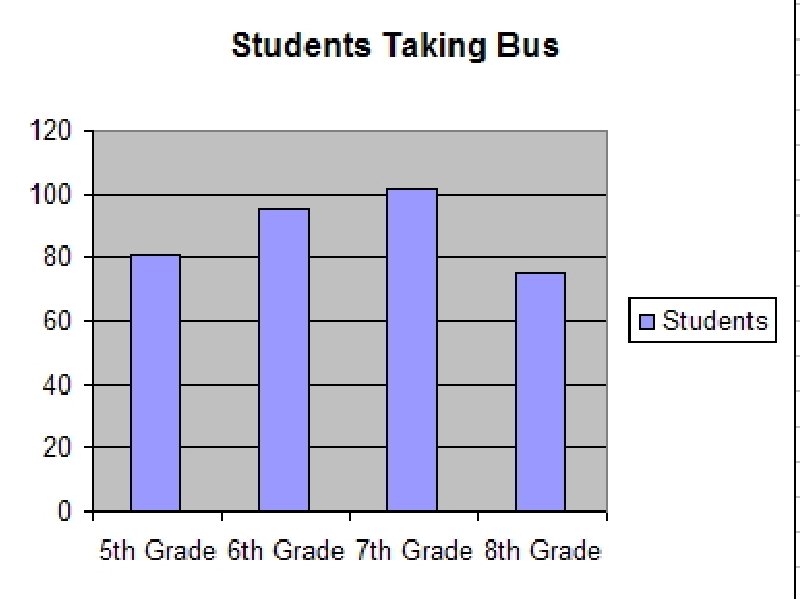
Bar Graphs • A bar graph is used to compare information collected by counting • Each bar represents a quantity counted • The independent variable is on the x-axis and the dependent variable is on the y-axis
Students that take the bus to school • In your notes, make a bar graph representing the chart Grade # Students 5 80 6 95 7 103 8 77
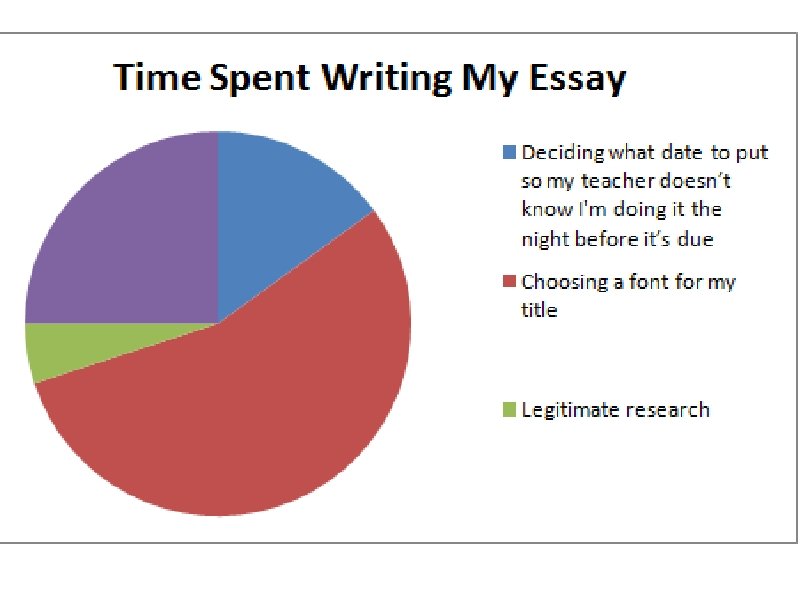
Circle Graphs • A circle graph shows how a whole amount is broken down into parts • The parts are usually shown as percentages
In your notes, make a circle graph representing the chart now. Just sketch it as best you can. Time spent writing essays Activity Percent Copying and pasting from wikipedia 25 Legitimate research 5 Deciding what date to put so my teacher doesn’t know I'm doing it the night before it’s due 15 Choosing a font for my title 55