WARM UP GPA Eye Color Blue Brown Hazel

WARM – UP GPA Eye Color Blue Brown Hazel 3 or below 14. 0% 129 61. 0% 561 25. 0% 230 920 4+ 13. 5% 73 60. 8% 330 25. 7% 139 542 1. Determine if an association exists between ones eye color and ones GPA at a large school. Justify your answer by examining the conditional distribution of eye color among the two levels of GPA. Since the Distribution of eye color is relatively the same for each GPA level, eye color had little to do with your GPA. (No Association = Independent variables)

A B ≤C 3 rd Perioid 4 th Period 5 th Period 22 64. 7% 8 23. 5% 4 11. 8% 20 69. 0% 5 17. 2% 4 13. 8% 22 66. 7% 8 24. 2% 3 9. 1%
 students were asked their SAT Math scores: 600, 650,")
Warm – Up 2016 (12) students were asked their SAT Math scores: 600, 650, 505, 520, 800, 480, 740, 540, 630, 590, 400, 550 Construct And Describe the Histogram : 4 3 2 1 0 FREQUENCY 5 HI! I’m SKEWED. …RIGHT? 400 480 560 640 720 S. A. T. MATH SCORES 800 880

Hey! I’m Approximately SYMMETRIC. 4 3 2 1 1 2 3 4 FREQUENCY 5 HI! I’m SKEWED to the LEFT 0 0 FREQUENCY 5 Warm – Up - 2016 COMPARE these two distributions: 400 480 560 640 720 800 880 S. A. T. MATH SCORES 300 380 460 540 620 700 780 S. A. T. VERBAL SCORES SAT Math scores have a higher center than Verbal scores. They both have equal spread. Center: Unusualness Spread: MATH 700 > Nothing 480 = VERBAL 600 Nothing 480
 Independence vs. Association of Categorical Variables If two variables are independent")
Ch. 3 (continued) Independence vs. Association of Categorical Variables If two variables are independent then one would expect to see relatively the same distribution on the first variable among all levels of the second variable.
 Does Gender have any influence on Color preference? 160 people were asked")
Ex. ) Does Gender have any influence on Color preference? 160 people were asked to choice a color among Blue, Green, and Red. The results are shown below: Blue Male 60 Female 20 80 Blue All 160 Blue Male 50% Green Red 20% 30% Green 24 8 32 Green 20% Red 36 12 48 120 40 160 Red 30% Blue Female 50% Green 20% Red 30% Gender did NOT matter = Independence = No Association!

EXAMPLE: Which gender favors Red more Males or Females? Male Female Red 84 13 Blue 616 87 Grades K - 5 Red Blue 700 12% 13% Grades 6 - 12 Male 65 500 565 Female 1 12 13 11. 5% 7. 7% Red Blue Male 19 116 Female 12 75 135 87 14. 1% 13. 8%

SIMPSON’S PARADOX Simpson’s Paradox refers to a reversal of the direction of a comparison or an association when data from several groups are combined to form a single group. (and vise versa) EXAMPLE: Hospital A Died 63 Survived 2037 2100 800 3% 2% Good Condition Hospital A Died 6 Survived 594 Hospital B 16 784 Given the patients were at a particular hospital, what % died? Poor Condition Hospital B 8 592 Hospital A Died 57 Survived 1443 Hospital B 8 192 600 1500 200 1% 1. 3% 3. 8% 4%

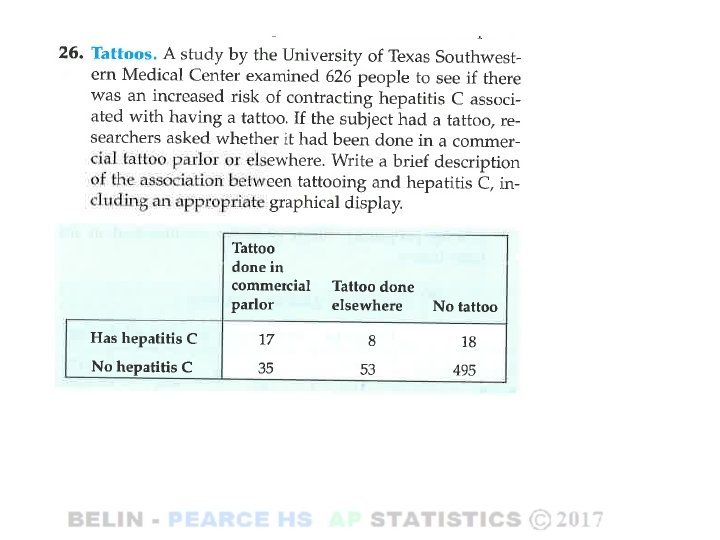
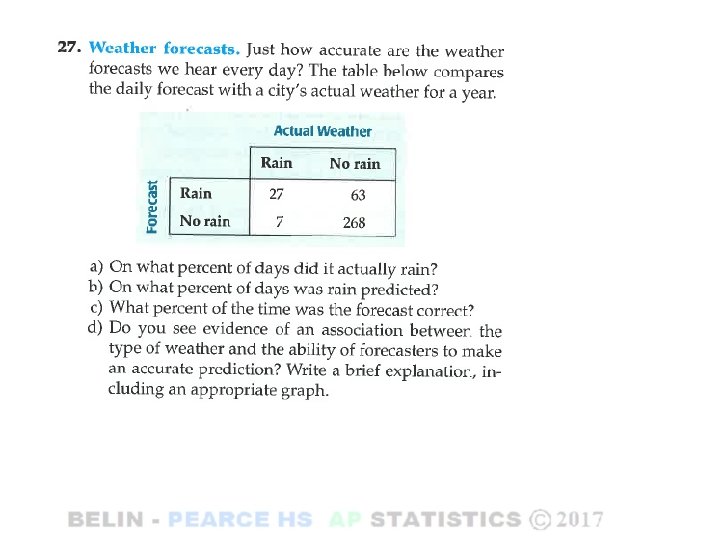
HW: Page 40: 26, 27, 31, 34, 38 3% 16% 2% 7% 28/500 = 5. 6% 30/500 =6% Simpson’s Paradox

Ex. 2 A concerned parent wants to send his child to a school with a great TAKS passing rate so that his child will succeed. What school should the parent consider? Jamestown HS Passed 1440 Failed 160 Springfield HS 1760 240 1600 2000 90% 88% Given the particular High schools, what % Passed TAKS? What are some ways that you can divide up the population? Regular Students Passed Failed AP Students Jamestown 1056 144 Springfield 810 90 Jamestown Passed 340 Failed 60 1200 900 400 88% 90% 85% Springfield 950 1100 86%
- Slides: 12