WARM UP Bill Gates makes 500 million a

WARM UP Bill Gates makes $500 million a year. He’s in a room with 9 teachers, 4 of whom make $40 k, 3 make $45 k, and 2 make $55 k a year. 1. What is the mean salary of everyone in the room? 2. What would be the mean salary if Gates wasn’t included? 3. Compare and contrast the mean with and without Gates. Make sure to include the word skew. Mean With Gates: Mean Without Gates: $50, 040, 500 $45, 000 BBA 308 Data Development & Analysis

STAT GAME PLAN Trigonometry California Standard Date 2/20/13 W 8. 0 Students organize and describe distributions of data by using …box-andwhisker plots. Goal Students will learn about box and whisker Section / Topic 1. 4 c Boxplots, Outliers plots Homework p 34 -45 (7 -11, 17 -22) Announcement 14/2021 /14/2021 Tutoring in Room 308 with Mr Aviles Quiz 1. 4 -1. 6 on Tuesday 2/26

Drawing a Box-and-Whisker Plot 1. Find the five-number summary of the data set. 2. Construct a horizontal scale that spans the range of the data. 3. Plot the five numbers above the horizontal scale. 4. Draw a box above the horizontal scale from Q 1 to Q 3 and draw a vertical line in the box at Q 2. 5. Draw whiskers from the box to the minimum and maximum entries. Box Whisker Minimum entry Maximum entry Q 1 Median, Q 2 Larson/Farber 4 th ed. Q 3 3

Distribution Shape Based on Boxplots: If the median is near the center of the box and each horizontal line is of approximately equal length, then the distribution is roughly symmetric If the median is to the left of the center of the box or the right line is substantially longer than the left line, then the distribution is skewed right If the median is to the right of the center of the box or the left line is substantially longer than the right line, then the distribution is skewed left

In a set of numbers, a number that is much LARGER or much SMALLER than the rest of the numbers is called an Outlier.

To accurately determine if a number is an outlier is must be: Outlier < Q 1 - 1. 5*IQR OR Outlier > Q 3+ 1. 5*IQR

- 12 3 7 9 + 12 12 14 15 17 18 20 IQR = 8 2 34 OUTLIER

You Do Together Consumer Reports did a study of ice cream bars in their August 2009 issue. Twenty-two bars were tested and their amount of calories recorded. 342 377 319 353 295 234 294 286 377 182 310 439 111 201 182 197 209 147 190 151 131 151 Construct a box plot for the amount of calories in the ice cream bars. Make sure to calculate values for each part of the 5 number summary as well as range, and IQR.

You Do Together - Answer Q 1 = 182 Min = 111 IQR = 137 Q 2 = 221. 5 Max = 439 Q 3 = 319 Range = 328 100 125 150 175 200 225 250 275 300 325 350 375 400 425 450 475 500 Calories

You Do The weights of 20 randomly selected juniors at BGHS are recorded below: 121 126 130 132 143 137 141 144 148 205 128 131 133 135 139 141 147 153 213 Construct a boxplot of the data. Make sure to calculate values for each part of the 5 number summary as well as range, and IQR. Identify any outliers.

You Do- Answer Q 1 = 130. 5 Q 2 = 138 Min = 121 Max = 213 IQR = 15 Outliers < Q 1 - 1. 5*IQR < 130. 5 -1. 5*15=108 Q 3 = 145. 5 Range = 92 Outliers> Q 3+ 1. 5*IQR >145. 5+(1. 5)(15)=168 205 and 213 are outliers * * 100 110 120 130 140 150 160 170 180 190 200 210 220 230 240 250 260 Weight

You Do The following are the scores of 12 members of a woman’s golf team in tournament play: 89 90 87 95 86 81 111 108 83 88 91 79 a) Construct a boxplot of the data. b) Find the mean. c) Are there any outliers? d) Based on the mean and median describe the distribution.

You Do- Answer Q 1 = 84. 5 Min = 79 IQR = 18. 5 Q 2 = 88. 5 Max = 111 There are no outliers Q 3 = 93 Range = 32 Golf Scores 78 81 84 87 90 93 96 99 102 105 108 111 114 117 120 123 126 Mean= 90. 67 Distribution appears to be skewed right (mean > median and long whisker)

Think-Write-Pair-Share Comparative Boxplots The scores of 18 first year college women on the Survey of Study Habits and Attitudes (this psychological test measures motivation, study habits and attitudes toward school). The college also administered the test to 20 first-year college men. Compare the two boxplots on the following slide. Are there any noticeable differences or similarities between the two groups?

Think-Write-Pair-Share Comparing Men and Women Study Habits and Attitudes Women 60 70 80 90 100 110 120 130 140 150 160 170 180 190 200 210 220 Men POSSIBLE ANSWERS: Women’s median is greater and they have less variability (spread) in their scores; the women’s distribution is more symmetric while the men’s is skewed right.

EXAMPLE • Based on a sample of 20 deliveries, Marco’s Pizza determined the following information: minimum value = 13 minutes, Q 1 = 15 minutes, median = 18 minutes, Q 3 = 22 minutes, maximum value = 30 minutes. Develop a box & whiskers plot for the delivery times. • • • median min 12 Q 1 14 Q 3 16 BBA 308 Data Development & Analysis 18 20 22 max 24 26 28 30 32

Example: Boxplot of Movie Budget Amounts Directions: Find the 5 number summary for the boxplot below BBA 308 Data Development & Analysis

EXAMPLE Are there any outliers in the above data?

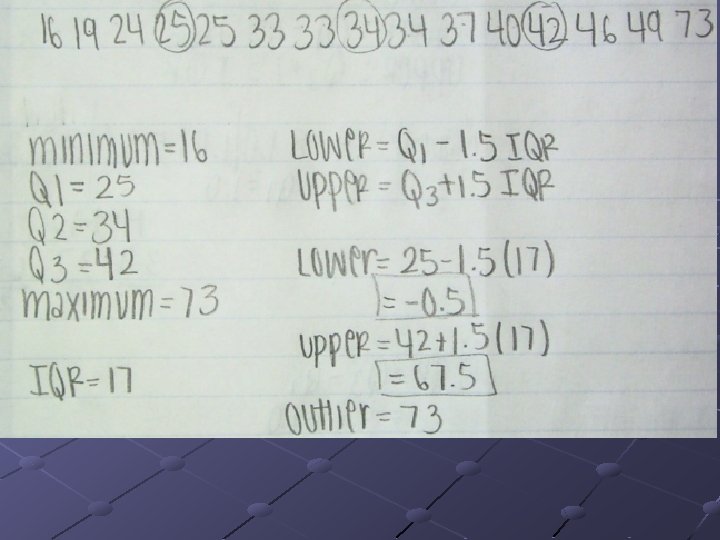
EXAMPLE 6 A The following is the list of Barry Bond's home run totals for each season of his career through his record breaking season. 16 19 24 25 25 33 33 34 34 37 40 42 46 49 73 Find the 5 Number summary. Did he have any outliers? How do you know for sure?

EXAMPLE 6 B 7 Are there still outliers?

The following data represents the amount of texts sent by 8 students in Mr. Eng’s 2 nd period class. 2 3 6 9 13 18 21 106 Are there any outliers in the data set above?
- Slides: 22