WALT Interpret pictograms Starter 1 567 234 2


- Slides: 11
WALT- Interpret pictograms
Starter 1. 567 – 234 = 2. 345 + 231 = 3. 567 – 239 = 4. 345 + 127 =
What is a pictogram? A pictogram is a chart that uses pictures to represent data. Pictograms are set out in the same way as bar charts, but instead of bars they use columns of pictures to show the numbers involved. Pictograms normally have a key or scale to say how many people the picture represents.
Pictograms have a key which tells us how many people the picture / shape represents. How many people would half a circle represent?
= 4 children How many people would half a circle represent now?
How many people would half a circle represent now?
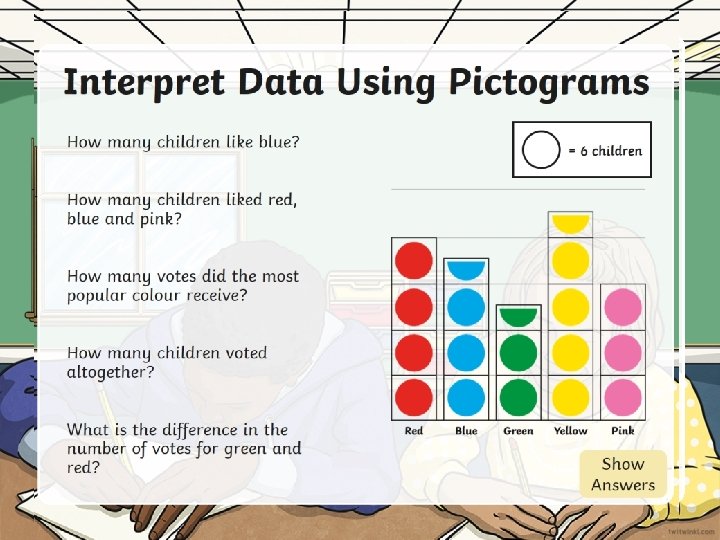
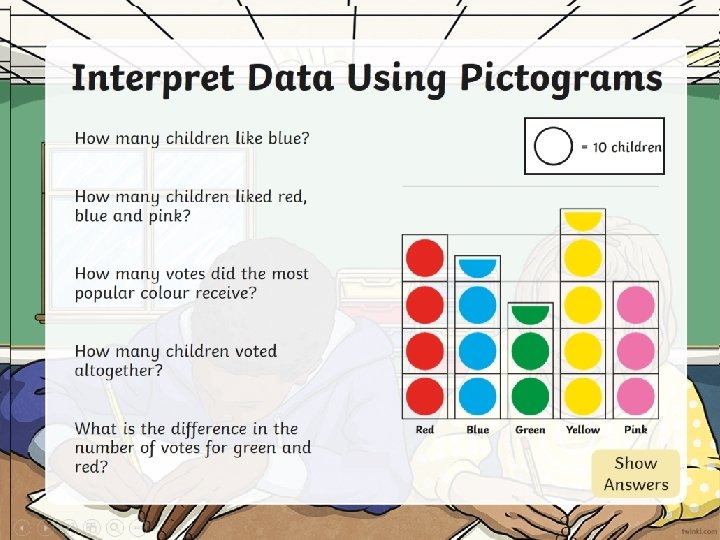
Interpret Data Using Pictograms How many children like blue? 7 = 2 children 21 How many children liked red, blue and pink? How many votes did the most popular colour receive? 9 35 How many children voted altogether? 3 What is the difference in the number of votes for green and red? Hide Show Answers
TASK Green -Answer questions on pictograms which have a scale of 1. Progress to scale of 2 if appropriate. Yellow- Answer questions on pictograms which have a scale of 2. Blue/ Red – As above then also answer questions about pictograms with larger and different scales.
Plenary Hannah says the most important thing about pictograms is the picture you use. Is she correct? Explain.