
Walnut Market Analysis Group member Jessica Tai Zoe
Walnut Market Analysis Group member: Jessica, Tai, Zoe, Roson
To Be Discussed �Background �Market Power �Price Factors �Regression Model �Case Studies
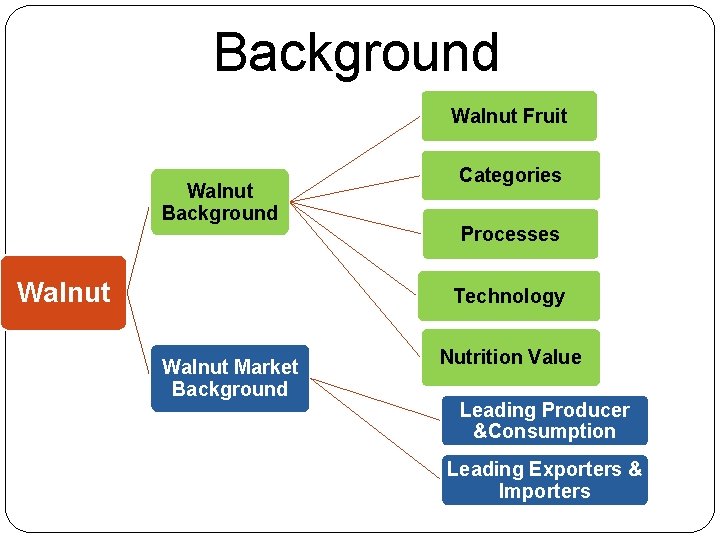
Background Walnut Fruit Walnut Background Walnut Categories Processes Technology Walnut Market Background Nutrition Value Leading Producer &Consumption Leading Exporters & Importers
Walnut Background
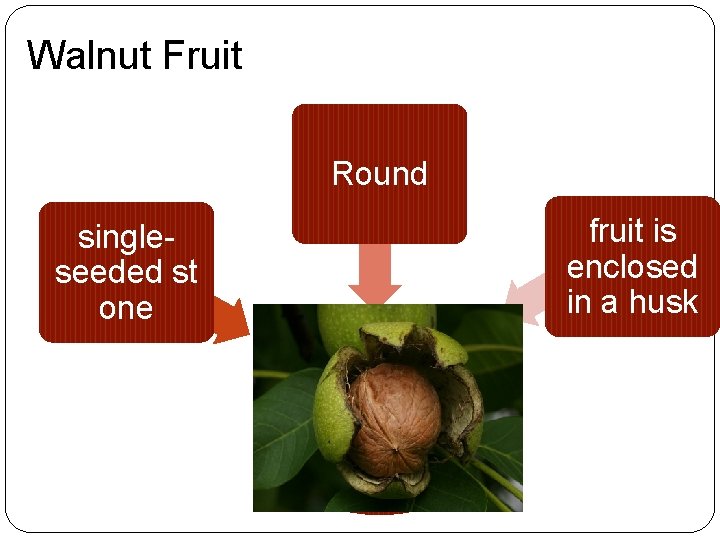
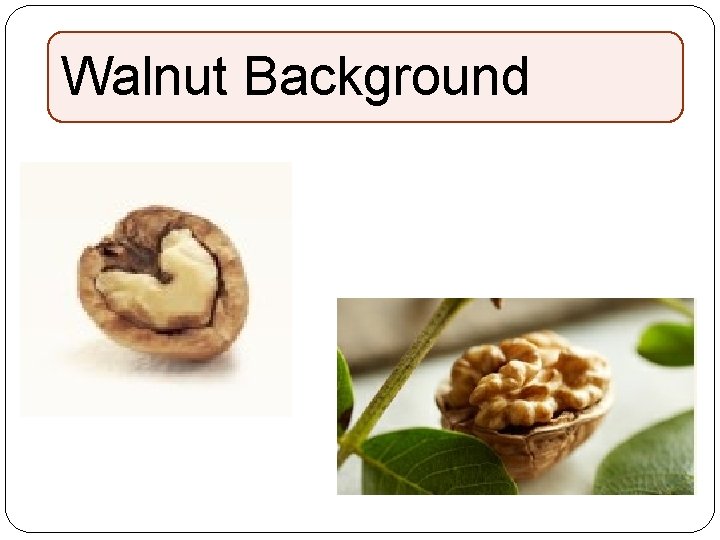
Walnut Fruit Round singleseeded st one fruit is enclosed in a husk
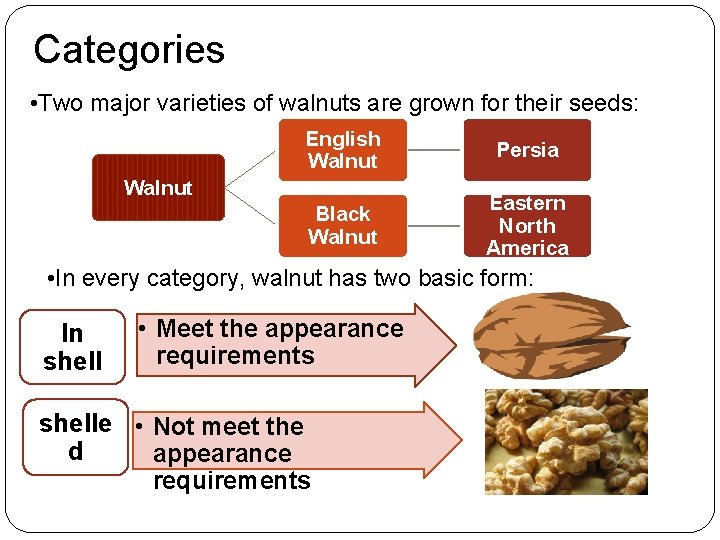
Categories • Two major varieties of walnuts are grown for their seeds: English Walnut Persia Black Walnut Eastern North America Walnut • In every category, walnut has two basic form: In shell • Meet the appearance requirements shelle • Not meet the d appearance requirements
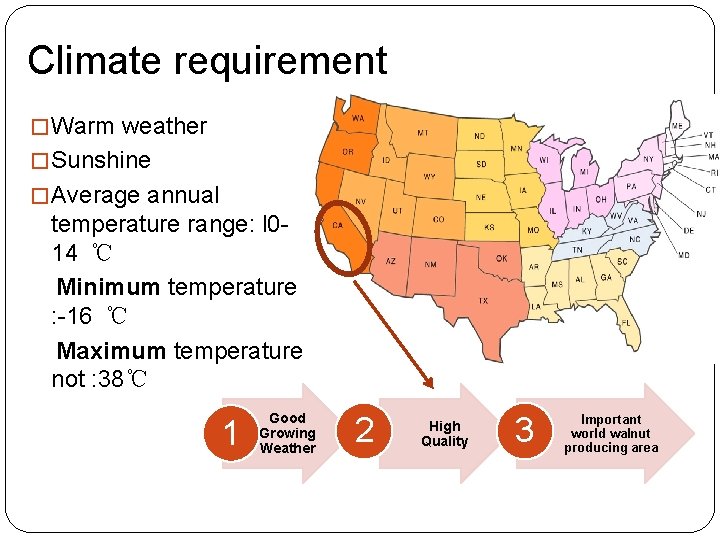
Climate requirement � Warm weather � Sunshine � Average annual temperature range: l 014 ℃ Minimum temperature : -16 ℃ Maximum temperature not : 38℃ 1 Good Growing Weather 2 High Quality 3 Important world walnut producing area
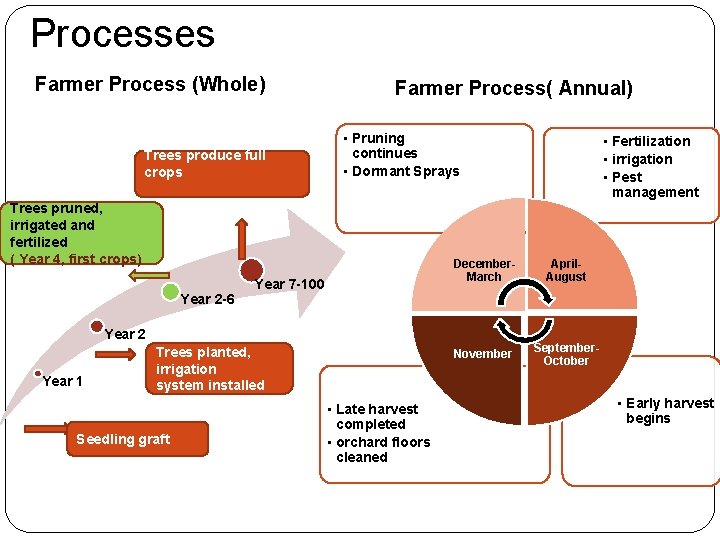
Processes Farmer Process (Whole) Trees produce full crops Farmer Process( Annual) • Pruning continues • Dormant Sprays Trees pruned, irrigated and fertilized ( Year 4, first crops) Year 2 -6 Year 7 -100 December. March April. August November September. October Year 2 Year 1 Trees planted, irrigation system installed Seedling graft • Late harvest completed • orchard floors cleaned • Fertilization • irrigation • Pest management • Early harvest begins
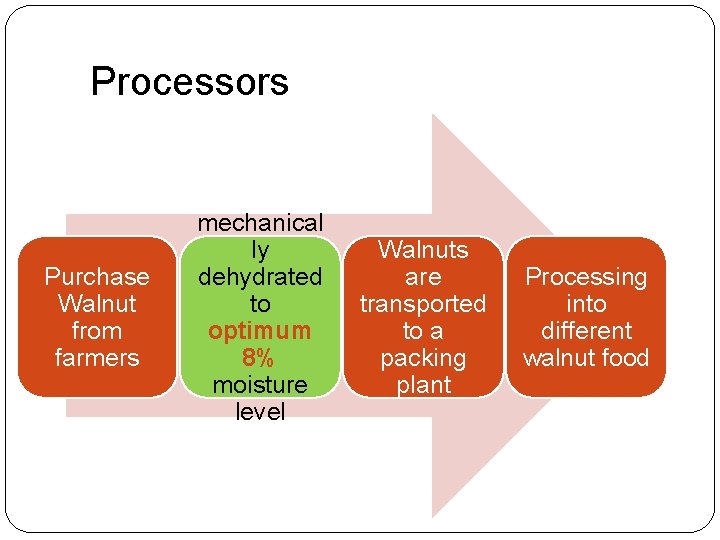
Processors Purchase Walnut from farmers mechanical ly dehydrated to optimum 8% moisture level Walnuts are transported to a packing plant Processing into different walnut food
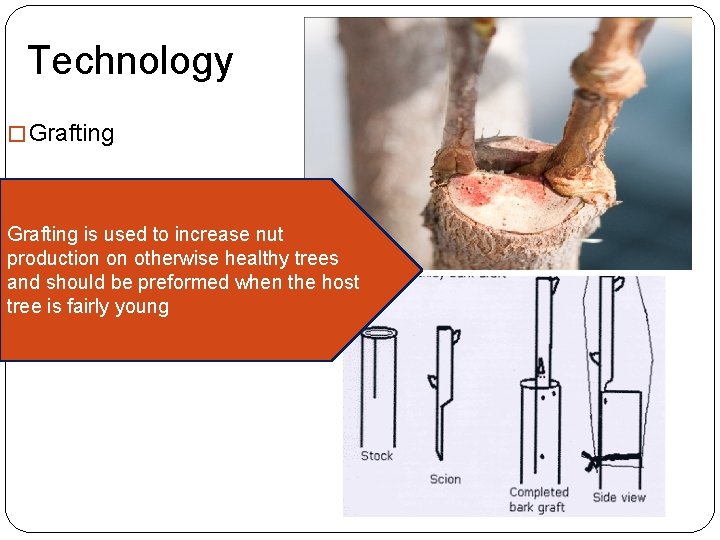
Technology � Grafting is used to increase nut production on otherwise healthy trees and should be preformed when the host tree is fairly young
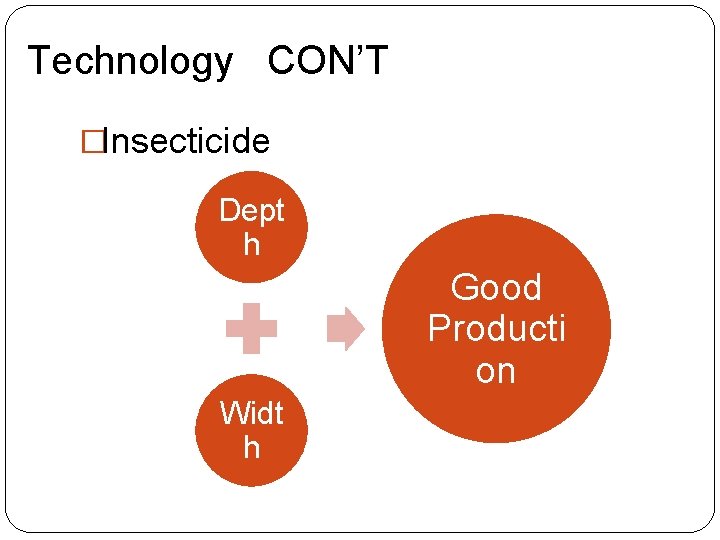
Technology CON’T �Insecticide Dept h Good Producti on Widt h
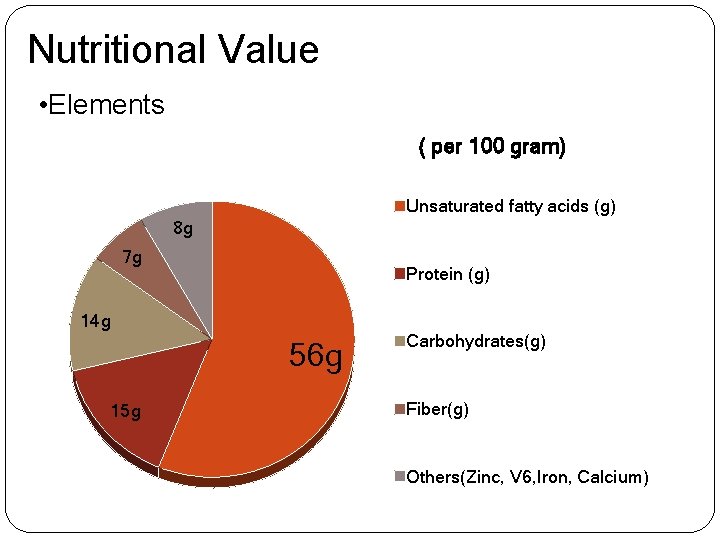
Nutritional Value • Elements ( per 100 gram) Unsaturated fatty acids (g) 8 g 7 g Protein (g) 14 g 56 g 15 g Carbohydrates(g) Fiber(g) Others(Zinc, V 6, Iron, Calcium)
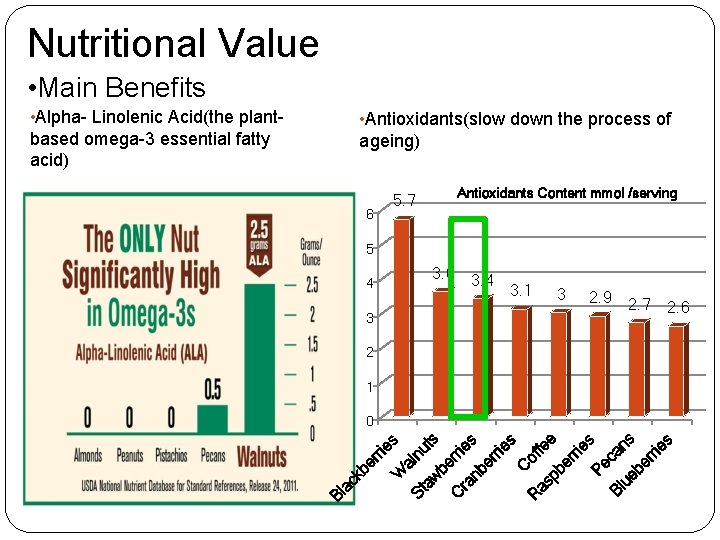
Nutritional Value • Main Benefits • Alpha- Linolenic Acid(the plant- • Antioxidants(slow down the process of based omega-3 essential fatty acid) ageing) Antioxidants Content mmol /serving 5. 7 6 5 3. 6 4 3 3. 4 3. 1 3 2. 9 2. 7 2. 6 2 1 ts be r C ra ries nb er rie s C o R as ffe pb e er rie s Pe ca Bl ue ns be rri es aw W al nu St Bl ac k be r rie s 0
Walnut Market Background
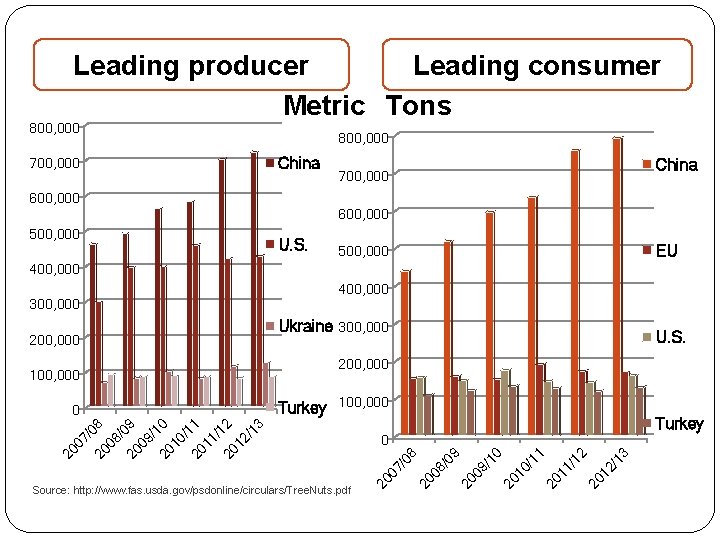
Leading producer Leading consumer Metric Tons 800, 000 700, 000 800, 000 China 700, 000 600, 000 500, 000 U. S. EU 500, 000 400, 000 Turkey 100, 000 2/ 13 20 1 1/ 12 20 1 0/ 11 20 1 9/ 10 0 20 0 Source: http: //www. fas. usda. gov/psdonline/circulars/Tree. Nuts. pdf Turkey 8/ 09 20 0 7/ 0 20 8 08 /0 20 9 09 /1 20 0 10 /1 20 1 11 /1 20 2 12 /1 3 0 200, 000 20 0 100, 000 U. S. 7/ 08 200, 000 Ukraine 300, 000 20 0 300, 000 400, 000
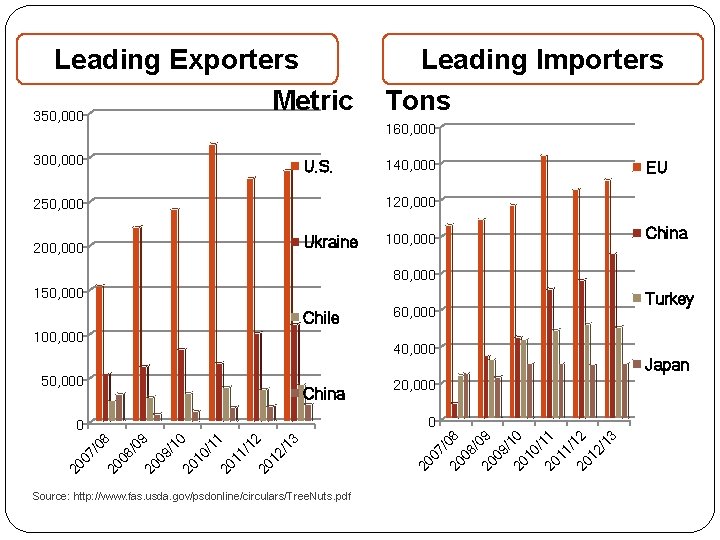
Leading Exporters Metric 350, 000 Leading Importers Tons 300, 000 140, 000 U. S. 160, 000 EU 120, 000 250, 000 Ukraine 200, 000 100, 000 China 80, 000 150, 000 Chile 100, 000 40, 000 50, 000 China 20, 000 20 0 2/ 13 20 1 1/ 12 20 1 0/ 11 20 1 9/ 10 20 0 8/ 09 20 0 7/ 08 Source: http: //www. fas. usda. gov/psdonline/circulars/Tree. Nuts. pdf 7/ 20 08 08 / 20 09 09 / 20 10 10 / 20 11 11 / 20 12 12 /1 3 0 0 20 0 60, 000 Turkey Japan
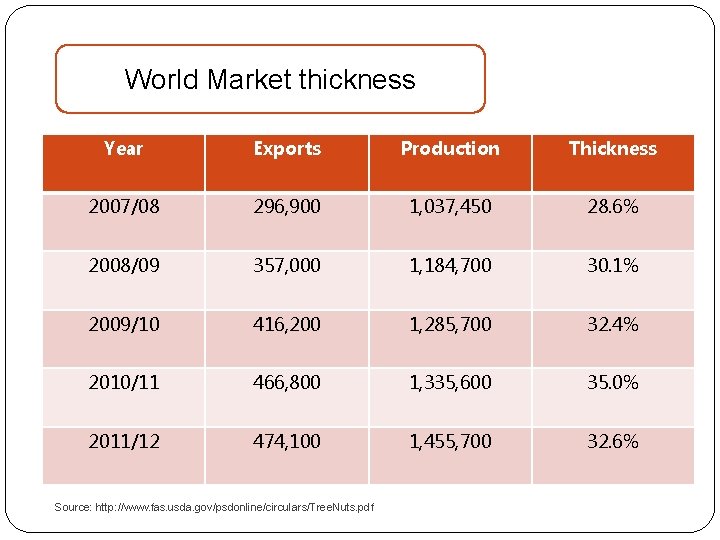
World Market thickness Year Exports Production Thickness 2007/08 296, 900 1, 037, 450 28. 6% 2008/09 357, 000 1, 184, 700 30. 1% 2009/10 416, 200 1, 285, 700 32. 4% 2010/11 466, 800 1, 335, 600 35. 0% 2011/12 474, 100 1, 455, 700 32. 6% Source: http: //www. fas. usda. gov/psdonline/circulars/Tree. Nuts. pdf
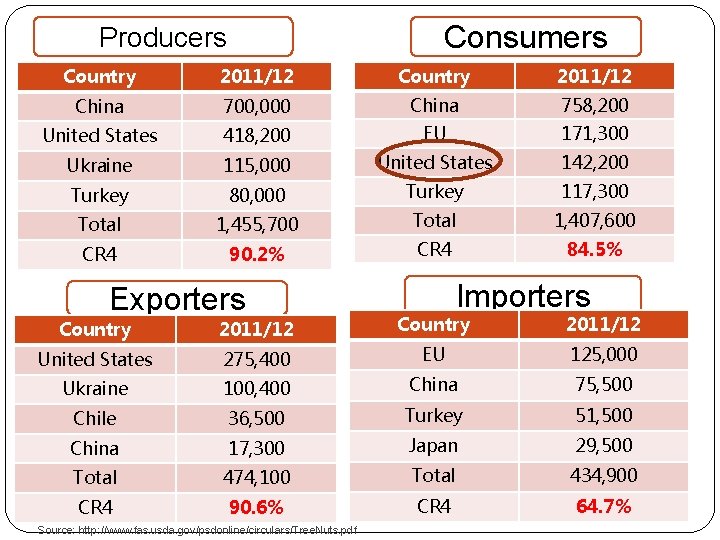
Consumers Producers Country 2011/12 China 700, 000 China 758, 200 United States 418, 200 EU 171, 300 Ukraine 115, 000 United States 142, 200 Turkey 80, 000 Turkey 117, 300 Total 1, 455, 700 Total 1, 407, 600 CR 4 90. 2% CR 4 84. 5% Exporters Importers Country 2011/12 United States 275, 400 EU 125, 000 Ukraine 100, 400 China 75, 500 Chile 36, 500 Turkey 51, 500 China 17, 300 Japan 29, 500 Total 474, 100 Total 434, 900 CR 4 90. 6% CR 4 64. 7% Source: http: //www. fas. usda. gov/psdonline/circulars/Tree. Nuts. pdf
Regulation and Policy Analysis
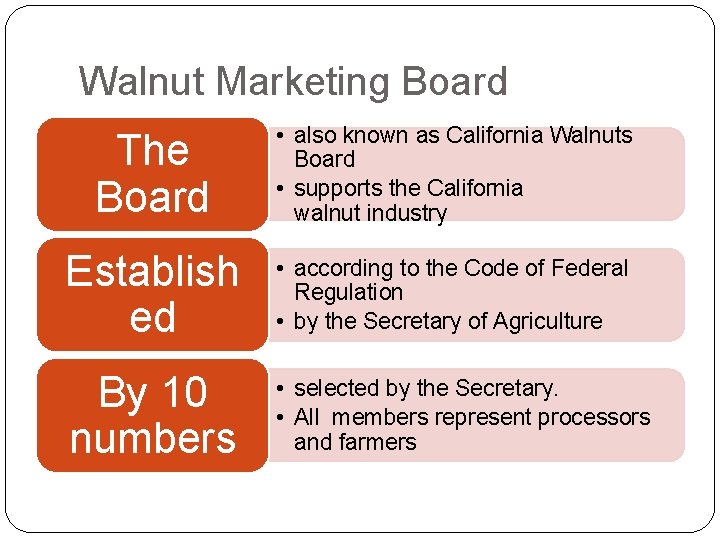
Walnut Marketing Board The Board • also known as California Walnuts Board • supports the California walnut industry Establish ed • according to the Code of Federal Regulation • by the Secretary of Agriculture By 10 numbers • selected by the Secretary. • All members represent processors and farmers
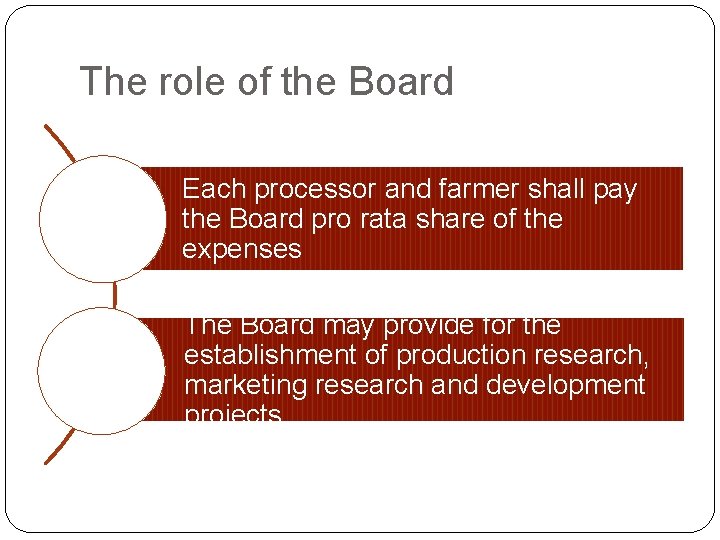
The role of the Board Each processor and farmer shall pay the Board pro rata share of the expenses The Board may provide for the establishment of production research, marketing research and development projects
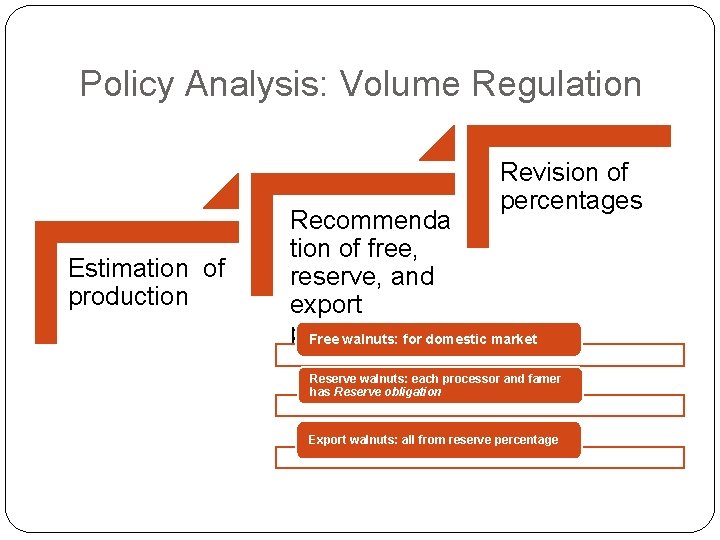
Policy Analysis: Volume Regulation Revision of percentages Estimation of production Recommenda tion of free, reserve, and export percentages Free walnuts: for domestic market Reserve walnuts: each processor and famer has Reserve obligation Export walnuts: all from reserve percentage
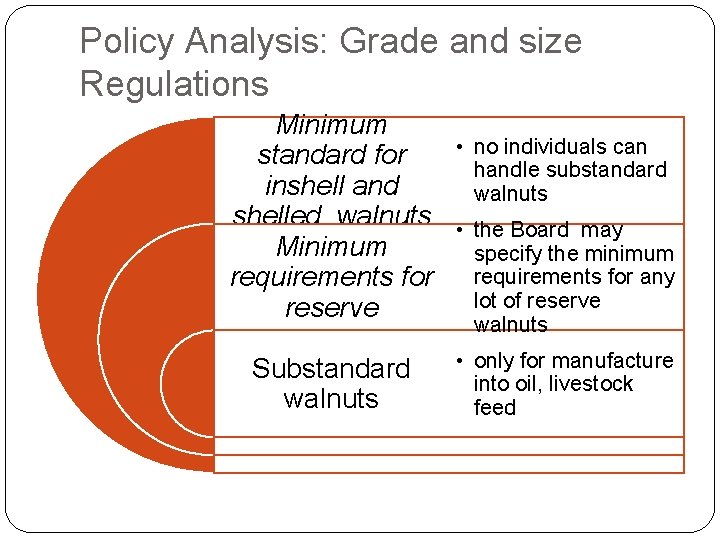
Policy Analysis: Grade and size Regulations Minimum • standard for inshell and shelled walnuts • Minimum requirements for reserve Substandard walnuts no individuals can handle substandard walnuts the Board may specify the minimum requirements for any lot of reserve walnuts • only for manufacture into oil, livestock feed
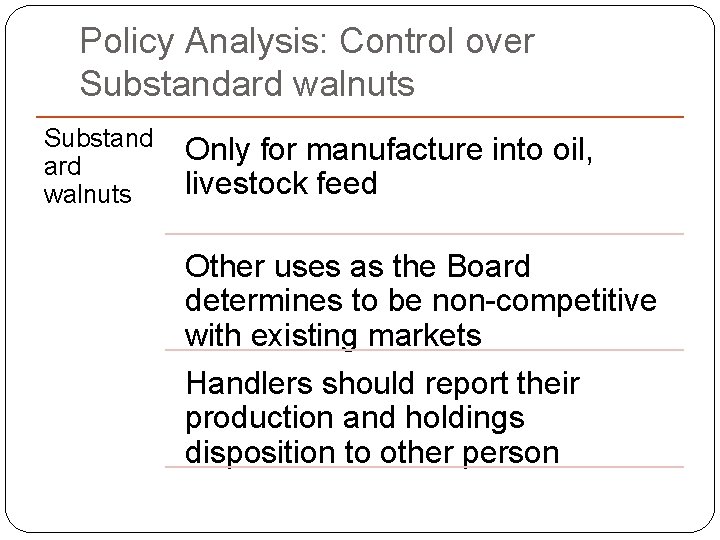
Policy Analysis: Control over Substandard walnuts Substand ard walnuts Only for manufacture into oil, livestock feed Other uses as the Board determines to be non-competitive with existing markets Handlers should report their production and holdings disposition to other person
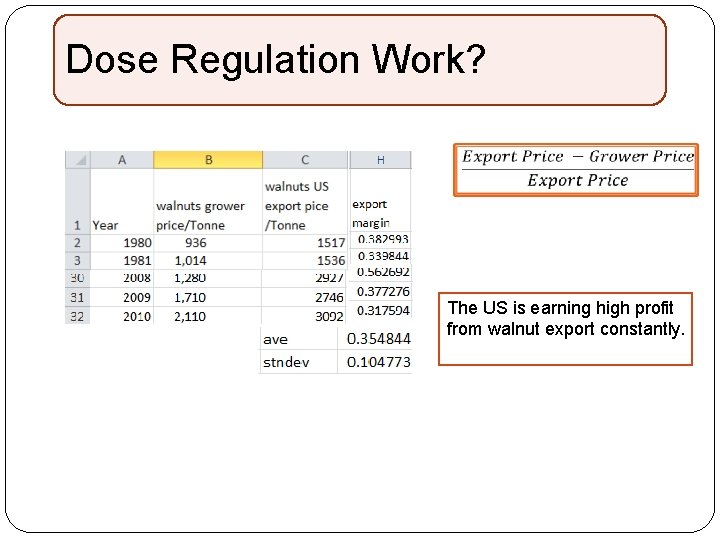
Dose Regulation Work? The US is earning high profit from walnut export constantly.
Price Factors
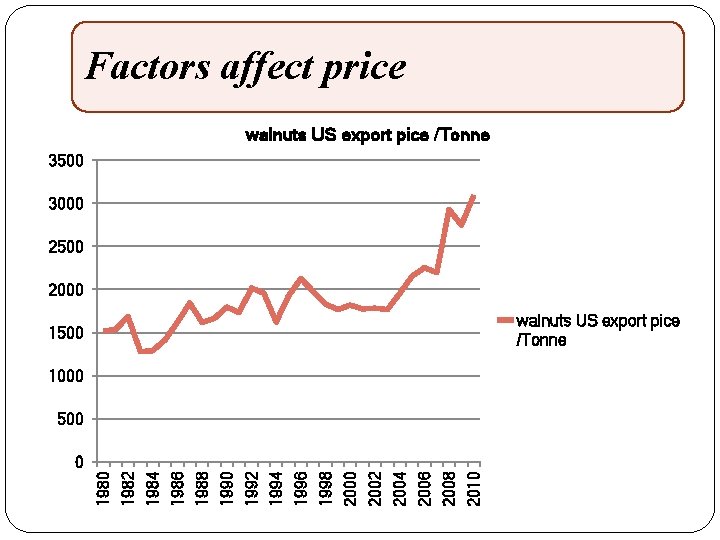
Factors affect price walnuts US export pice /Tonne 3500 3000 2500 2000 walnuts US export pice /Tonne 1500 1000 500 2010 2008 2006 2004 2002 2000 1998 1996 1994 1992 1990 1988 1986 1984 1982 1980 0
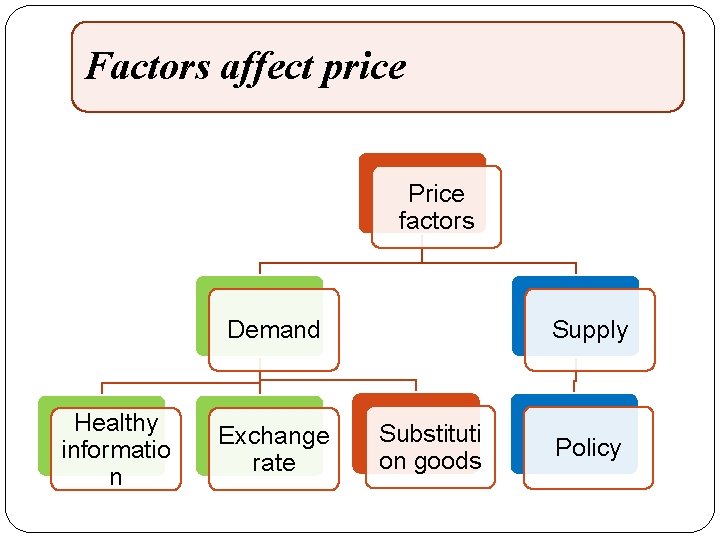
Factors affect price Price factors Demand Healthy informatio n Exchange rate Supply Substituti on goods Policy
Factors affect price Supply Parts
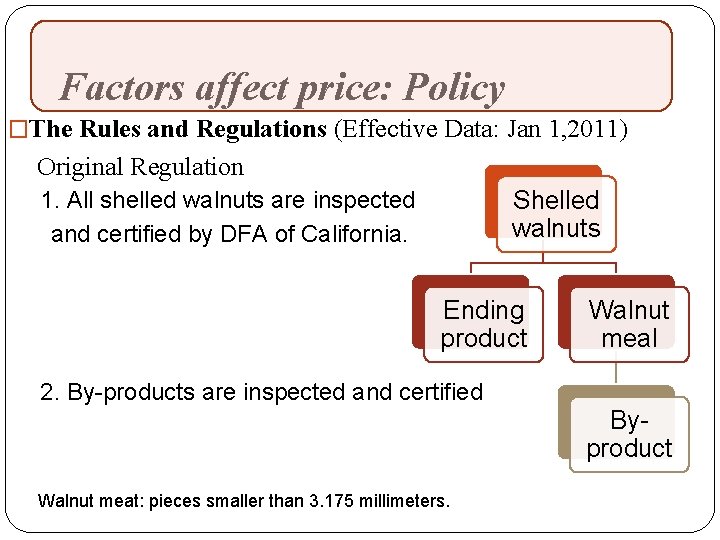
Factors affect price: Policy �The Rules and Regulations (Effective Data: Jan 1, 2011) Original Regulation Shelled walnuts 1. All shelled walnuts are inspected and certified by DFA of California. Ending product 2. By-products are inspected and certified Walnut meat: pieces smaller than 3. 175 millimeters. Walnut meal Byproduct
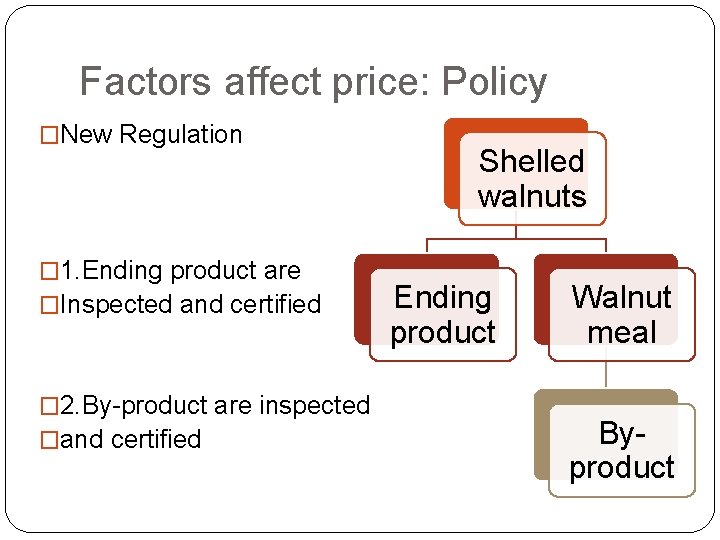
Factors affect price: Policy �New Regulation � 1. Ending product are �Inspected and certified � 2. By-product are inspected �and certified Shelled walnuts Ending product Walnut meal Byproduct
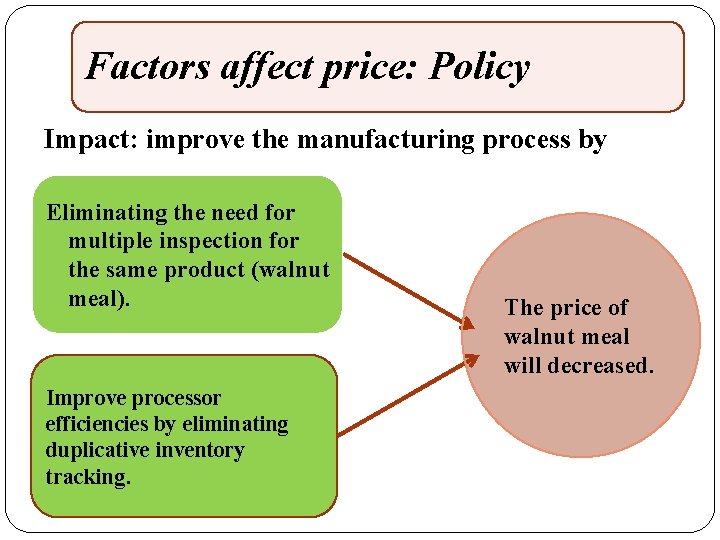
Factors affect price: Policy Impact: improve the manufacturing process by Eliminating the need for multiple inspection for the same product (walnut meal). Improve processor efficiencies by eliminating duplicative inventory tracking. The price of walnut meal will decreased.
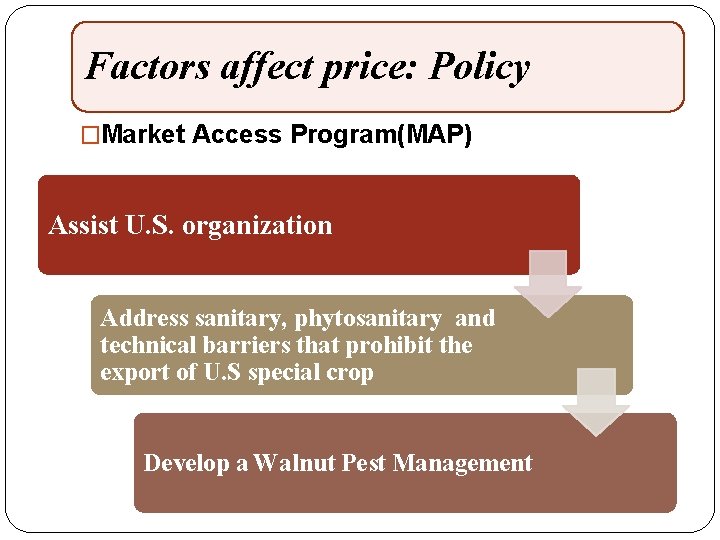
Factors affect price: Policy �Market Access Program(MAP) Assist U. S. organization Address sanitary, phytosanitary and technical barriers that prohibit the export of U. S special crop Develop a Walnut Pest Management
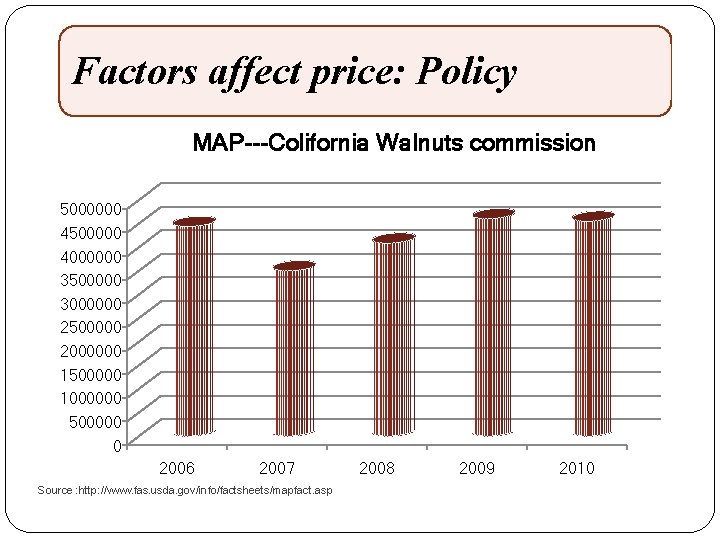
Factors affect price: Policy MAP---Colifornia Walnuts commission 5000000 4500000 4000000 3500000 3000000 2500000 2000000 1500000 1000000 500000 0 2006 2007 Source : http: //www. fas. usda. gov/info/factsheets/mapfact. asp 2008 2009 2010
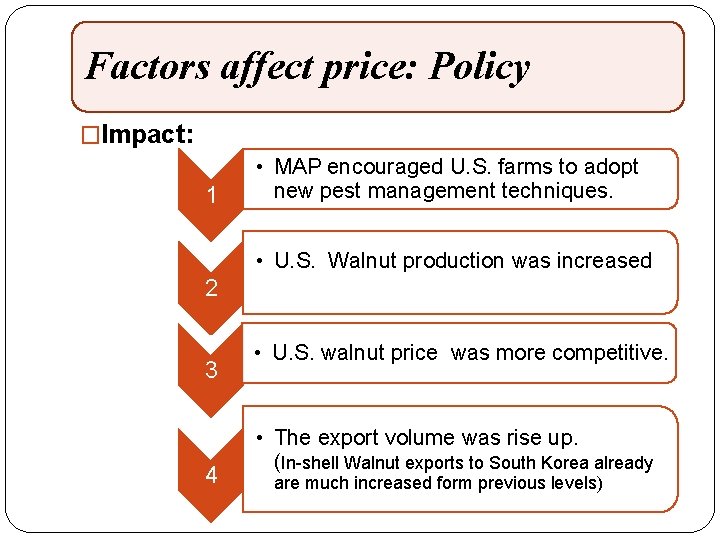
Factors affect price: Policy �Impact: 1 • MAP encouraged U. S. farms to adopt new pest management techniques. • U. S. Walnut production was increased 2 3 4 • U. S. walnut price was more competitive. • The export volume was rise up. (In-shell Walnut exports to South Korea already are much increased form previous levels)
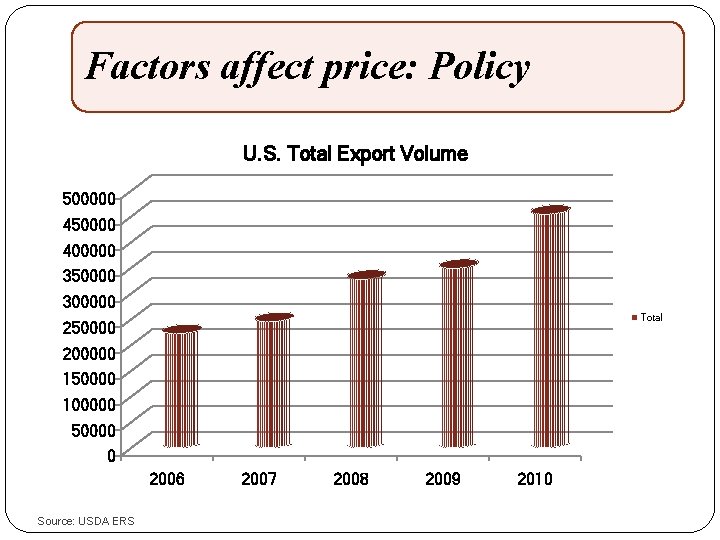
Factors affect price: Policy U. S. Total Export Volume 500000 450000 400000 350000 300000 Total 250000 200000 150000 100000 50000 0 2006 Source: USDA ERS 2007 2008 2009 2010
Factors affect price Demand part
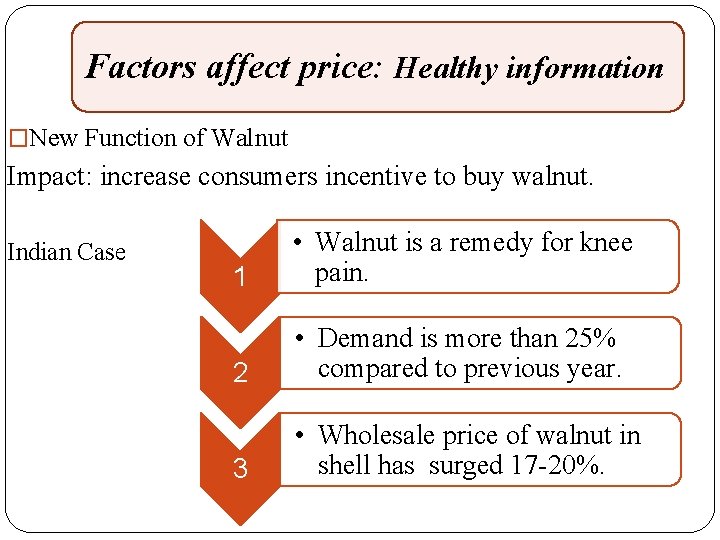
Factors affect price: Healthy information �New Function of Walnut Impact: increase consumers incentive to buy walnut. Indian Case 1 • Walnut is a remedy for knee pain. 2 • Demand is more than 25% compared to previous year. 3 • Wholesale price of walnut in shell has surged 17 -20%.
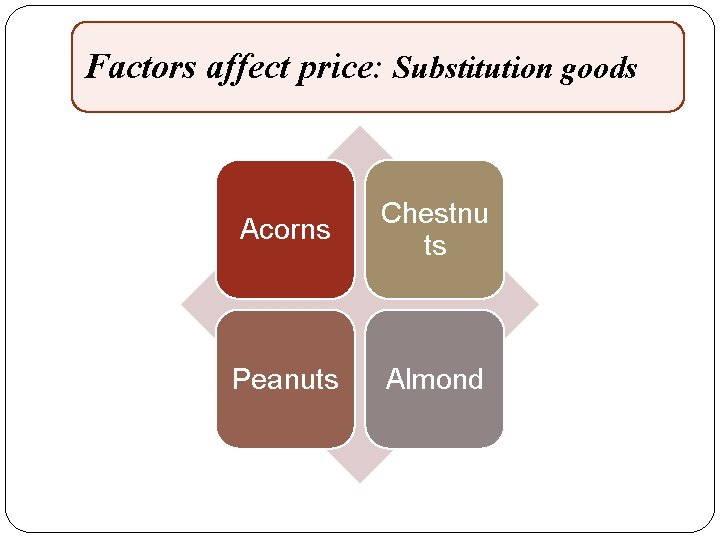
Factors affect price: Substitution goods Acorns Chestnu ts Peanuts Almond
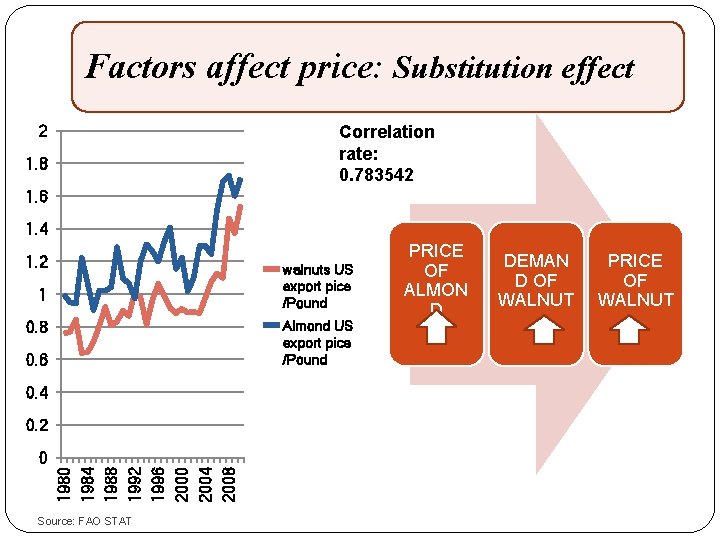
Factors affect price: Substitution effect Correlation rate: 0. 783542 2 1. 8 1. 6 1. 4 1. 2 walnuts US export pice /Pound 1 Almond US export pice /Pound 0. 8 0. 6 0. 4 0. 2 1980 1984 1988 1992 1996 2000 2004 2008 0 Source: FAO STAT PRICE OF ALMON D DEMAN D OF WALNUT PRICE OF WALNUT
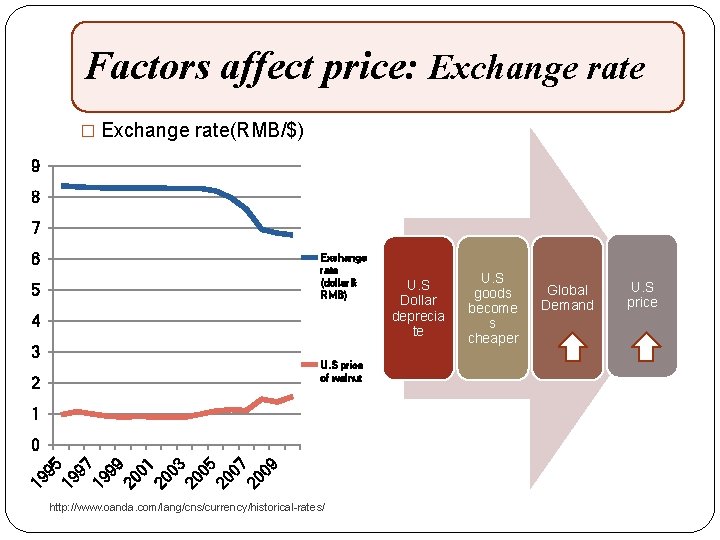
Factors affect price: Exchange rate � Exchange rate(RMB/$) 9 8 7 6 Exchange rate (dollar& RMB) 5 4 3 U. S price of walnut 2 1 19 95 19 97 19 99 20 01 20 03 20 05 20 07 20 09 0 http: //www. oanda. com/lang/cns/currency/historical-rates/ U. S Dollar deprecia te U. S goods become s cheaper Global Demand U. S price
Econometrical Analysis
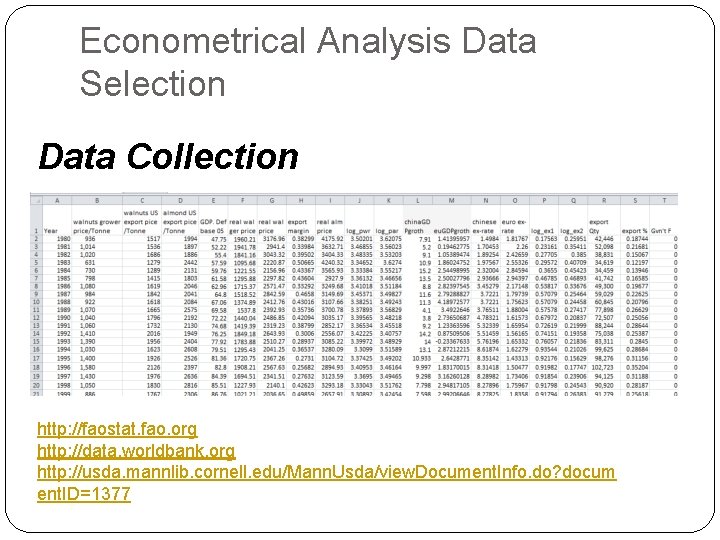
Econometrical Analysis Data Selection Data Collection http: //faostat. fao. org http: //data. worldbank. org http: //usda. mannlib. cornell. edu/Mann. Usda/view. Document. Info. do? docum ent. ID=1377
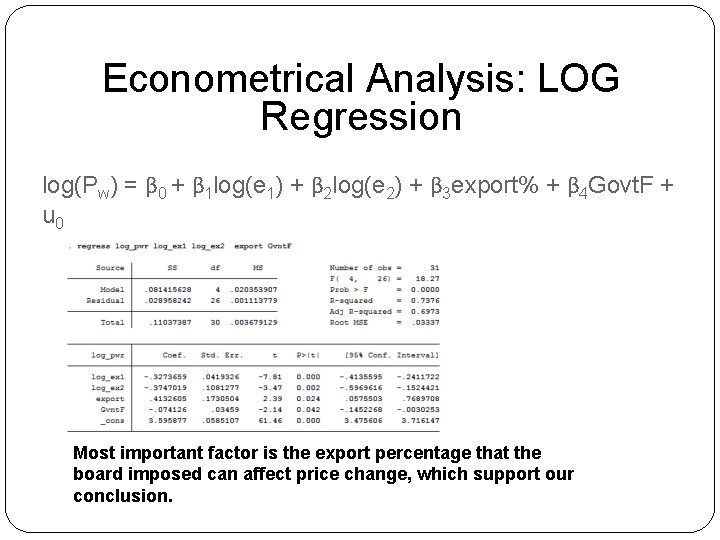
Econometrical Analysis: LOG Regression log(Pw) = β 0 + β 1 log(e 1) + β 2 log(e 2) + β 3 export% + β 4 Govt. F + u 0 Most important factor is the export percentage that the board imposed can affect price change, which support our conclusion.
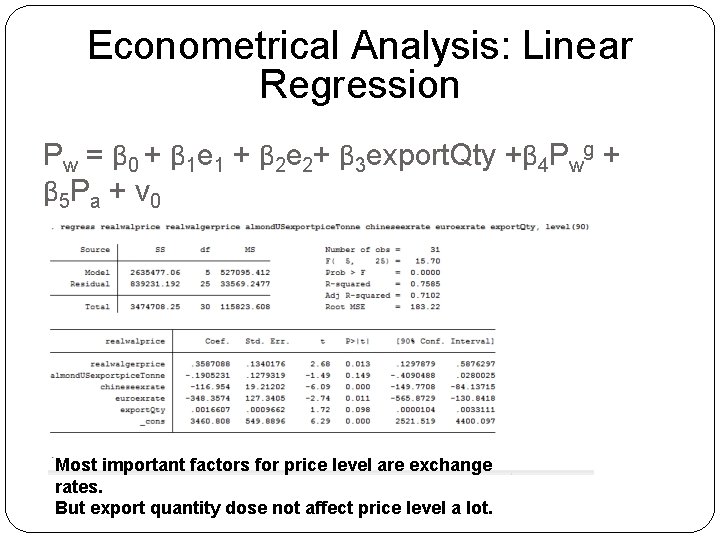
Econometrical Analysis: Linear Regression Pw = β 0 + β 1 e 1 + β 2 e 2+ β 3 export. Qty +β 4 Pwg + β 5 Pa + v 0 Most important factors for price level are exchange rates. But export quantity dose not affect price level a lot.
Case Study: The Walnut Story
The Walnut Story in EU
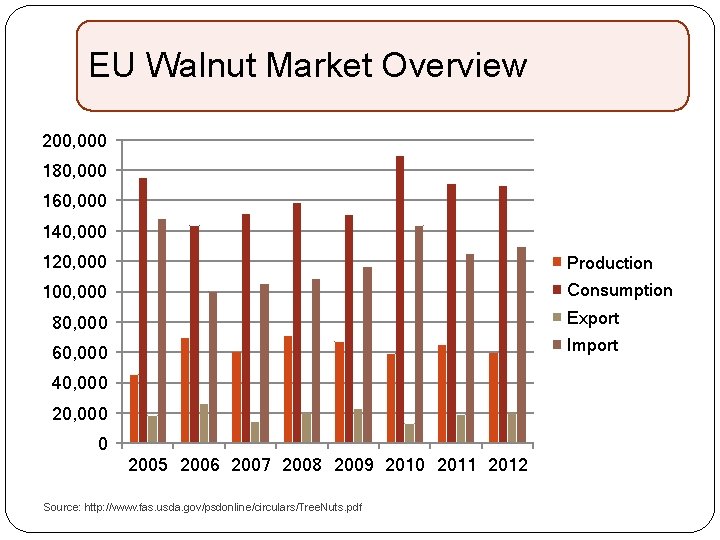
EU Walnut Market Overview 200, 000 180, 000 160, 000 140, 000 120, 000 Production 100, 000 Consumption 80, 000 Export 60, 000 Import 40, 000 20, 000 0 2005 2006 2007 2008 2009 2010 2011 2012 Source: http: //www. fas. usda. gov/psdonline/circulars/Tree. Nuts. pdf
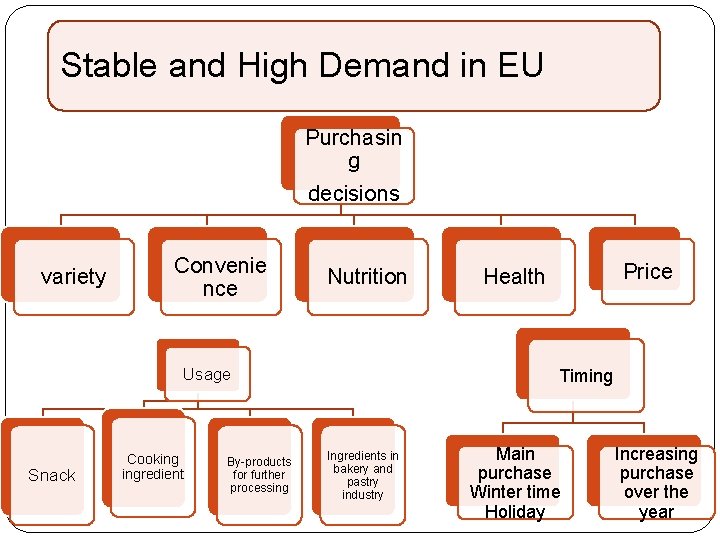
Stable and High Demand in EU Purchasin g decisions variety Convenie nce Nutrition Usage Snack Cooking ingredient By-products for further processing Price Health Timing Ingredients in bakery and pastry industry Main purchase Winter time Holiday Increasing purchase over the year
Stable Supply in EU �Domestic Production: �France : Net exporter, 85% export to EU �Italy �Spain �Import: 69% walnut supply from the US
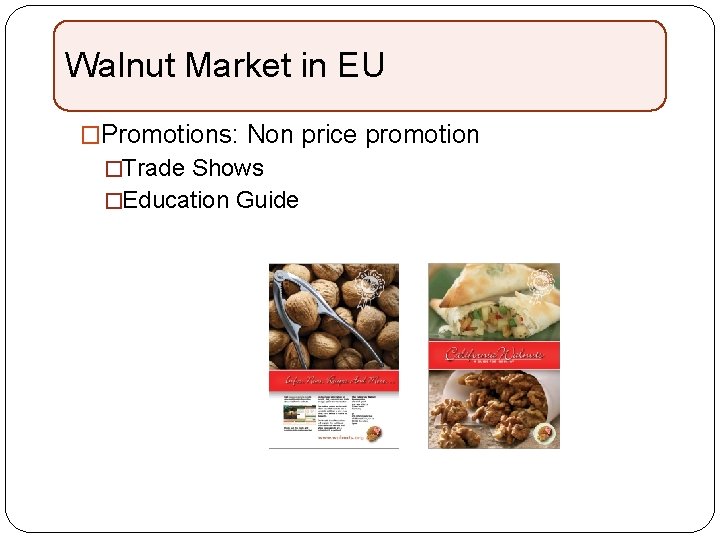
Walnut Market in EU �Promotions: Non price promotion �Trade Shows �Education Guide
The Walnut Story in China
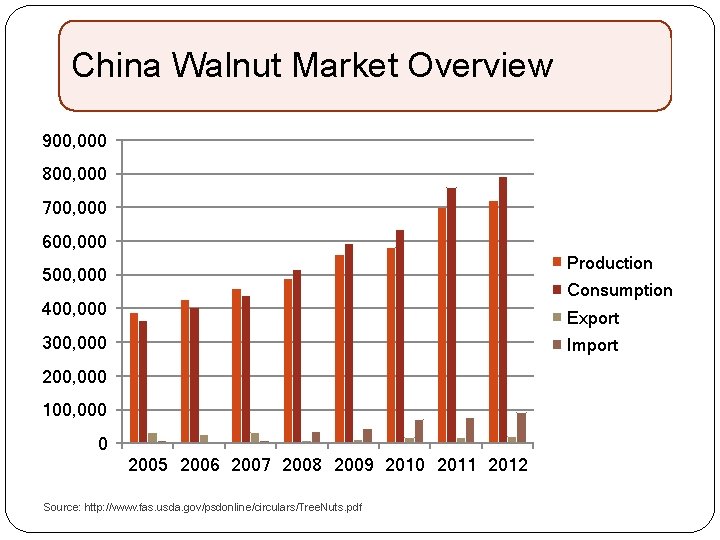
China Walnut Market Overview 900, 000 800, 000 700, 000 600, 000 Production 500, 000 Consumption 400, 000 Export 300, 000 Import 200, 000 100, 000 0 2005 2006 2007 2008 2009 2010 2011 2012 Source: http: //www. fas. usda. gov/psdonline/circulars/Tree. Nuts. pdf
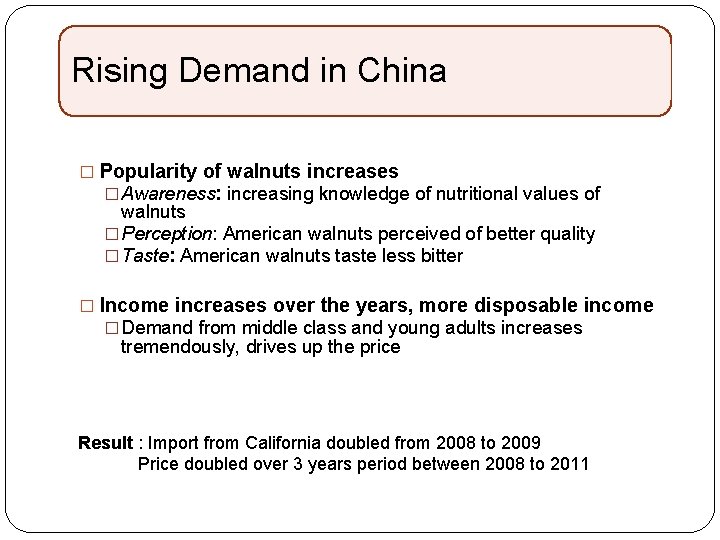
Rising Demand in China � Popularity of walnuts increases � Awareness: increasing knowledge of nutritional values of walnuts � Perception: American walnuts perceived of better quality � Taste: American walnuts taste less bitter � Income increases over the years, more disposable income � Demand from middle class and young adults increases tremendously, drives up the price Result : Import from California doubled from 2008 to 2009 Price doubled over 3 years period between 2008 to 2011
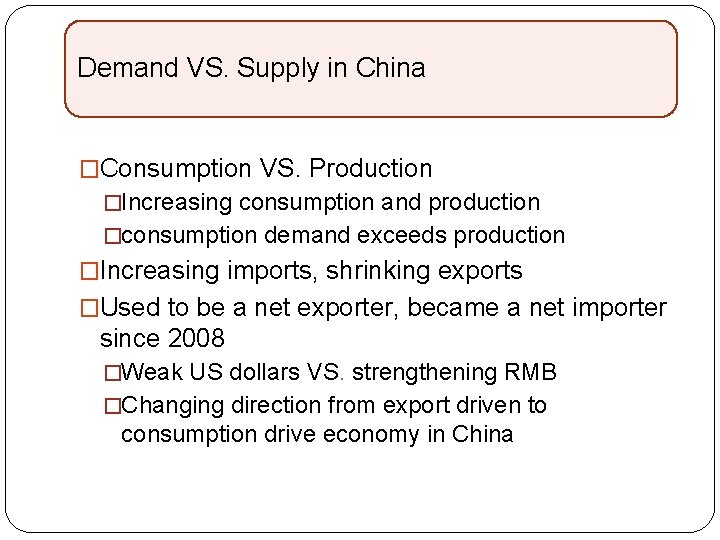
Demand VS. Supply in China �Consumption VS. Production �Increasing consumption and production �consumption demand exceeds production �Increasing imports, shrinking exports �Used to be a net exporter, became a net importer since 2008 �Weak US dollars VS. strengthening RMB �Changing direction from export driven to consumption drive economy in China
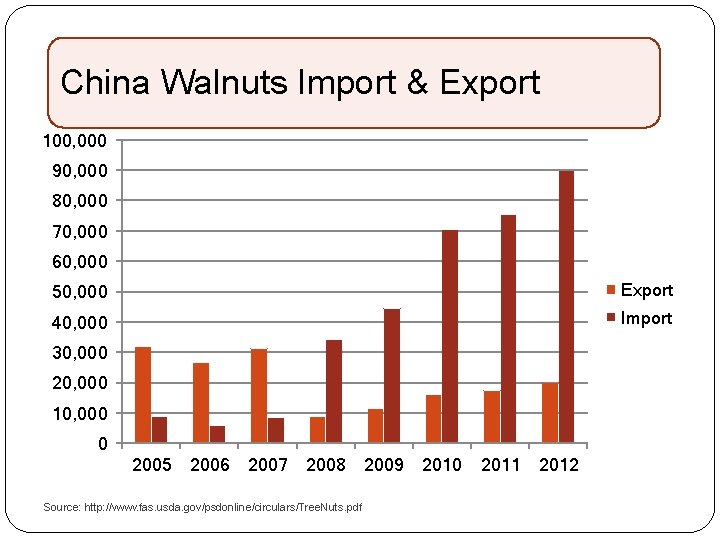
China Walnuts Import & Export 100, 000 90, 000 80, 000 70, 000 60, 000 50, 000 Export 40, 000 Import 30, 000 20, 000 10, 000 0 2005 2006 2007 2008 Source: http: //www. fas. usda. gov/psdonline/circulars/Tree. Nuts. pdf 2009 2010 2011 2012
Production Challenges in China �Cultural, Climatic, Geographical Challenges �High investment, low return in the first few years Preventing the production to meet internal demand
Production Improvement in China � Production is expected to increase dramatically in 5 - 10 years (esp. in Yunnan Province) �Poverty Alleviation Program �Forestation Program �Cropland conversion Program � Production increases is expected by improving Technology motivated by government support �Walnut Drying technology � Traditional wood or coal fire oven VS. modern technology (improve taste) �Making walnut milk and walnut oil
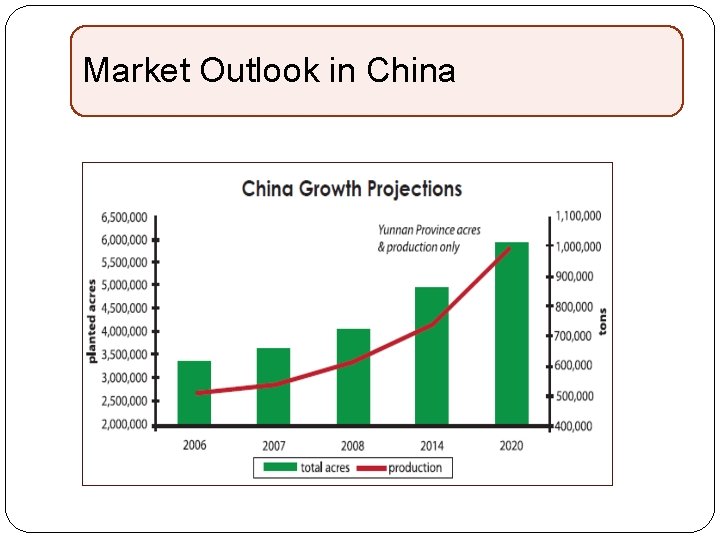
Market Outlook in China
Opportunities in Walnut Market �EU Market �Mature �Room to expand �China Market �Growing �Lots of room to expand



Gift time
- Slides: 63