Wall chart for Latin American Countries Mauricio Holz


 Reallocation Rate § Is the sum of the LCD of the dependency")


. Country Aggregate Spending")


- Slides: 21
Wall chart for Latin American Countries Mauricio Holz UN-CELADE/ECLAC
Will be the best Wall chart in the history of Wall charts! (The first Wall chart in human history) Altamira cave, prehistoric Anonymous man
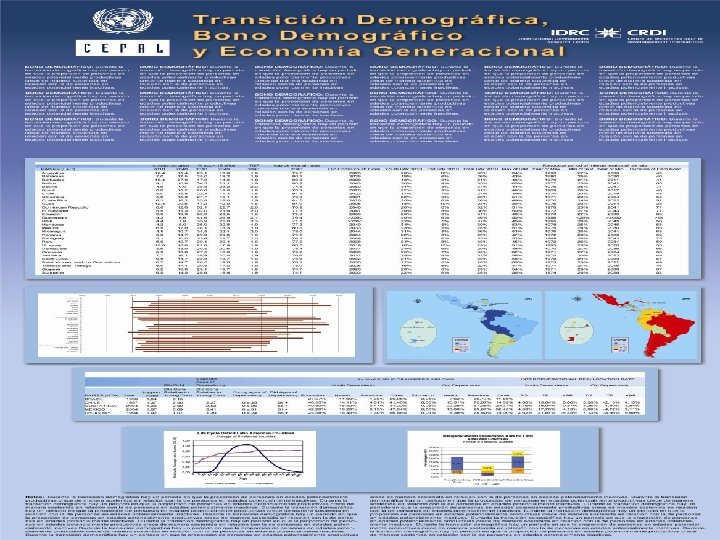
Structure § Two kinds of information – Demographic and Economic measures for 30 Latin American and Caribbean Countries – Comparison between NTA Latin American Countries and other NTA regions using National Transfers Accounts.
Demographic and economic measures for 30 Latin American and Caribbean Countries § Life Expectancy, TFR, percentage of population 65+ and below 15, in 2010 and 2040 § Year in which old consumption is higher relative to young consumption. § Intergenerational (Tax) Reallocation Rate for young dependency group and for old dependency group. § Five statistics of the first Demographic Dividend. § Economic dependency measures by social sectors.
Percentage of population 65+. 2010 and 2040
Year in which old consumption is higher compare to young consumption. § Using support ratios we calculated the year in which 65+ relative effective consumers are higher than <15 relative effective consumers for 30 LAC 2006 2049
Intergenerational (Tax) Reallocation Rate § Is the sum of the LCD of the dependency age group of young people as fraction of GDP, plus the LCD of the dependency age group of old people as a fraction of GDP
ITR and Ageing Cross sectional data
ITR and Ageing Cross sectional data § Cross sectional data seems to replicate the demographic dividend pattern of one country. – A sign of Heterogeneity in the ageing process between LAC. (Different stages in the process) – How much of this cross sectional data can be explained by demographic factors and by the LCD per-capita ages profiles? - How this graph will change when we include the NTA data for other Latin American countries. Maybe not much? - Is there some causality between the ageing process and the per-capita age profiles of LCD?
Statistics of the first demographic dividend § Min: The lowest value of the support ratio during the demographic dividend. § Year of Min: The year when the SR reach is lowest value. Represent the starting point of the first demographic dividend. § Max: The highest value of the support ratio during the demographic dividend. § Year of Max: The year when the SR reach is highest value. Represent the ending point of the first demographic dividend. § Duration of the demographic bond: The number of years between the lowest value and the highest value.
Economic dependency measure by social sectors, Health (Miller, Mason and Holz). Country Aggregate Spending (% GDP) Benefit Generosity Ratio (% of GDP per working-age adult) Dependency Ratio (% of working-age population) Cuba 7. 4 66 11 Colombia 6. 2 62 10 Costa Rica 5. 9 83 7 Argentina 4. 5 32 14 Nicaragua 3. 4 33 10 Uruguay 3. 4 20 17 Brazil 3. 1 28 11 Mexico 3. 0 35 9 Chile 2. 8 31 9 Peru 1. 5 15 10 Median, Latin America 3. 4 34 10 Mean, Latin America 4. 1 38 11 Mean, OECD 6. 9 46 15
Comparison between NTA Latin American Countries and other NTA regions using NTA data. § Support Ratio § Old consumption (65+) relative to young (<15) consumption § Old consumption (LCD age group) relative to young consumption (LCD age group) § Young age group of dependency § Old age group of dependency
Comparison between NTA Latin American Countries and other NTA regions using NTA data. § Distribution of public transfers in young age dependent group between: – Education – Health – Pensions – Other in Kind
Comparison between NTA Latin American Countries and other NTA regions using NTA data. § Distribution of public transfers in old age dependent group between: – Education – Health – Pensions – Other in Kind
Comparison between NTA Latin American Countries and other NTA regions using NTA data. § Intergenerational Reallocation Rate for young dependents, disaggregated in:
Comparison between NTA Latin American Countries and other NTA regions using NTA data. § Intergenerational Reallocation Rate for old dependents, disaggregated in:
Average Life Cycle Deficit for Latin American Countries
Average Finance of Consumption for LAC
Average Intergenerational Reallocation Rate
WORK IN PROGRESS!!!!