WACAC SLC U of Redlands The Diluted Value


 SAT (2016")


 High scores increasingly common and")


- Slides: 23
WACAC SLC: U of Redlands The Diluted Value of High Test Scores Matt Steiner, Compass Education Group Mark Lim, Ramona High School
Role of Standardized Testing Today § National Association for College Admission Counseling Report on Standardized Testing (2009): • “Typically, the validity of admission tests as a selection tool for higher education institutions is judged by [how well the tests] can predict first-year college grade-point average (FGPA). ”
Why Standardized Tests?
Standardized Tests Are Consistent*
*Issues w/ Inconsistency: June 2018 SAT Raw Score Final Score 42 Correct --------------------------------650 Typical 43 Correct --------------------------------650 41 Correct --------------------------------650 June 2018 SAT 50 Correct --------------------------------650 June 2017 SAT 50 Correct --------------------------------740 Old SAT scaling never varied by more than 50 points in 10 years
*Issues w/ Inconsistency: June 2018 SAT Possible 700 Scores 700 710 720 730 740 750 760 770 780 790 800
Are we over-reacting? In general, issues with difficulty/scaling did not impact most test-takers: Ø Avg. June 2017 SAT was 1111 Ø Avg. June 2018 SAT was 1111 Ø 6. 65% of students scored between 1400 -1600 on the June 2017 and 2018 SATs
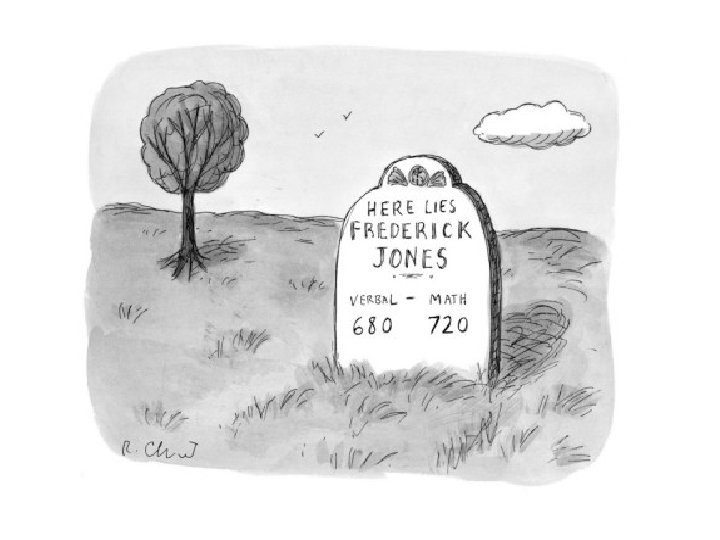
Harvard et al Hair-Splitting Test Scores
What about the PSAT/NMSQT? PSAT Total: 320 -1520 ERW: 160 -760 | Math: 160 -760 October 10 th PSAT Ø 5 wrong on Math; 700 October 24 th PSAT Ø 1 wrong on Math; 710 Ø SUPER-easy test Ø Result: High # of 760 s and 710 s w/ no in between Oct. 24 Possible Scores 710 720 730 740 750 760
How Will I Be Judged? Ice Skating at the Olympics Ø Oct 10 th PSAT • Traditional routine with plenty of tough jumps • Mistakes not judged as harshly given overall technical difficulty; smaller deductions Ø Oct 24 th PSAT • Atypical routine with low technical difficulty; far fewer tough jumps • Precise execution critical to a high score; mistakes yield higher deductions
SAT Specs: Lots of Boxes to Check Old SAT (2005 – 2016) SAT (2016 – Present)
A Prize to be Won
SAT vs ACT: Total Test-Takers
Diluted Value of High Test Scores Highlights compassprep. com/great-to-good-the-diluted-value-of-test-scores • 1400 -1600 and 31 -36 scores have doubled in last 10 years • 1500 -1600 and 34 -36 scores have doubled in last 5 years • Increase in SAT top scores from 2017 to 2018 was especially high • Super-scoring and crosstesting increases incidence of high scores
Diluted Value of High Test Scores Class of 2017 Class of 2018 700 70 k students 750 120 k students 700 750
Diluted Value of High Test Scores Why the unprecedented increase for the SAT? 1. Massive return to the SAT 2. Increased familiarity w/ new version of SAT – Possible exposure to new PSAT in 10 th and 11 th grades 3. More cross-testers; going beyond state-mandated testing 4. Superscoring § Compass estimates College Board understates students’ highest scores by up to 30 pts – data reflects last official sitting rather than highest sitting § Superscoring increases incidence of top scores by 15 -20%; for SAT, 140 k to 170 k; for ACT 135 k to 160 k 5. International students 6. Ambitious, competitive testers starting earlier, prepping more, retesting repeatedly…an arms race among top-scorers
Not Either/Or
36 Still Perfect, Less Special 3, 741 2, 760 2, 235 1, 598 1, 407 1, 162 638 588 704 781 2009 2010 2011 2012 2013 2014 2015 2016 2017 2018
ACT Score Distribution
Diluted Value of High Test Scores § Takeaways 1) High scores increasingly common and undistinguishing at most selective schools “More essential, less sufficient…” 2) Be cautious and realistic when weighing competitiveness of scores 3) Carefully evaluate improvement potential when considering preparation and retest options
The Moral of this Story… Enrollment by Admission Rate 3% 1% 16% > 50% 25 -50% 10 -25% • Admit Rate: 70% • Yield: 33% < 10% 80% Stanford (<5%) denied 70% of applicants with perfect test scores
Q&A matt@compassprep. com mlim@rusd. k 12. ca. us