
W Patrick Zeller MD FACE October 5 2017
W. Patrick Zeller MD FACE October 5, 2017 Bismark, ND Continuous Glucose Monitor: From Experimental to Standard of Care academicendocrine
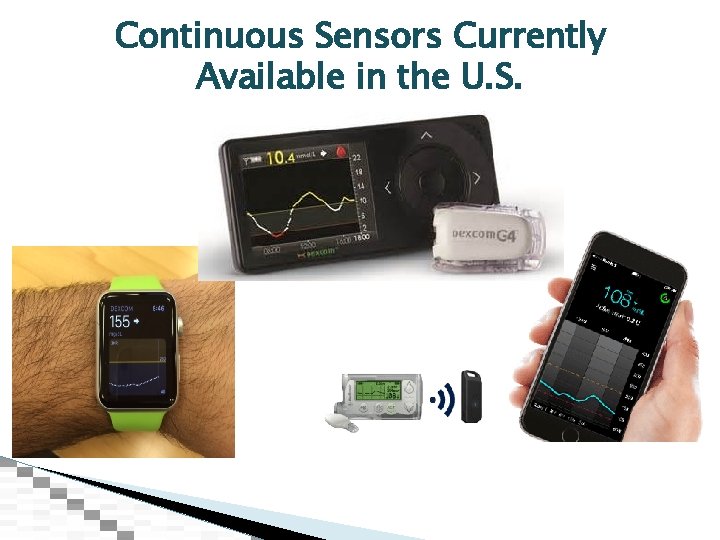
Continuous Sensors Currently Available in the U. S.
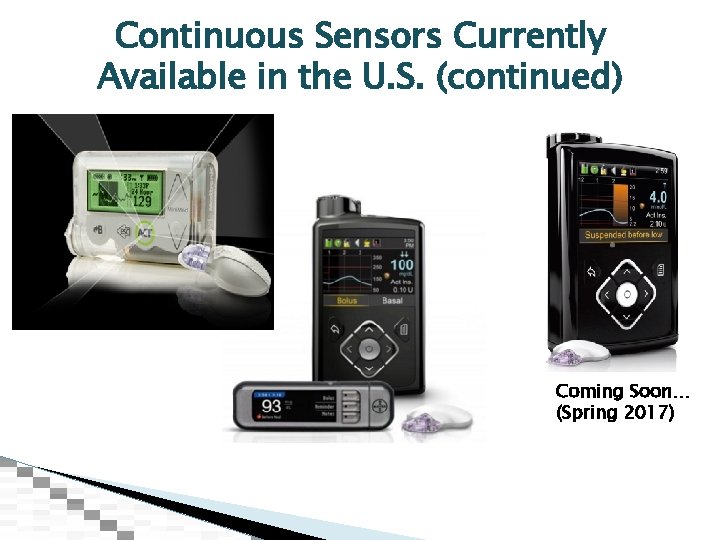
Continuous Sensors Currently Available in the U. S. (continued) Coming Soon… (Spring 2017)
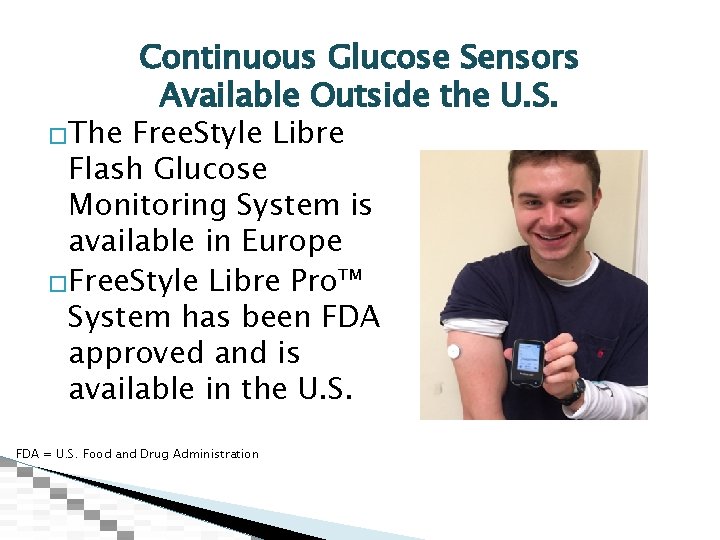
�The Continuous Glucose Sensors Available Outside the U. S. Free. Style Libre Flash Glucose Monitoring System is available in Europe �Free. Style Libre Pro™ System has been FDA approved and is available in the U. S. FDA = U. S. Food and Drug Administration
What is Continuous Glucose Monitoring? � CGM consists of a sensor inserted through the skin that measures interstitial glucose levels every 5 minutes ◦ Average 8 - to 10 minute lag behind BG values ◦ MARD between CGM sensor glucose readings and venous plasma BG measurements averages at about 10%-12%, but can vary by up to 20% � Useful � As for identifying BG trends yet not a replacement for SMBG ◦ Currently available personal systems still require 2 -4 BG checks daily ◦ Should not use the values to calculate insulin dosing BG = blood glucose; CGM = continuous glucose monitoring; MARD = mean absolute relative difference; SMBG = self-monitoring of blood glucose AACE/ACE Consensus Statement on Continuous Glucose Monitoring. 2016 Damiano ER. J Diabetes Sci Technol. 2014; 8(4): 699 -708. Keenan DB. J Diabetes Sci Technol. 2009; 3(5): 1207 -14.
Types of CGM � Professional ◦ Masked, retrospective ◦ Reviewed in clinic typically by physician; can also be reviewed by ARNP, PA � Personal ◦ Monitor shows real-time glucose levels with trends ARNP = advanced registered nurse practitioner; PA = physician assistant. AACE/ACE Consensus Statement on Continuous Glucose Monitoring. 2016
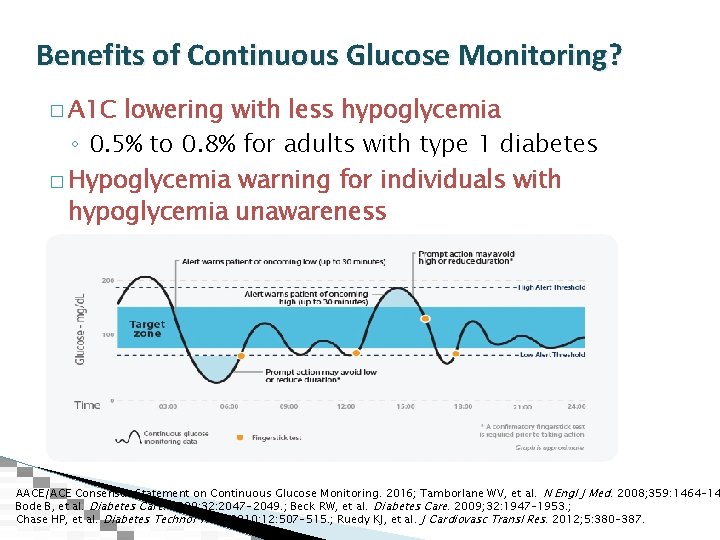
Benefits of Continuous Glucose Monitoring? � A 1 C lowering with less hypoglycemia ◦ 0. 5% to 0. 8% for adults with type 1 diabetes � Hypoglycemia warning for individuals with hypoglycemia unawareness AACE/ACE Consensus Statement on Continuous Glucose Monitoring. 2016; Tamborlane WV, et al. N Engl J Med. 2008; 359: 1464 -14 Bode B, et al. Diabetes Care. 2009; 32: 2047 -2049. ; Beck RW, et al. Diabetes Care. 2009; 32: 1947 -1953. ; Chase HP, et al. Diabetes Technol Ther. 2010; 12: 507 -515. ; Ruedy KJ, et al. J Cardiovasc Transl Res. 2012; 5: 380 -387.
Drawbacks To CGM �Can be overwhelming for some patients �Alarms can be annoying, lead to discontinuation �Cost—not covered by Medicaid or Medicare �Comfort �Accuracy �Frustration—the analog insulin we call “fast” can be slow to kick in! AACE/ACE Consensus Statement on Continuous Glucose Monitoring. 2016 AACE/ACE Outpatient Glucose Monitoring Consensus Statement. 2016.
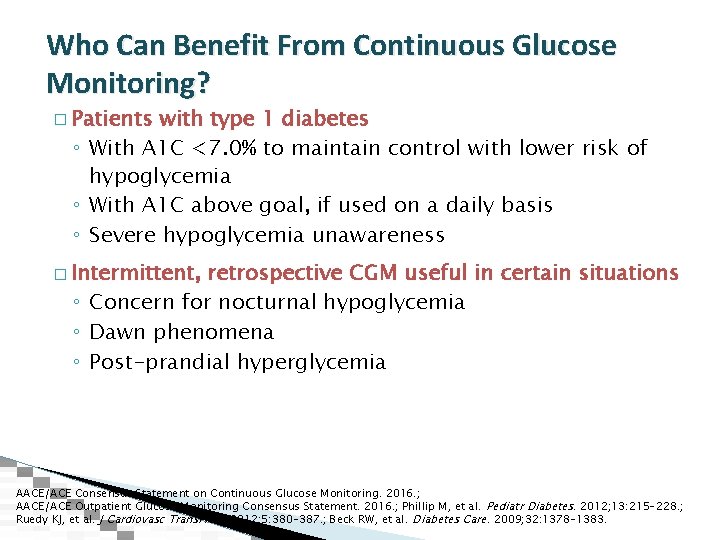
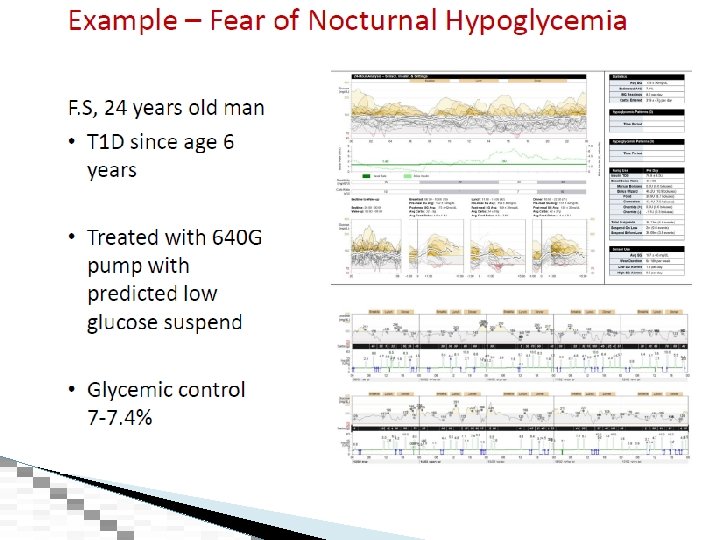
Who Can Benefit From Continuous Glucose Monitoring? � Patients with type 1 diabetes ◦ With A 1 C <7. 0% to maintain control with lower risk of hypoglycemia ◦ With A 1 C above goal, if used on a daily basis ◦ Severe hypoglycemia unawareness � Intermittent, retrospective CGM useful in certain situations ◦ Concern for nocturnal hypoglycemia ◦ Dawn phenomena ◦ Post-prandial hyperglycemia AACE/ACE Consensus Statement on Continuous Glucose Monitoring. 2016. ; AACE/ACE Outpatient Glucose Monitoring Consensus Statement. 2016. ; Phillip M, et al. Pediatr Diabetes. 2012; 13: 215 -228. ; Ruedy KJ, et al. J Cardiovasc Transl Res. 2012; 5: 380 -387. ; Beck RW, et al. Diabetes Care. 2009; 32: 1378 -1383.
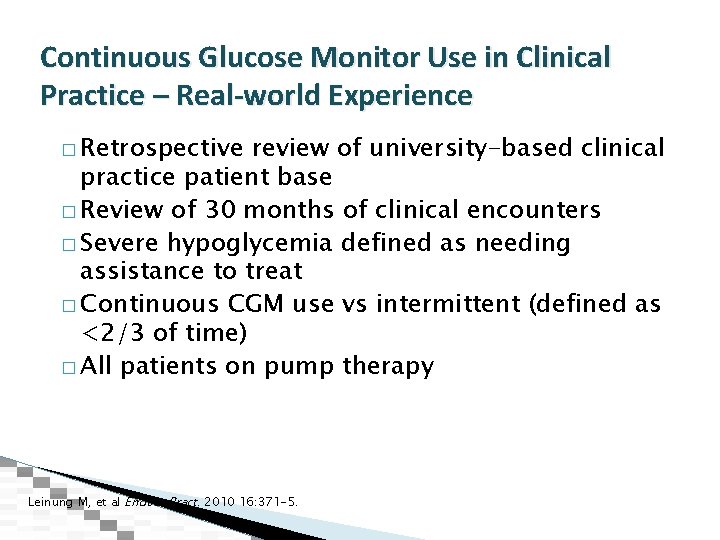
Continuous Glucose Monitor Use in Clinical Practice – Real-world Experience � Retrospective review of university-based clinical practice patient base � Review of 30 months of clinical encounters � Severe hypoglycemia defined as needing assistance to treat � Continuous CGM use vs intermittent (defined as <2/3 of time) � All patients on pump therapy Leinung M, et al Endocr Pract. 2010 16: 371 -5.
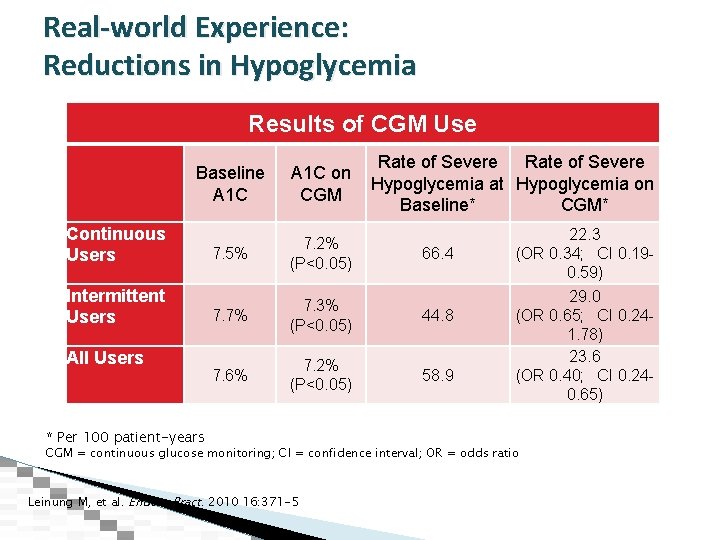
Real-world Experience: Reductions in Hypoglycemia Results of CGM Use Baseline A 1 C Continuous Users Intermittent Users All Users Rate of Severe A 1 C on Hypoglycemia at Hypoglycemia on CGM Baseline* CGM* 7. 5% 7. 2% (P<0. 05) 66. 4 7. 7% 7. 3% (P<0. 05) 44. 8 7. 6% 7. 2% (P<0. 05) 58. 9 * Per 100 patient-years 22. 3 (OR 0. 34; CI 0. 190. 59) 29. 0 (OR 0. 65; CI 0. 241. 78) 23. 6 (OR 0. 40; CI 0. 240. 65) CGM = continuous glucose monitoring; CI = confidence interval; OR = odds ratio Leinung M, et al. Endocr Pract. 2010 16: 371 -5
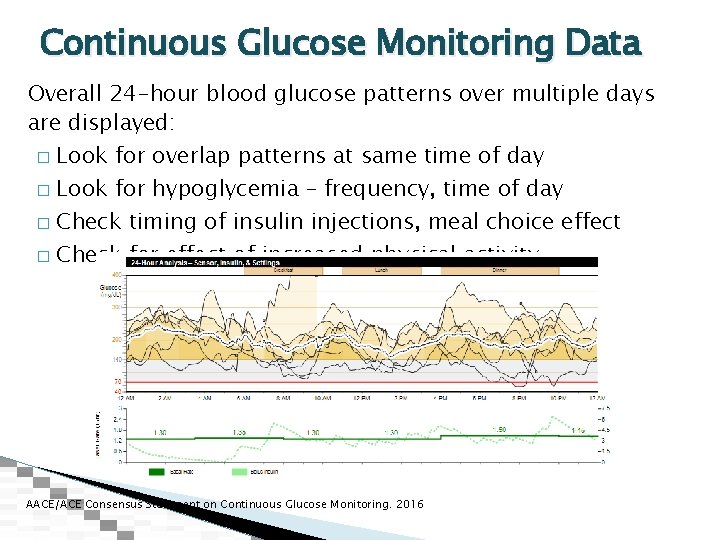
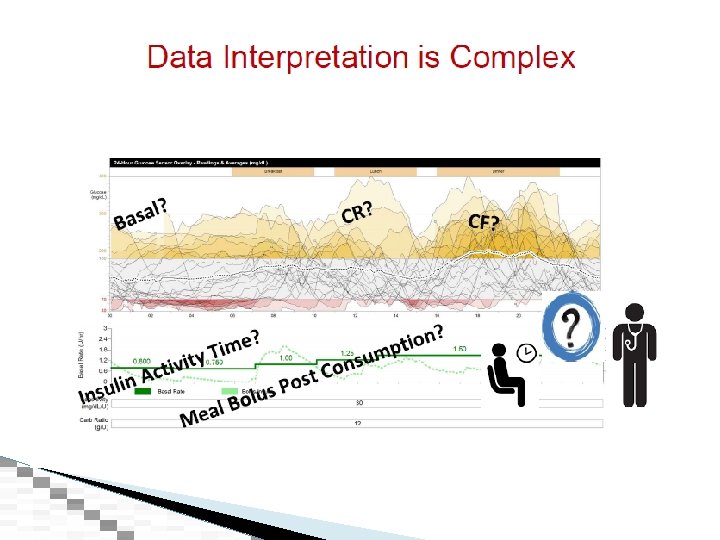
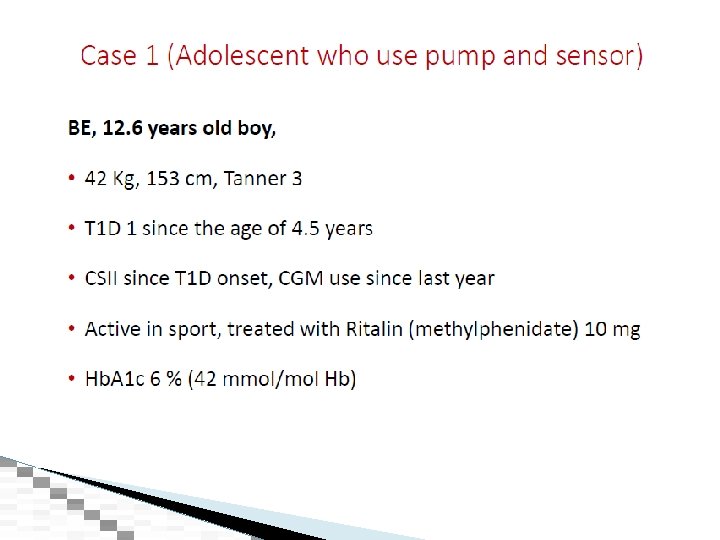
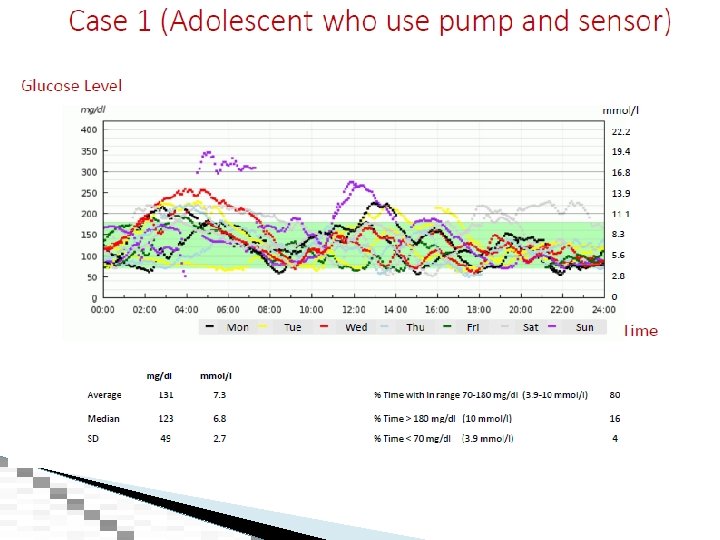
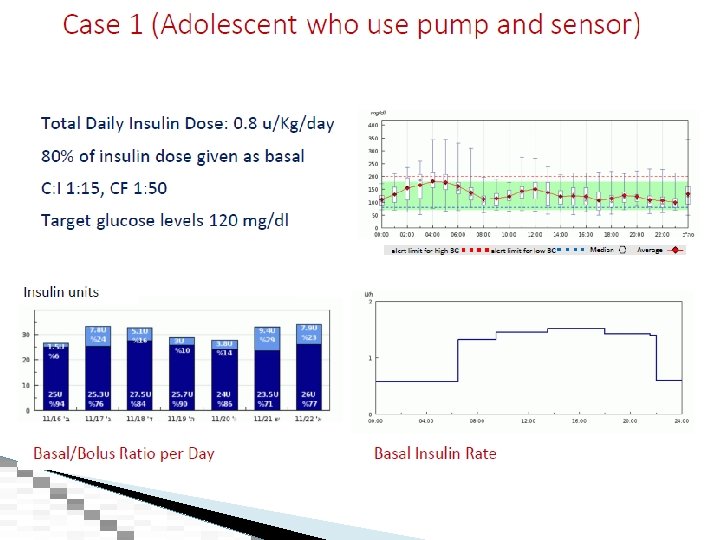
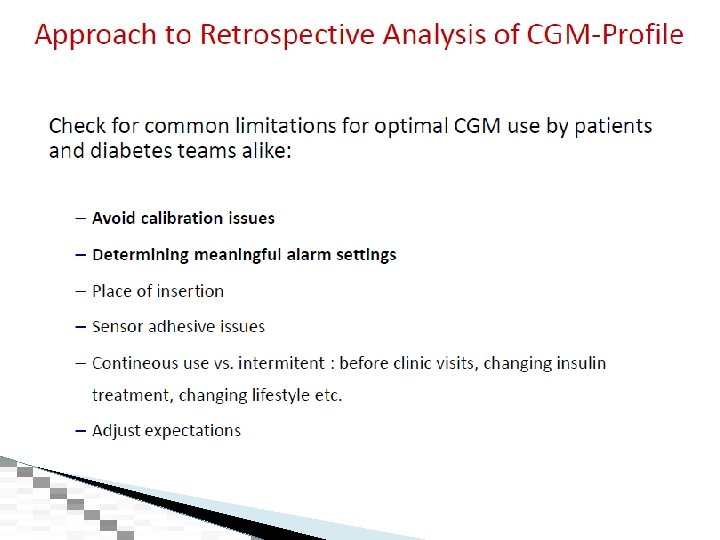
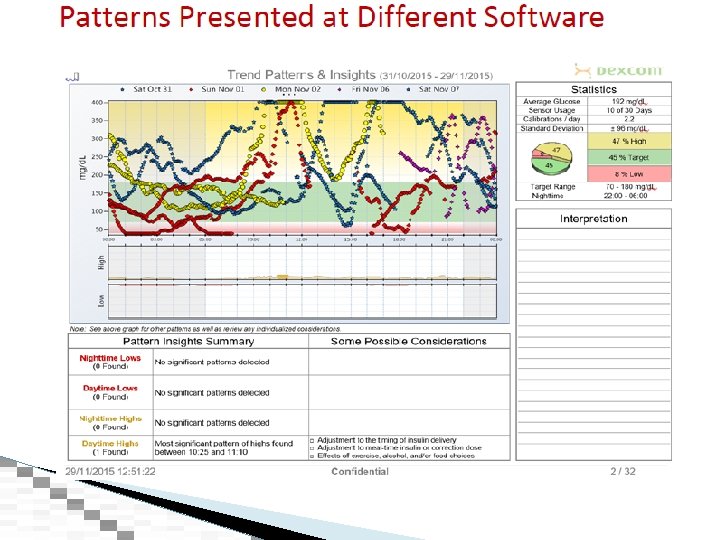
Continuous Glucose Monitoring Data Overall 24 -hour blood glucose patterns over multiple days are displayed: � � Look for overlap patterns at same time of day Look for hypoglycemia – frequency, time of day Check timing of insulin injections, meal choice effect Check for effect of increased physical activity AACE/ACE Consensus Statement on Continuous Glucose Monitoring. 2016
Interpret the Data To… � Look for patterns ◦ Highs and lows occurring at the same time each day � Fix lows first � Basal insulin ◦ Start overnight, then progress through the day � Bolus insulin ◦ Look at glucose response to meals and to correction doses � Now practice!
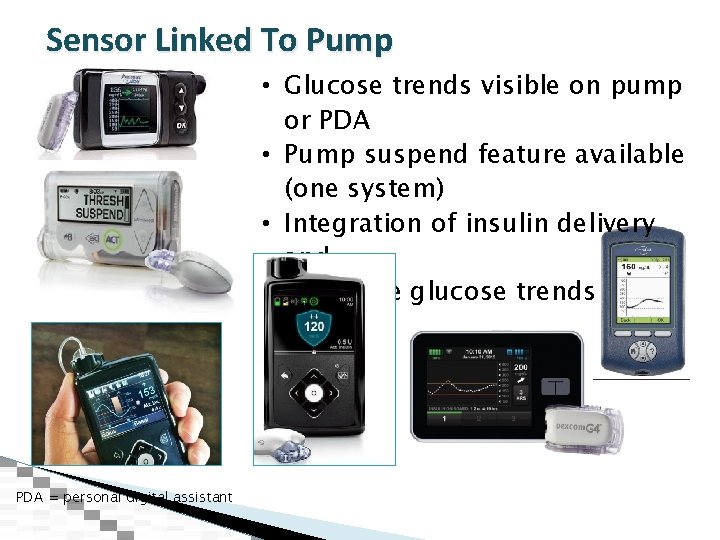
Sensor Linked To Pump • Glucose trends visible on pump or PDA • Pump suspend feature available (one system) • Integration of insulin delivery and real-time glucose trends PDA = personal digital assistant
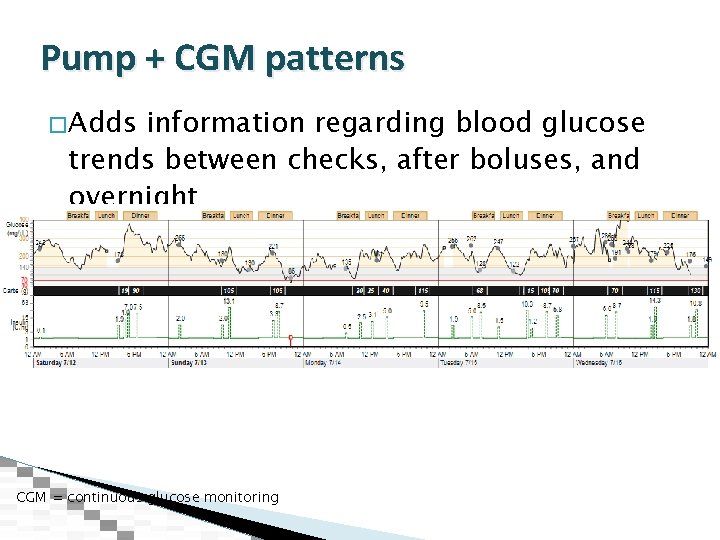
Pump + CGM patterns � Adds information regarding blood glucose trends between checks, after boluses, and overnight CGM = continuous glucose monitoring
Electronic Communication Weekly Academic Endocrinology Metabolism and Nutrition Inc. Wheaton, Naperville, Geneva, IL San Francisco, CA
Irl Hirsch, M. D. - May 2017 AACE
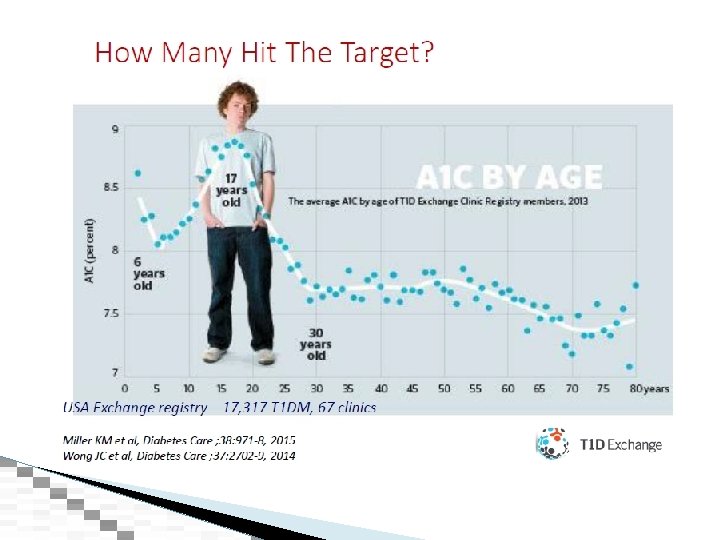
Why… � T 1 D Exchange ◦ The good news is that the A 1 c levels in patient’s over 30 years of age is lower than 8% (1, 2) ◦ Best in 20 years! Nathan DM; DCCT/EDIC Research Group. The diabetes control and complications trial/epidemiology of diabetes interventions and complications study at 30 years: overview. Diabetes Care 2014; 37: 9 -16 2 T 1 D Exchange 1
T 1 D Exchange Update � Bad news… � A 1 c = 8. 2 ± 1. 4% (Sept 1, 2010 - Aug 1, 2012) � A 1 c = 8. 4 ± 1. 6% (Sept 1, 2013 – Dec 1, 2014) *Main increase (13 -25 year olds)4 4 Miller, K, Foster, C, et al. Current State of Type 1 Diabetes Treatment in the U. S: Updated data from the T 1 D exchange clinic registry. Diabetes Care 2015; 38: 971 -978
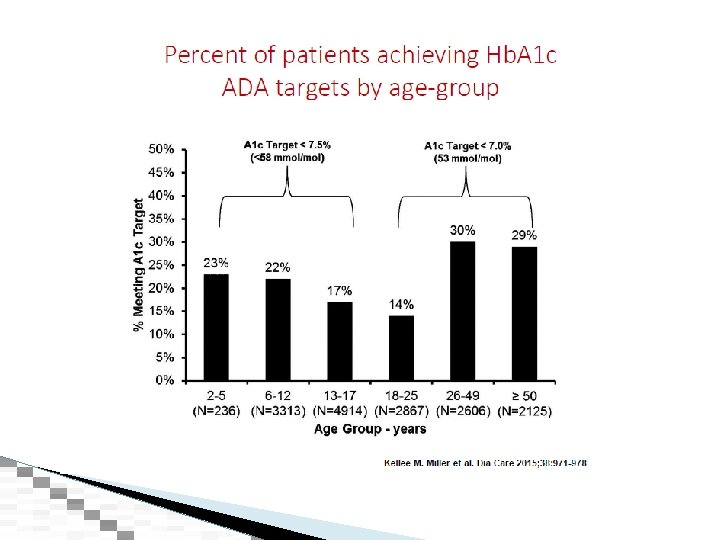
Why… � T 1 D Exchange ◦ The bad news is the A 1 c from 13 -17 year olds has only slightly improved from 9. 5% to 9% ◦ The 9. 5% was seen in the DCCT in 1980 3 3 Diabetes Control and Complications Trial Research Group. Effect of intensive diabetes treatment on the development and progression of long-term complication in adolescents with insulin-dependent diabetes mellitus: Diabetes Control and Complication Trial. J Pediatr 1994; 125: 177 -188 Diabetes Exchanged Update
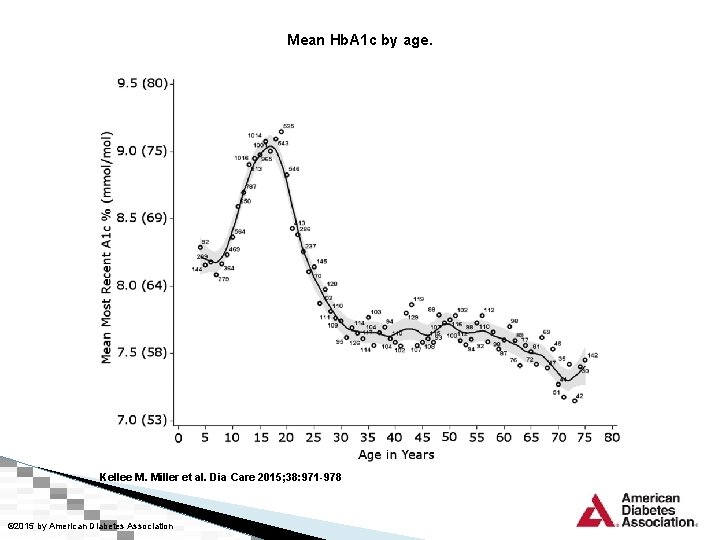
Mean Hb. A 1 c by age. Kellee M. Miller et al. Dia Care 2015; 38: 971 -978 © 2015 by American Diabetes Association
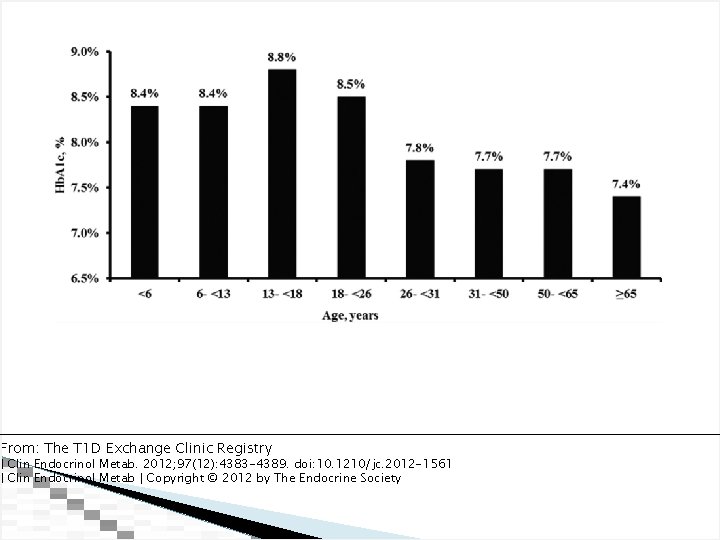
From: The T 1 D Exchange Clinic Registry J Clin Endocrinol Metab. 2012; 97(12): 4383 -4389. doi: 10. 1210/jc. 2012 -1561 J Clin Endocrinol Metab | Copyright © 2012 by The Endocrine Society
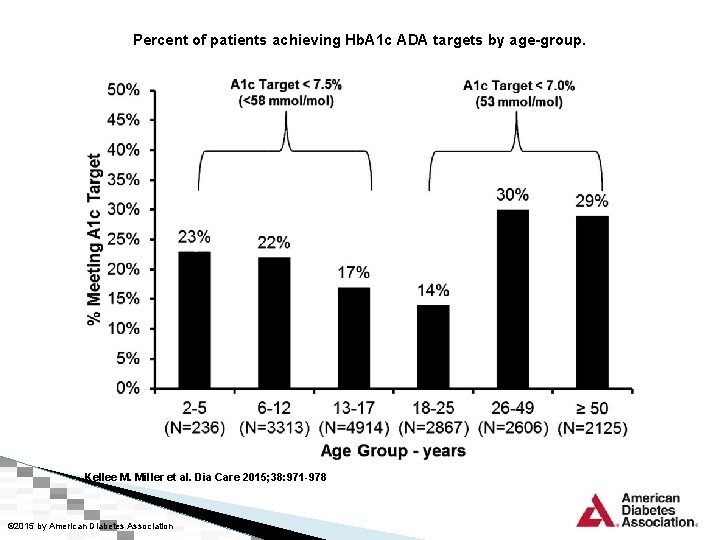
Percent of patients achieving Hb. A 1 c ADA targets by age-group. Kellee M. Miller et al. Dia Care 2015; 38: 971 -978 © 2015 by American Diabetes Association
College transition is a critical time • • Transitioning from home life to dorm life is a big change in a young adult’s life. What is going to change? ▫ ▫ ▫ ▫ ▫ Expectations in Higher Educations Supervision (Continuity of Care) Geography Schedule (exercise) Health maintenance Nutrition Behavior Anxiety Depression
T 1 D Exchange Registry Update 2015 � DCCT/EPIC – persistent benefit of intensive vs conventional glucose control (A 1 c 7. 3 vs 9. 1% during the DCCT) on vascular outcomes 20 years later 5 Writing Team for the Diabetes Control and Complications Trial/Epidemiology of Diabetes Interventions and Complications Research Group. Effect of intensive therapy on the micro-vascular complication of type 1 diabetes mellitus. JAMA 2002; 287: 2563 -2569 5
T 1 D Exchange Registry Update 2015 � Elevated A 1 c seen in adolescents and young adults suggests a similarly elevated risk of future complications until they reach 30 years of age 4 4 Miller, K, Foster, C, et al. Current State of Type 1 Diabetes Treatment in the U. S: Updated data from the T 1 D exchange clinic registry. Diabetes Care 2015; 38: 971 -978
College Health Service Capacity to Support Youth with Chronic Medical Conditions Lemly MD et al. Online www. pediatrics. org/doi/ 10. 1542/peds 20142654
College Health Services � Survey of medical directors � 200 - 4 year US colleges � Enrollment greater than 400 students � To obtain information on support for young people on campus with chronic medical conditions � Result for young people with diabetes : 49% did not have support on campus Electronic communication weekly
The Program, Part 1 (2013 -2016) • • Who: Pump and sensor patients with diabetes What: electronically transmit to Academic Endocrine weekly Why: creates a more productive, healthy, and happy higher education experience How: the patient portal, secure e-mail, and ownership of personal medical record.
How will the program work? • • The patient will agree to wear a pump and sensor, and commit to keep their parent informed. The patient will: ▫ Upload Sunday or Monday each week ▫ Urgent help is available 24 hours a day 7 days a week: 630 -901 -1911 ▫ Receive an e-mail response from the office by Tuesday ▫ Notify us if the patient visits the student health center, emergency room, or needs to use glucagon ▫ Visit our office when home on break
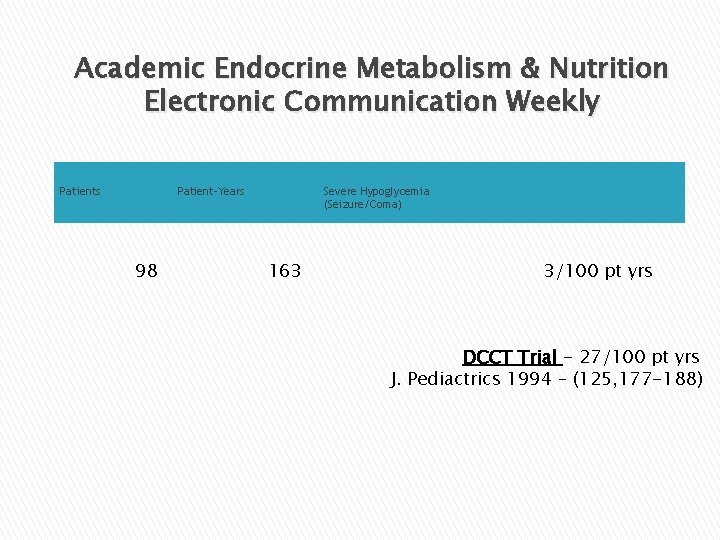
Academic Endocrine Metabolism & Nutrition Electronic Communication Weekly Patients Patient-Years 98 Severe Hypoglycemia (Seizure/Coma) 163 3/100 pt yrs DCCT Trial - 27/100 pt yrs J. Pediactrics 1994 – (125, 177 -188)
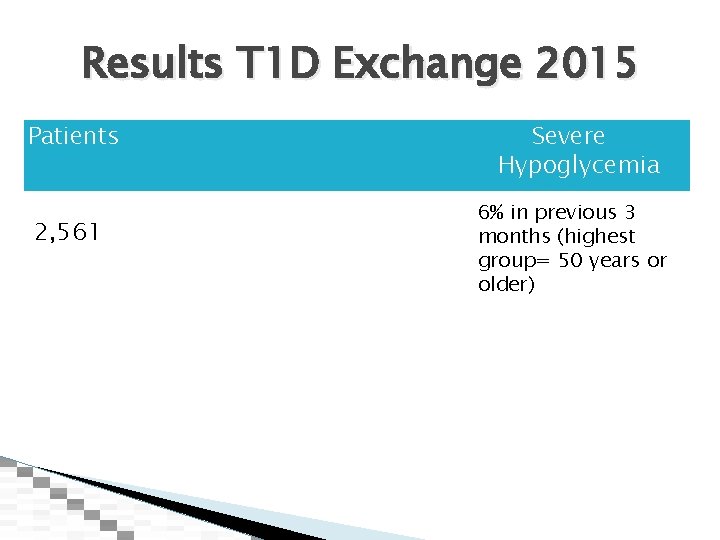
Results T 1 D Exchange 2015 Patients 2, 561 Severe Hypoglycemia 6% in previous 3 months (highest group= 50 years or older)
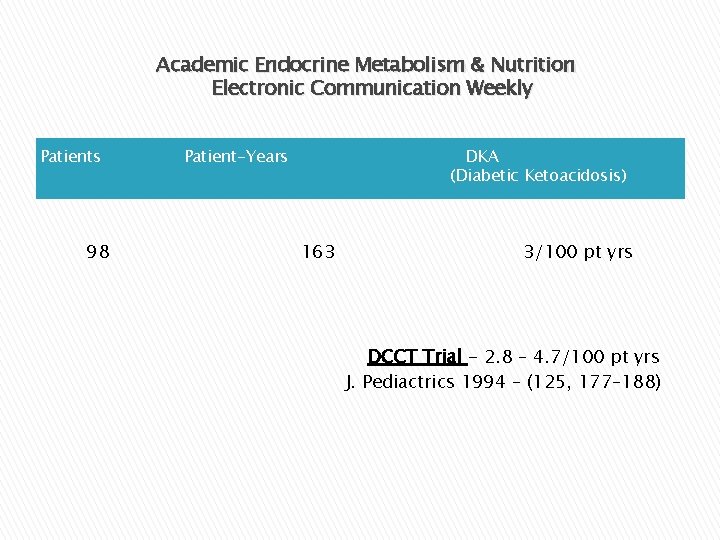
Academic Endocrine Metabolism & Nutrition Electronic Communication Weekly Patients 98 Patient-Years DKA (Diabetic Ketoacidosis) 163 3/100 pt yrs DCCT Trial - 2. 8 – 4. 7/100 pt yrs J. Pediactrics 1994 – (125, 177– 188)
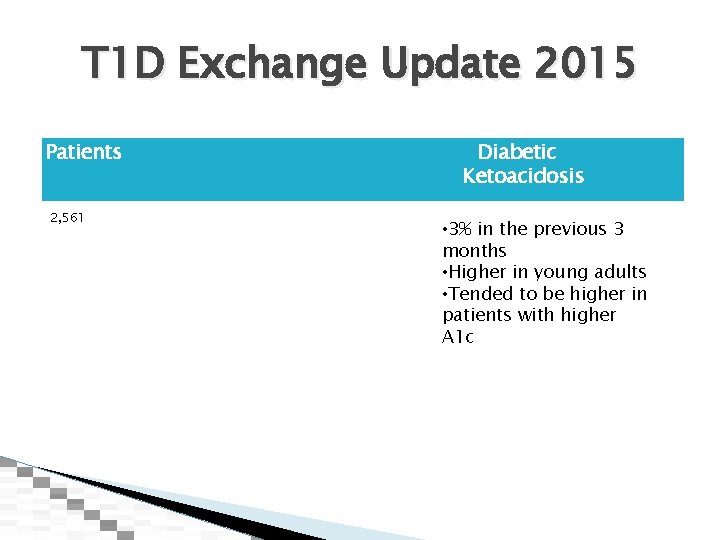
T 1 D Exchange Update 2015 Patients 2, 561 Diabetic Ketoacidosis • 3% in the previous 3 months • Higher in young adults • Tended to be higher in patients with higher A 1 c
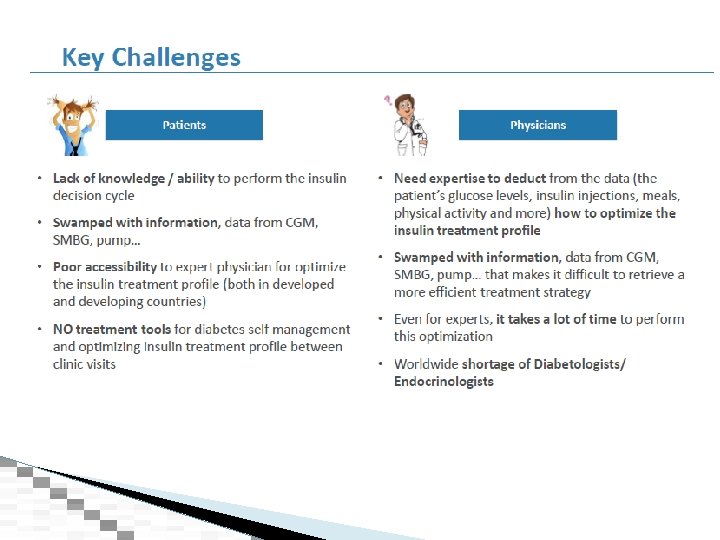
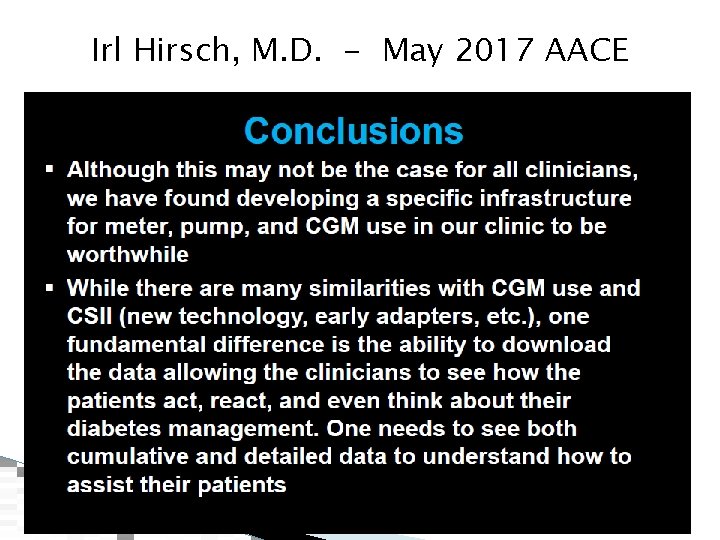
Corollary to Irl Hirsch, M. D. � We now need patients to be able to use the data generated by new technology to feel comfortable safely changing insulin dosages frequently. (Not waiting to their next doctor visit) � All changes done safely in a goal directed manner � We also need to expand our communication technology
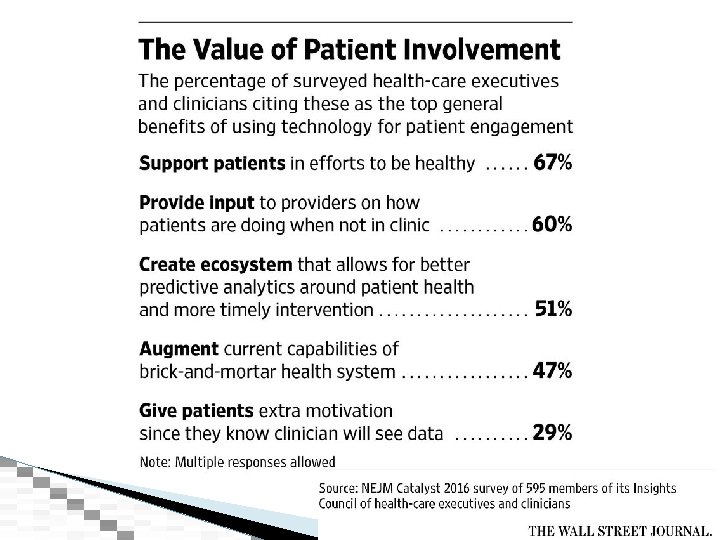
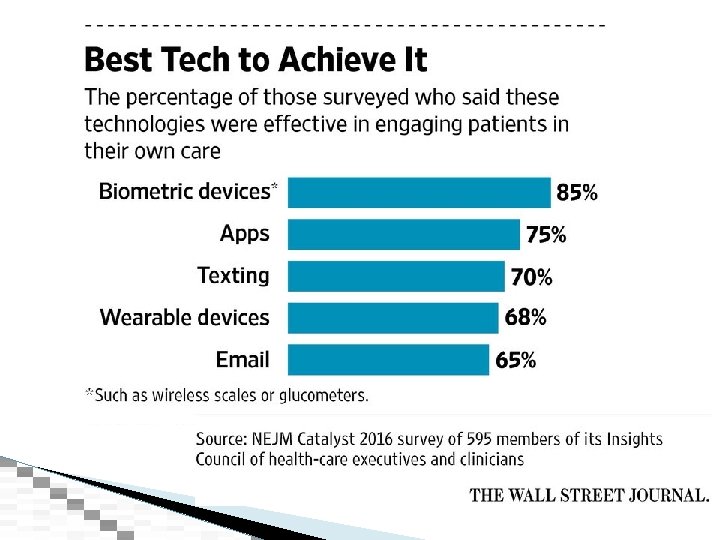
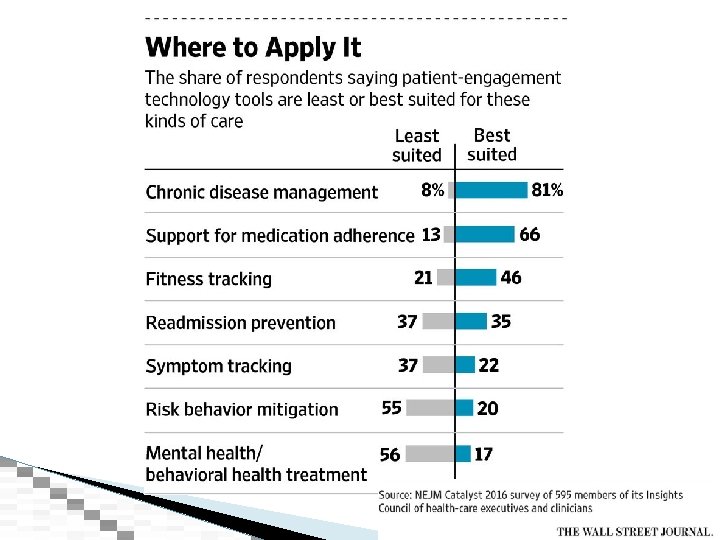
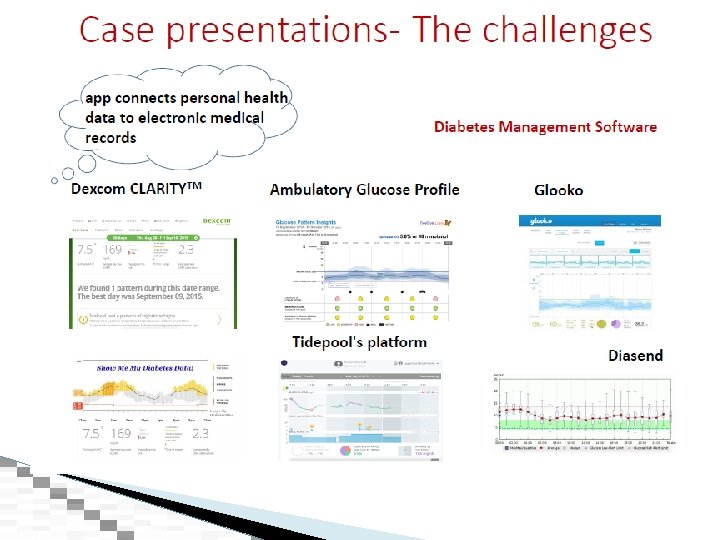
New Problem…. ▶ How to get all patients involved given: ◦ Many monitors and pumps ◦ Many age groups and levels of tech savvy ◦ No single patient portal for communication ▶ ▶ What is the best way to engage the patients to get them to take charge of their own disease and make changes to their insulin levels? How can we monitor compliance and know what is working?
What is Tidepool? Mission ▶ ▶ ▶ What We Believe We believe that you own your own diabetes data. It’s your disease, so it’s your data. If you would like to donate your data to an anonymous database, we’ll make that easy. If you’d like to share data with your doctor, we’ll make that easy, too. We believe that diabetes data should be easily accessible through a secure, modern platform that enables a vibrant ecosystem of applications. We believe in great design, that mobile and web applications should be elegant, intuitive and easy to use. We believe that with the right context, data can be meaningful and actionable. We know that managing Type 1 diabetes is hard. There are lots of things to keep track of. We believe that whatever we do, our job is to help make it just a little bit easier.
Program Part 2: Who… ▶ All patients with pumps/sensors (not just college kids) with any of the major brands of medical devices Why… ▶ ▶ Focus on glucose when patients are not in the office Prevent hypoglycemic seizures Prevent diabetic ketoacidosis Lower Hb. A 1 c
Components of the program *52 weekly downloads electronically reviewed � *12 ECW Diet & Nutrition Updates (in person or online via � gotomeeting) � *12 AEMN Diabetic support groups gotomeeting) (in person or online via *12 ECW Tech support group (in person or online via gotomeeting) � *12 ECW virtual group visits (online via gotomeeting) � Online non-urgent messages (no telephone tag) � 24 hour, 7 days a week emergency line (630) 901 1911 � Prescription refill requests � Secure communication on portal � 24 hour, 7 days a week access to your medical records � Lifestyle friendly care � � *on yearly basis
Diabetes Reporting “Pipeline” How we collect, analyze and present patient information
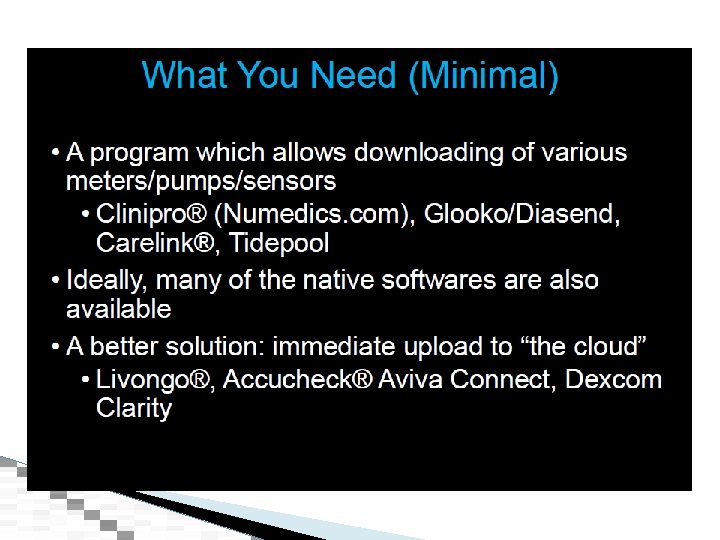
(1) Translate �Patients upload sensor and pump data to Tidepool �Works with Dexcom, Medtronic, Omni. Pod, Tandem devices and more �Tidepool securely collects, stores and translates sensor and pump data �Patients share their data with us
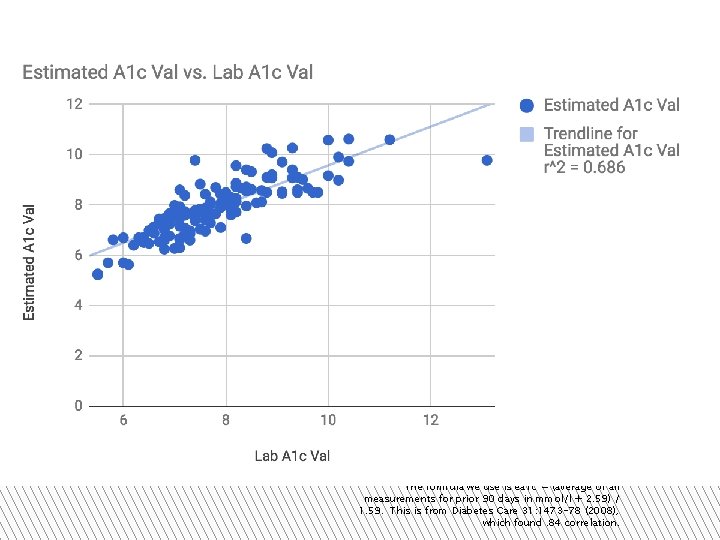
(2) Collect �Our system connects with Tidepool thousands of times per day �We automatically import any new patients from Tidepool every 2 hours �We calculate estimated A 1 Cs for all patients every 10 hours (by getting their data for the last 90 days) �We collect information about the patient (email, name, etc. )
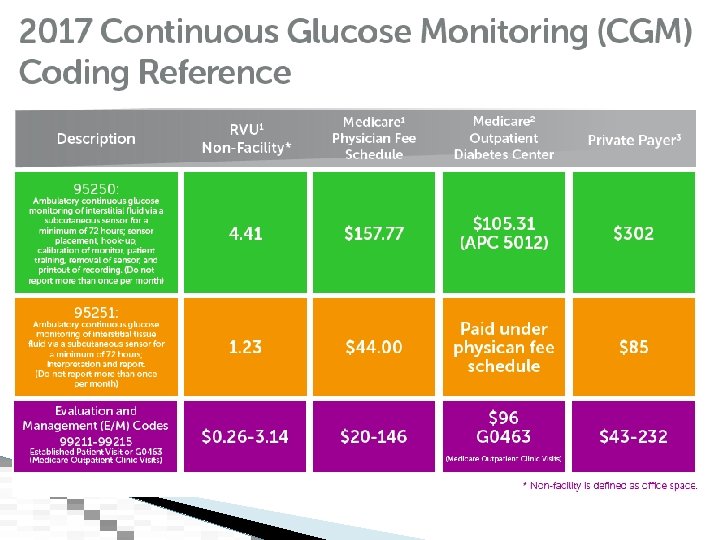
(3) Communicate �We use the information to generate automated reports ◦ To patients (weekly status reports and reminders to upload) ◦ To doctors (a digest with patients having A 1 Cs over 9) ◦ To clinics (a daily report with overall patient averages) ◦ To admins (monthly reports to submit for insurance reimbursement)
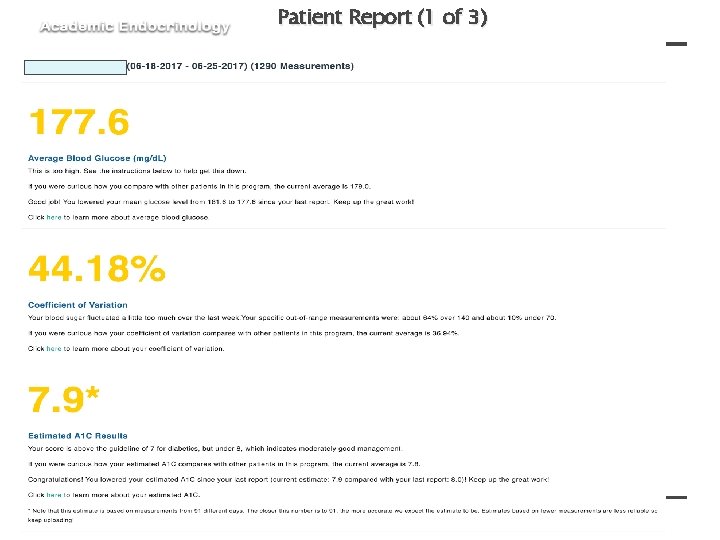
Patient Report (1 of 3)
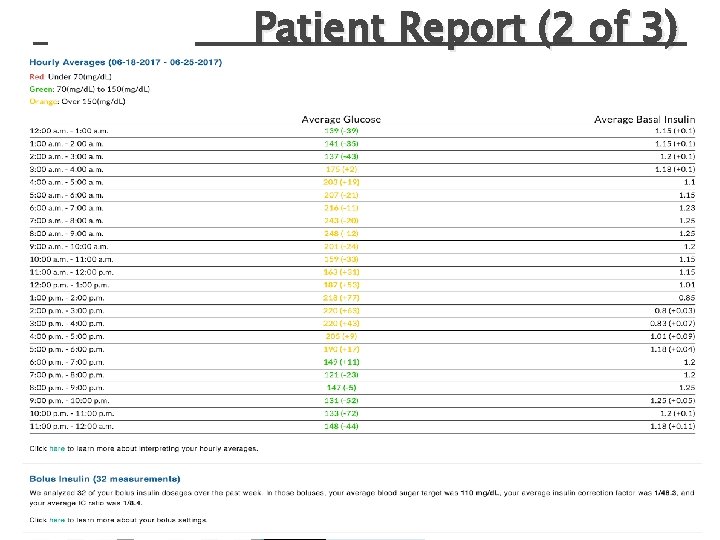
Patient Report (2 of 3)
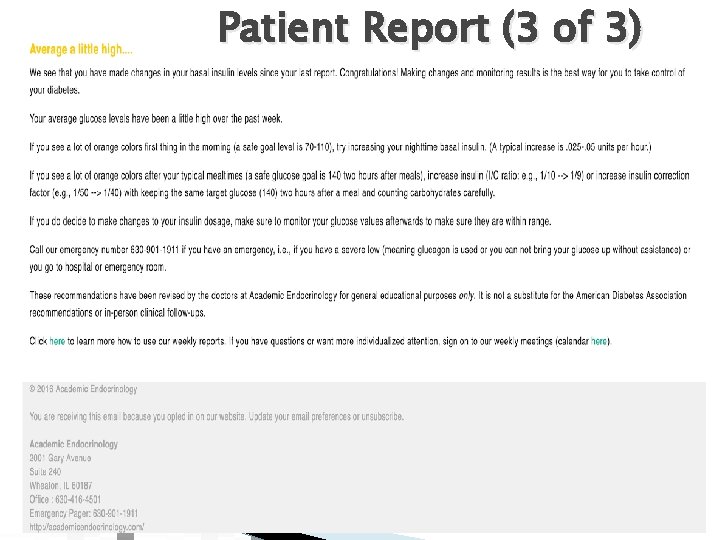
Patient Report (3 of 3)
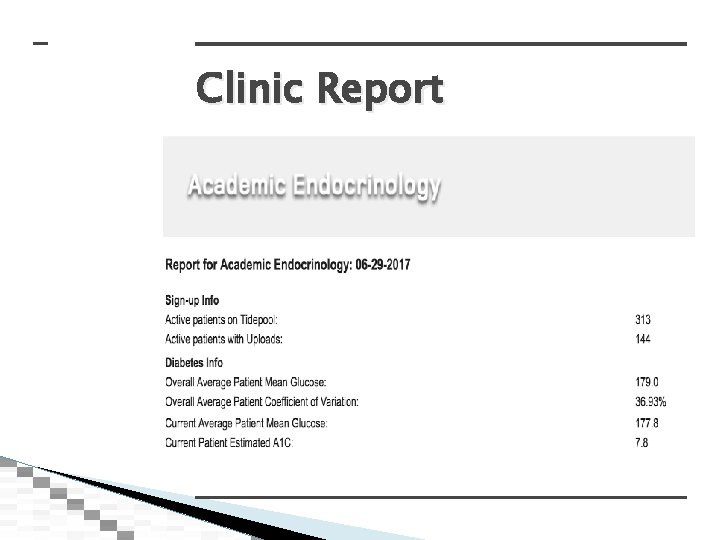
Clinic Report
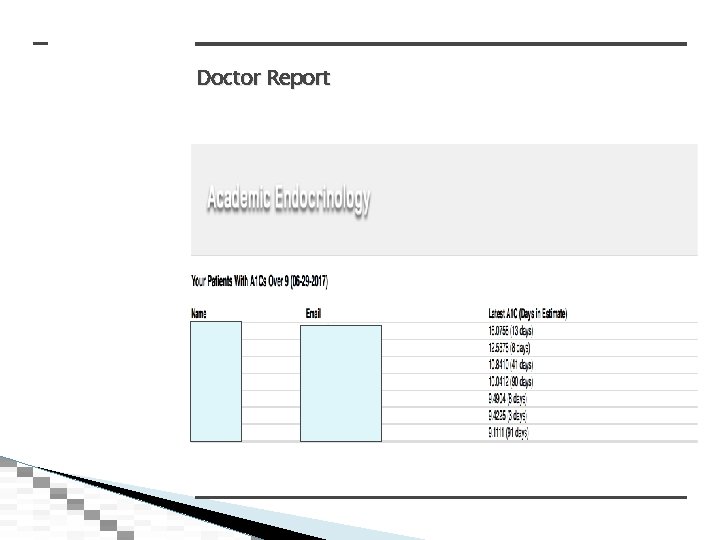
Doctor Report
(4) Explain �FAQs for patients �Weekly online meetings
(5) Review and analyze �Web portal ◦ For doctors (allows doctors to view their patients to determine who needs more attention and to discuss during appointments) ◦ For patients (allows patients to track their own progress)
(6) Future: Predict and Communicate �Use machine learning to predict problems before they happen �Provide better data analysis for patients and doctors, including specific recommendations �Create a secure communication channel for doctors and patients �Provide better diabetes care with better outcomes for less money
Overview �Translate �Collect �Communicate �Explain �Analyze �Predict
*The formula we use is ea 1 c = (average of all measurements for prior 90 days in mmol/l + 2. 59) / 1. 59. This is from Diabetes Care 31: 1473 -78 (2008), which found. 84 correlation.
"The Fallacy of Average: How Using the Hb. A 1 c Alone to Assess Glycemic Control Can be Misleading, " Diabetes Care 2017; 40: 994 -999.
How Do Patients In Our Program Do? ● ● ● N = 199 Patients (patients with uploads as of 8/10/17) Average Age: 17. 97 Total Patient Days in Program (35763) (97. 98 Patient Years) Total Incidences of DKA: 6 Total Incidences of Severe Hypoglycemia/Seizures: 3 Current Average A 1 C Estimate as of 9. 15. 17 (40 or more days of data in estimate) (139 Patients): 7. 8
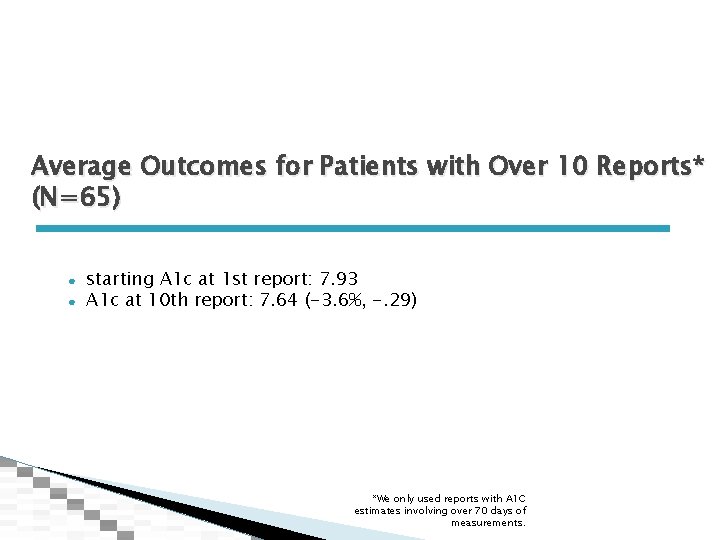
Average Outcomes for Patients with Over 10 Reports* (N=65) ● ● starting A 1 c at 1 st report: 7. 93 A 1 c at 10 th report: 7. 64 (-3. 6%, -. 29) *We only used reports with A 1 C estimates involving over 70 days of measurements.
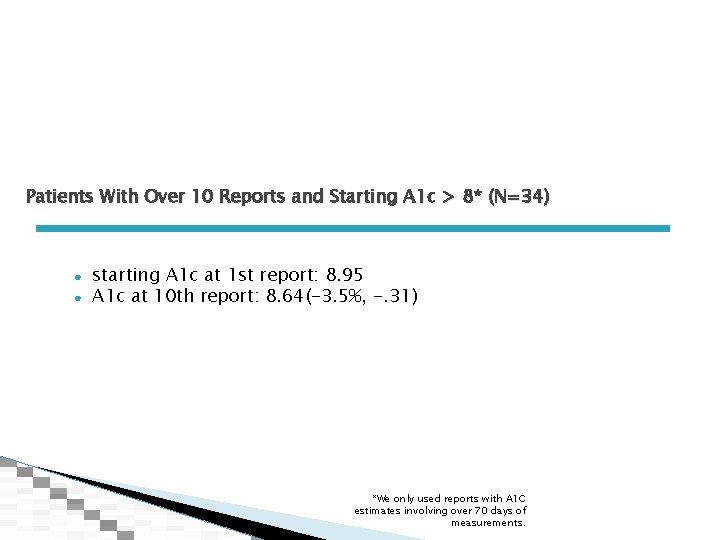
Patients With Over 10 Reports and Starting A 1 c > 8* (N=34) ● ● starting A 1 c at 1 st report: 8. 95 A 1 c at 10 th report: 8. 64(-3. 5%, -. 31) *We only used reports with A 1 C estimates involving over 70 days of measurements.
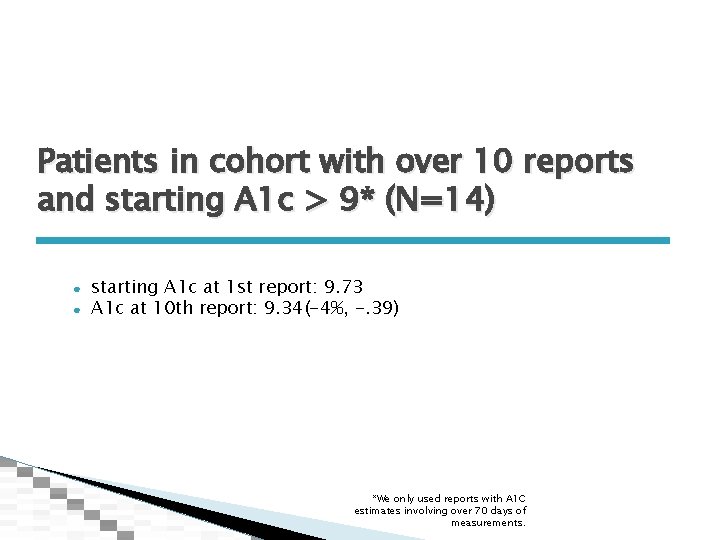
Patients in cohort with over 10 reports and starting A 1 c > 9* (N=14) ● ● starting A 1 c at 1 st report: 9. 73 A 1 c at 10 th report: 9. 34(-4%, -. 39) *We only used reports with A 1 C estimates involving over 70 days of measurements.
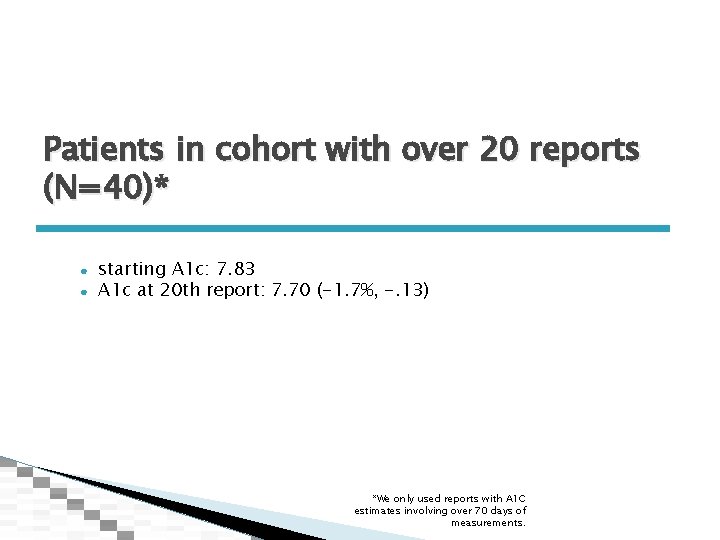
Patients in cohort with over 20 reports (N=40)* ● ● starting A 1 c: 7. 83 A 1 c at 20 th report: 7. 70 (-1. 7%, -. 13) *We only used reports with A 1 C estimates involving over 70 days of measurements.
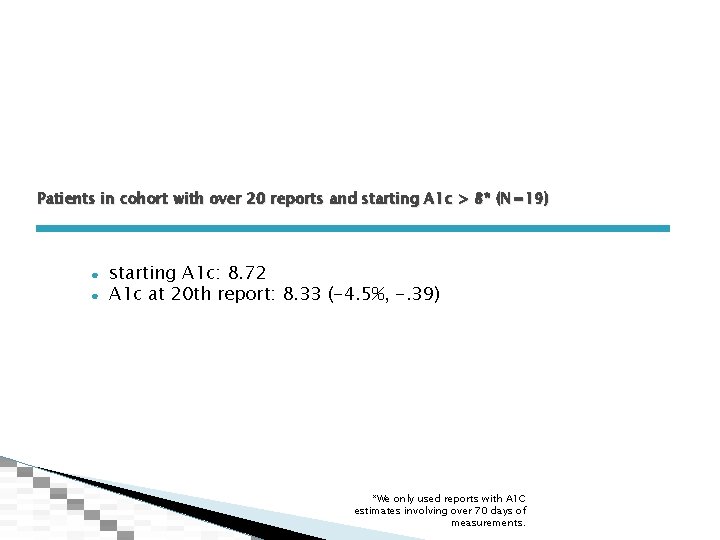
Patients in cohort with over 20 reports and starting A 1 c > 8* (N=19) ● ● starting A 1 c: 8. 72 A 1 c at 20 th report: 8. 33 (-4. 5%, -. 39) *We only used reports with A 1 C estimates involving over 70 days of measurements.
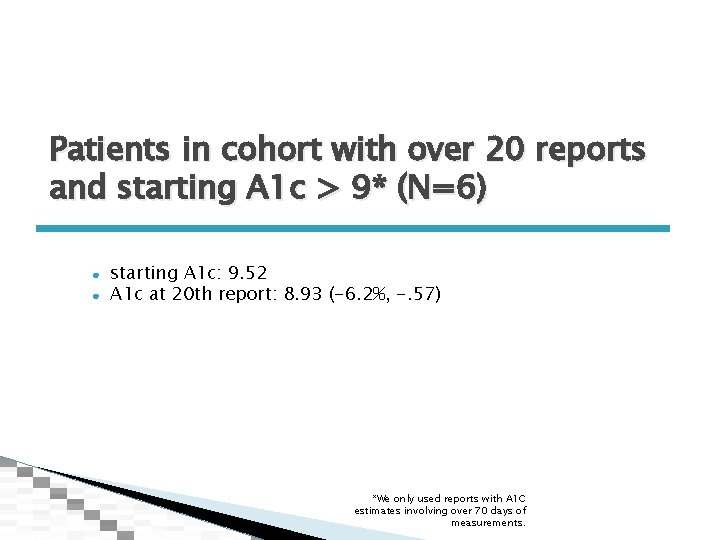
Patients in cohort with over 20 reports and starting A 1 c > 9* (N=6) ● ● starting A 1 c: 9. 52 A 1 c at 20 th report: 8. 93 (-6. 2%, -. 57) *We only used reports with A 1 C estimates involving over 70 days of measurements.
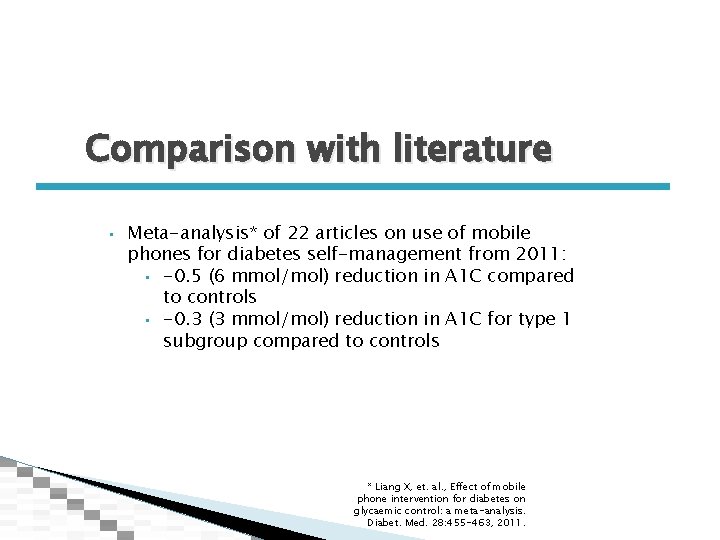
Comparison with literature • Meta-analysis* of 22 articles on use of mobile phones for diabetes self-management from 2011: • -0. 5 (6 mmol/mol) reduction in A 1 C compared to controls • -0. 3 (3 mmol/mol) reduction in A 1 C for type 1 subgroup compared to controls * Liang X, et. al. , Effect of mobile phone intervention for diabetes on glycaemic control: a meta-analysis. Diabet. Med. 28: 455 -463, 2011.
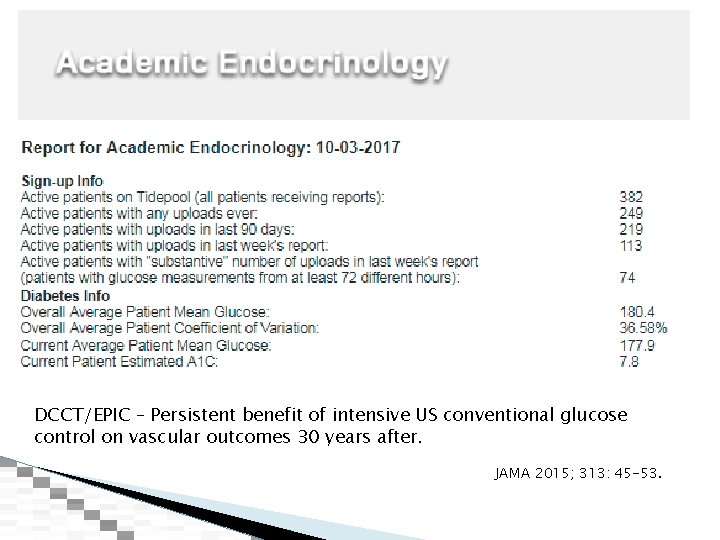
DCCT/EPIC – Persistent benefit of intensive US conventional glucose control on vascular outcomes 30 years after. JAMA 2015; 313: 45 -53.
Once upon a time, diabetes had no treatment. The insulin was discovered and people began to live. Then glucose was able to be monitored carefully and continuously. Then insulin devices began to give insulin continuously. Then electronic communication weekly became possible. Because of insulin, continuous glucose, and electronic communication weekly people were able to live life to the fullest. “How do people treat diabetes uniquely? They use Electronic Communication Weekly. ”
- Slides: 83